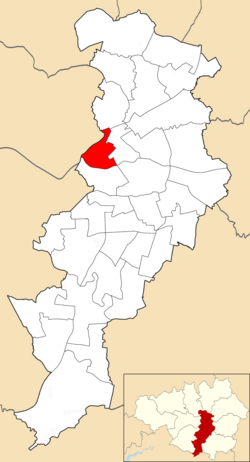
The Deansgate electoral ward of Manchester City Council was created by the Local Government Boundary Commission for England to replace part of the City Centre ward in 2018.[1]
Deansgate | |
|---|---|
 Deansgate electoral ward within Manchester City Council | |
| Motto(s): By wisdom and effort | |
| Coordinates: 53°28′42″N 2°14′58″W / 53.4784°N 2.2494°W | |
| Country | United Kingdom |
| Constituent country | England |
| Region | North West England |
| County | Greater Manchester |
| Metropolitan borough | Manchester |
| Created | December 2017 |
| Named for | Deansgate |
| Government | |
| • Type | Unicameral |
| • Body | Manchester City Council |
| • Leader of the council | Bev Craig (Labour) |
| • Councillor | Anthony McCaul (Labour) |
| • Councillor | Marcus Johns (Labour) |
| • Councillor | Joan Davies (Labour) |
| UK Parliamentary Constituency | Manchester Central |
| Member of Parliament | Lucy Powell |
| UK Parliamentary Constituency | Blackley and Broughton |
| Member of Parliament | Graham Stringer |
Different parts of this ward are represented by different MPs; the majority of the ward is in the Manchester Central constituency but the area north of the railway line through Victoria station is in the Blackley and Broughton constituency.
Councillors
Three councillors serve the ward:[1] William Jeavons, Labour (2019–23),[2] Marcus Johns, Labour (2021–24),[3] and Joan Davies, Labour (2018–22).[4]
| Election | Councillor | Councillor | Councillor | |||
|---|---|---|---|---|---|---|
| 2018 | William Jeavons (Lab) | Marcus Johns (Lab) | Joan Davies (Lab) | |||
| 2019 | William Jeavons (Lab) | Marcus Johns (Lab) | Joan Davies (Lab) | |||
| 2021 | William Jeavons (Lab) | Marcus Johns (Lab) | Joan Davies (Lab) | |||
indicates seat up for election.
Elections in 2020s
* denotes incumbent councillor seeking re-election.
May 2021
| Party | Candidate | Votes | % | ±% | |
|---|---|---|---|---|---|
| Labour Co-op | Marcus Johns* | 1,245 | 53.9 | 12.8  | |
| Liberal Democrats | John Bridges | 583 | 25.3 | 0.6  | |
| Green | Chris Ogden | 256 | 11.1 | 9.9  | |
| Conservative | James Flanagan | 164 | 7.1 | 5.0  | |
| Women's Equality | Samantha Days | 60 | 2.6 | 8.6  | |
| Majority | 662 | 32.6 |  12.2 12.2 | ||
| Rejected ballots | 16 | 0.7 | |||
| Turnout | 2,324 | 28.9 | 9.5  | ||
| Registered electors | 8,047 | ||||
| Labour hold | Swing | 6.1  | |||
Elections in 2010s
May 2019
| Party | Candidate | Votes | % | ±% | |
|---|---|---|---|---|---|
| Labour | William Jeavons* | 497 | 34.8 |  4.0 4.0 | |
| Liberal Democrats | John Bridges | 449 | 31.4 |  6.7 6.7 | |
| Green | Christopher Ogden | 252 | 17.6 |  3.4 3.4 | |
| Conservative | Connor Watson | 126 | 8.8 |  3.9 3.9 | |
| Women's Equality | Sam Johnson | 105 | 7.3 |  3.9 3.9 | |
| Majority | 48 | 3.36 |  10.7 10.7 | ||
| Rejected ballots | 9 | 0.63 | |||
| Turnout | 1429 | 19.81 |  0.43 0.43 | ||
| Registered electors | 7,258 | ||||
| Labour hold | Swing |  5.35 5.35 | |||
May 2018
| Party | Candidate | Votes | % | ±% | |
|---|---|---|---|---|---|
| Labour | Joan Davies* | 782 | 53.3 | ||
| Labour | Marcus Johns | 604 | 41.1 | ||
| Labour | William Jeavons | 570 | 38.8 | ||
| Liberal Democrats | John Bridges | 362 | 24.7 | ||
| Liberal Democrats | Gary McKenna | 311 | 21.2 | ||
| Green | Christopher Ogden | 308 | 21.0 | ||
| Liberal Democrats | George Rice | 285 | 19.4 | ||
| Conservative | Russ George | 196 | 13.4 | ||
| Conservative | Lee Evans | 185 | 12.6 | ||
| Independent | Nick Buckley | 164 | 11.2 | ||
| Women's Equality | Sam Johnson | 164 | 11.2 | ||
| Conservative | Charles Latchford | 151 | 10.3 | ||
| Independent | Giles Grover | 99 | 6.7 | ||
| Majority | 208 | ||||
| Rejected ballots | 2 | 0.026 | |||
| Turnout | 1,468 | 19.38 | |||
| Registered electors | 7,573 | ||||
| Labour win (new seat) | |||||
| Labour win (new seat) | |||||
| Labour win (new seat) | |||||
| Party | Candidates | Seats Won | Votes | Vote % | |
|---|---|---|---|---|---|
| Labour | 3 | 3 | 1,956 | 46.78 | |
| Liberal Democrats | 3 | 0 | 958 | 22.91 | |
| Conservative | 3 | 0 | 532 | 12.72 | |
| Green | 1 | 0 | 308 | 7.37 | |
| Independent | 2 | 0 | 263 | 6.29 | |
| Women's Equality | 1 | 0 | 164 | 3.92 | |
References
🔥 Top keywords: Main PageSpecial:SearchWikipedia:Featured picturesYasukeHarrison ButkerRobert FicoBridgertonCleopatraDeaths in 2024Joyce VincentXXXTentacionHank AdamsIt Ends with UsYouTubeNew Caledonia2024 Indian general electionHeeramandiDarren DutchyshenSlovakiaKingdom of the Planet of the ApesAttempted assassination of Robert FicoLawrence WongBaby ReindeerXXX: Return of Xander CageThelma HoustonFuriosa: A Mad Max SagaMegalopolis (film)Richard GaddKepler's SupernovaWicked (musical)Sunil ChhetriXXX (2002 film)Ashley MadisonAnya Taylor-JoyPlanet of the ApesNava MauYoung SheldonPortal:Current eventsX-Men '97
