Demographic features of the population of the Netherlands include population density, ethnicity, education level, health of the population, economic status, religious affiliations and other aspects of the population.
| Demographics of the Netherlands | |
|---|---|
 Population pyramid of the Netherlands in 2023 | |
| Population | 17,821,419 (January 2023) (67th) |
| Density | 424 per km2 (33rd) |
| Growth rate | 0.29% (155th) |
| Birth rate | 10.2 births/1,000 (2021) |
| Death rate | 9.6 deaths/1,000 (2022) |
| Life expectancy | 81.6 years (16th) |
| • male | 80.1 years |
| • female | 83.1 years |
| Fertility rate | 1.49 children/woman (2022) |
| Age structure | |
| 0–14 years | 16.1% |
| 15–64 years | 64.1% |
| 65 and over | 20.2% |
| Sex ratio | |
| Total | 0.98 male/female |
| At birth | 1.05 male/female |
| Under 15 | 1.05 male/female |
| 15–64 years | 1.02 male/female |
| 65 and over | 0.83 male/female |
| Language | |
| Official | Dutch, Frisian |

Population
The Netherlands is the 67th most populated country in the world. As of January 2023, the Netherlands has a population of 17,821,419.[1]
Between 1900 and 1950 the population almost doubled from 5.14 to 10.11 million people. From 1950 to 2000 the population increased from 10.11 to 15.92 million people, increasing by a smaller proportion but, still, at an impressive pace for a European country, recording a growth of 57.45% over a 50-year time span.[2]
Of countries with at least 7.5 million people, The Netherlands is the 4th most densely populated, and is the 33rd most densely populated in the world overall. It is the 5th most densely populated country in Europe; the first four are microstates. The 17,821,419 million Dutch inhabitants are concentrated on an area of 41,543 km2 (16,040 sq mi) including water surface, the land surface being 33,895 km2 (13,087 sq mi). This means that the country has a population density of 526/km2 (1,360/sq mi). The density of 500 inhabitants/km2 was reached in the first half of 2014.
As a result of these demographic characteristics, the Netherlands has had to plan its land use strictly. Since 1946 the Ministry of Housing, Spatial Planning and the Environment has been occupied with the national coordination of land use. Because of its high population density the Netherlands has also reclaimed land from the sea by poldering. Between 1927 and 1968 an entire province - Flevoland - was created. As of May 2023 it houses 447,193 people.[3] Because of these policies, the Dutch have been able to combine high levels of population density with extremely high levels of agricultural production.
Even though the Netherlands is so densely populated, it has no municipalities with a population over one million. Nevertheless, the two largest municipalities of the country do score well over a million if the complete city region is counted, thus including the neighbouring satellite towns that often are physically connected to the main municipality. Moreover, the "four big cities" (Amsterdam, Rotterdam, The Hague and Utrecht) can in many ways be regarded as a single metropolitan area, the Randstad ("rim city" or "edge city") with over 7.5 million inhabitants around an agricultural "green heart" (Groene Hart).
Demographic statistics according to the World Population Review in 2019.[4]
- One birth every 3 minutes
- One death every 4 minutes
- One net migrant every 31 minutes
- Net gain of one person every 11 minutes
Growth rate
0.37% (2021 est.) Country comparison to the world: 168th
Fertility
| Year | Pop. | ±% p.a. |
|---|---|---|
| 1000 | 369,000 | — |
| 1300 | 881,000 | +0.29% |
| 1500 | 1,090,000 | +0.11% |
| 1600 | 1,540,000 | +0.35% |
| 1700 | 2,000,000 | +0.26% |
| 1800 | 2,000,000 | +0.00% |
| 1900 | 5,104,000 | +0.94% |
| 1910 | 5,858,000 | +1.39% |
| 1920 | 6,754,000 | +1.43% |
| 1930 | 7,825,000 | +1.48% |
| 1940 | 8,834,000 | +1.22% |
| 1950 | 10,026,773 | +1.27% |
| 1960 | 11,417,254 | +1.31% |
| 1970 | 12,957,621 | +1.27% |
| 1980 | 14,091,014 | +0.84% |
| 1990 | 14,892,574 | +0.55% |
| 2000 | 15,863,950 | +0.63% |
| 2010 | 16,574,989 | +0.44% |
| 2020 | 17,424,978 | +0.50% |
| Source: Our World in Data[6] and Statistics Netherlands[7] | ||
The Dutch population is ageing. Furthermore, life expectancy has increased because of developments in medicine, and in addition to this, the Netherlands has seen increasing immigration. Despite these developments combined with the population boom after the Second World War, the low birth rate has caused extremely low population growth: 2005 saw the lowest absolute population growth since 1900.
This demographic development has consequences for health care and social security policy. As the Dutch population ages, the proportion of people of working age, as a percentage of the entire population, decreases. Important policy advisors like the CBS (Statistical Office) and the CPB (Planning Office) have pointed out that this will cause problems with the current system of old age pensions: fewer people will work to pay for old age pensions, while there will be more people receiving those pensions. Furthermore, the costs of health care are also projected to increase. These developments have caused several cabinets, notably the second Balkenende cabinet to reform the system of health care and social security to increase participation in the labour market and make people more conscious of the money they spend on health care.
In 2003, the annual birth rate per thousand was highest in the province of Flevoland (15.9). The overall lifelong Total fertility rate (TFR), was highest in the province of Flevoland (2.0) and lowest in the province of Limburg (1.6). The municipality with the highest TFR was Urk (3.23) followed by Valkenburg (2.83), Graafstroom (2.79) and Staphorst (2.76). The lowest TFRs were recorded in Vaals (1.11) and Thorn (1.21).[8]
The total population at December 31, 2006 was 16,356,914. The population loss due to net emigration was 35,502 (an estimated 40-50% of emigrants were ethnic non-Dutch).
In 2007, there were 117,000 immigrants (including 7000 Germans, 6000 Poles, 5000 Bulgarians, 3000 Turks and 2000 Moroccans) and 123,000 emigrants. Nearly half the emigrants were native Dutch, followed at a distance by nearly 5000 Poles and more than 3000 Germans. There was an observable increase in net immigration from the former USSR, Bulgaria and Romania.[9]
The annual death rate was lowest in the municipalities of Valkenburg (2.9 per 1000), Zeewolde (3.2), Renswoude (3.4), Westervoort and Zeevang (both 3.9). The highest annual death rates were recorded in Warmond (22.3 per 1000), Laren (19.9) and Doorn (18.8).[10]
16.4% of the total births in 2003 were to parents of non-European origin, although they account for only 12.4% of the population in the 25-34 age group. For example, 3.8% of the births were ethnic Moroccan, although they were only 2.26% of the 25-34 age group. Respective figures were 3.27% and 3.0% for Turks. The TFR for Moroccans in 2003 was 3.3 while the general TFR was 1.73. TFR was 2.3 for Turks, 1.7 for Surinamese, 1.8 for Arubans, 3.0 for Africans and 1.8 for Americans.[11] (These figures compare with a figure of around 2.1 required to maintain a stable overall population figure.)
According to Statistics Netherlands, for the year 2007, the TFR for those born in Netherlands was 1.72[12] (1.65 in 2000). TFR of Moroccan immigrants was 2.87 (3.22 in 2000) and that of Turkish immigrants was 1.88 (2.18 in 2000).[13]
The total fertility rate is the annual average number of children born per woman over her lifespan. It is based on fairly good data for the entire period. Sources: Our World In Data and Gapminder Foundation.[14]
| Years | 1840 | 1841 | 1842 | 1843 | 1844 | 1845 | 1846 | 1847 | 1848 | 1849 | 1850[14] |
|---|---|---|---|---|---|---|---|---|---|---|---|
| Total Fertility Rate in the Netherlands | 5.11 | 5.09 | 5.06 | 5.04 | 5.02 | 4.99 | 4.99 | 4.99 | 4.99 | 4.99 | 4.89 |
| Years | 1851 | 1852 | 1853 | 1854 | 1855 | 1856 | 1857 | 1858 | 1859 | 1860[14] |
|---|---|---|---|---|---|---|---|---|---|---|
| Total Fertility Rate in the Netherlands | 4.8 | 4.7 | 4.6 | 4.6 | 4.6 | 4.6 | 4.6 | 4.6 | 4.68 | 4.75 |
| Years | 1861 | 1862 | 1863 | 1864 | 1865 | 1866 | 1867 | 1868 | 1869 | 1870[14] |
|---|---|---|---|---|---|---|---|---|---|---|
| Total Fertility Rate in the Netherlands | 4.83 | 4.9 | 4.98 | 4.99 | 5.01 | 5.02 | 5.04 | 5.05 | 5.09 | 5.12 |
| Years | 1871 | 1872 | 1873 | 1874 | 1875 | 1876 | 1877 | 1878 | 1879 | 1880[14] |
|---|---|---|---|---|---|---|---|---|---|---|
| Total Fertility Rate in the Netherlands | 5.16 | 5.19 | 5.23 | 5.27 | 5.31 | 5.34 | 5.38 | 5.42 | 5.39 | 5.35 |
| Years | 1881 | 1882 | 1883 | 1884 | 1885 | 1886 | 1887 | 1888 | 1889 | 1890[14] |
|---|---|---|---|---|---|---|---|---|---|---|
| Total Fertility Rate in the Netherlands | 5.32 | 5.28 | 5.25 | 5.23 | 5.21 | 5.18 | 5.16 | 5.14 | 5.11 | 5.07 |
| Years | 1891 | 1892 | 1893 | 1894 | 1895 | 1896 | 1897 | 1898 | 1899[14] |
|---|---|---|---|---|---|---|---|---|---|
| Total Fertility Rate in the Netherlands | 5.04 | 5 | 4.97 | 4.93 | 4.88 | 4.84 | 4.79 | 4.75 | 4.6 |
1.78 children born/woman (2021 est.) Country comparison to the world: 157th
11.0 births/1,000 population (2021 est.) Country comparison to the world: 178th
Mother's mean age at first birth
- 29.8 years (2017 est.)
Life expectancy


Sources: Our World In Data
1850–1950
| Years | 1850 | 1851 | 1852 | 1853 | 1854 | 1855 | 1856 | 1857 | 1858 | 1859 | 1860[15] |
|---|---|---|---|---|---|---|---|---|---|---|---|
| Life expectancy in the Netherlands | 39.8 | 40.0 | 38.6 | 38.6 | 38.6 | 34.5 | 38.8 | 35.5 | 34.7 | 30.9 | 36.9 |
| Years | 1861 | 1862 | 1863 | 1864 | 1865 | 1866 | 1867 | 1868 | 1869 | 1870[15] |
|---|---|---|---|---|---|---|---|---|---|---|
| Life expectancy in the Netherlands | 36.4 | 38.3 | 38.3 | 37.5 | 36.4 | 33.6 | 39.2 | 37.7 | 40.4 | 37.3 |
| Years | 1871 | 1872 | 1873 | 1874 | 1875 | 1876 | 1877 | 1878 | 1879 | 1880[15] |
|---|---|---|---|---|---|---|---|---|---|---|
| Life expectancy in the Netherlands | 32.9 | 36.5 | 39.2 | 41.3 | 38.2 | 40.4 | 42.0 | 41.1 | 41.9 | 40.3 |
| Years | 1881 | 1882 | 1883 | 1884 | 1885 | 1886 | 1887 | 1888 | 1889 | 1890[15] |
|---|---|---|---|---|---|---|---|---|---|---|
| Life expectancy in the Netherlands | 42.8 | 43.7 | 42.3 | 41.3 | 43.2 | 41.9 | 44.9 | 44.2 | 44.3 | 44.4 |
| Years | 1891 | 1892 | 1893 | 1894 | 1895 | 1896 | 1897 | 1898 | 1899 | 1900[15] |
|---|---|---|---|---|---|---|---|---|---|---|
| Life expectancy in the Netherlands | 44.2 | 43.9 | 45.8 | 46.9 | 46.6 | 48.6 | 49.4 | 49.1 | 49.3 | 48.4 |
| Years | 1901 | 1902 | 1903 | 1904 | 1905 | 1906 | 1907 | 1908 | 1909 | 1910[15] |
|---|---|---|---|---|---|---|---|---|---|---|
| Life expectancy in the Netherlands | 48.7 | 50.6 | 51.5 | 50.9 | 52.1 | 52.7 | 53.5 | 52.7 | 54.9 | 55.1 |
| Years | 1911 | 1912 | 1913 | 1914 | 1915 | 1916 | 1917 | 1918 | 1919 | 1920[15] |
|---|---|---|---|---|---|---|---|---|---|---|
| Life expectancy in the Netherlands | 53.1 | 57.2 | 57.3 | 57.2 | 57.2 | 56.2 | 55.6 | 47.6 | 55.0 | 57.8 |
| Years | 1921 | 1922 | 1923 | 1924 | 1925 | 1926 | 1927 | 1928 | 1929 | 1930[15] |
|---|---|---|---|---|---|---|---|---|---|---|
| Life expectancy in the Netherlands | 59.7 | 59.8 | 62.0 | 62.9 | 63.1 | 63.0 | 62.6 | 63.7 | 62.2 | 64.7 |
| Years | 1931 | 1932 | 1933 | 1934 | 1935 | 1936 | 1937 | 1938 | 1939 | 1940[15] |
|---|---|---|---|---|---|---|---|---|---|---|
| Life expectancy in the Netherlands | 64.3 | 65.4 | 66.0 | 66.6 | 66.5 | 66.7 | 67.0 | 67.4 | 67.7 | 65.4 |
| Years | 1941 | 1942 | 1943 | 1944 | 1945 | 1946 | 1947 | 1948 | 1949 | 1950[15] |
|---|---|---|---|---|---|---|---|---|---|---|
| Life expectancy in the Netherlands | 65.3 | 65.8 | 64.4 | 61.3 | 55.4 | 67.6 | 69.5 | 71.1 | 70.3 | 71.4 |
- total population: 81.9 years (2020 est.) Country comparison to the world: 30th
- male: 79.7 years (2020 est.)
- female: 84.3 years (2020 est.)
Age structure

- 0-14 years: 16.11% (male 1,425,547 /female 1,358,894)
- 15-24 years: 11.91% (male 1,049.000 /female 1,008,763)
- 25-54 years: 38.47% (male 3,334,064 /female 3,313,238)
- 55-64 years: 13.69% (male 1,177,657/female 1,188,613)
- 65 years and over: 19.82% (male 1,558,241/female 1,866,380) (2020 est.)
Median age
- total: 42.8 years. Country comparison to the world: 32nd
- male: 41.6 years
- female: 44.0 years (2020 est.)
Cities and population density
| Rank | Name | Province | Pop. | Rank | Name | Province | Pop. | ||
|---|---|---|---|---|---|---|---|---|---|
 Amsterdam .jpg) Rotterdam | 1 | Amsterdam | North Holland | 905,234 | 11 | Apeldoorn | Gelderland | 165,648 |  The Hague  Utrecht |
| 2 | Rotterdam | South Holland | 656,050 | 12 | Arnhem | Gelderland | 164,096 | ||
| 3 | The Hague | South Holland | 552,995 | 13 | Haarlem | North Holland | 162,914 | ||
| 4 | Utrecht | Utrecht | 361,924 | 14 | Enschede | Overijssel | 160,383 | ||
| 5 | Eindhoven | North Brabant | 238,478 | 15 | Haarlemmermeer | North Holland | 159,346 | ||
| 6 | Groningen | Groningen | 234,649 | 16 | Amersfoort | Utrecht | 158,712 | ||
| 7 | Tilburg | North Brabant | 224,702 | 17 | Zaanstad | North Holland | 157,215 | ||
| 8 | Almere | Flevoland | 218,096 | 18 | 's-Hertogenbosch | North Brabant | 156,599 | ||
| 9 | Breda | North Brabant | 184,716 | 19 | Zwolle | Overijssel | 130,872 | ||
| 10 | Nijmegen | Gelderland | 179,073 | 20 | Leeuwarden | Friesland | 127,088 | ||
Functional urban areas

"Functional urban areas"[17] are a type of urban areas with large populations where commuters from nearby areas work in the core area. There are several functional urban areas officially identified in the Netherlands. The largest ones (with populations over 300,000) are listed below, which count the populations of the core city and their "commuting zones".[18]
| Functional urban areas | Population (2015) |
|---|---|
| Amsterdam-Haarlem-Almere | 2,751,000 |
| Rotterdam-Dordrecht | 1,805,000 |
| The Hague-Delft | 1,052,000 |
| Utrecht | 875,000 |
| Eindhoven | 736,000 |
| Groningen | 474,000 |
| Arnhem | 420,000 |
| Enschede | 401,000 |
| Breda | 367,000 |
| Zwolle | 350,000 |
| Leiden | 339,000 |
| Nijmegen | 322,000 |
| Tilburg | 310,000 |
Vital statistics
The following table presents the evolution since 1900; click on "show" to display the table:[19]
| Population (January 1) | Live births (total) | Deaths (total) | Natural change (total) | Birth rate (per mille) | Mortality rate (per mille) | Natural change (per mille) | Crude migration change (per mille) | TFR | IMR (per mille) | Life expectancy males | Life expectancy females | |
|---|---|---|---|---|---|---|---|---|---|---|---|---|
| 1900 | 5,142,000 | 162,611 | 92,043 | 70,568 | 31.6 | 17.9 | 13.7 | 1.7 | 4.45 | 155.2 | ||
| 1901 | 5,221,000 | 168,380 | 89,967 | 78,413 | 32.3 | 17.2 | 15.0 | 1.1 | 4.53 | 149.3 | ||
| 1902 | 5,305,000 | 168,728 | 86,248 | 82,480 | 31.8 | 16.3 | 15.5 | 0.3 | 4.46 | 129.9 | ||
| 1903 | 5,389,000 | 170,108 | 83,933 | 86,175 | 31.6 | 15.6 | 16.0 | -1.0 | 4.42 | 135.1 | ||
| 1904 | 5,470,000 | 171,495 | 87,091 | 84,404 | 31.4 | 15.9 | 15.4 | -0.6 | 4.38 | 136.9 | ||
| 1905 | 5,551,000 | 170,767 | 85,016 | 85,751 | 30.8 | 15.3 | 15.4 | -0.8 | 4.29 | 130.9 | ||
| 1906 | 5,632,000 | 170,952 | 83,259 | 87,693 | 30.4 | 14.8 | 15.6 | -1.8 | 4.23 | 127.1 | ||
| 1907 | 5,710,000 | 171,506 | 82,250 | 89,256 | 30.0 | 14.4 | 15.6 | -2.3 | 4.18 | 111.9 | ||
| 1908 | 5,786,000 | 171,861 | 86,936 | 84,925 | 29.7 | 15.0 | 14.7 | -1.6 | 4.13 | 124.8 | ||
| 1909 | 5,862,000 | 170,766 | 80,283 | 90,483 | 29.1 | 13.7 | 15.4 | -9.1 | 4.04 | 99.1 | ||
| 1910 | 5,899,000 | 168,894 | 79,984 | 88,910 | 28.6 | 13.6 | 15.1 | -2.0 | 3.94 | 107.9 | ||
| 1911 | 5,976,000 | 166,527 | 86,786 | 79,741 | 27.9 | 14.5 | 13.3 | -0.2 | 3.81 | 137.2 | ||
| 1912 | 6,054,000 | 170,269 | 74,647 | 95,622 | 28.1 | 12.3 | 15.8 | -0.8 | 3.84 | 87.0 | ||
| 1913 | 6,145,000 | 173,541 | 75,867 | 97,674 | 28.2 | 12.3 | 15.9 | 1.3 | 3.85 | 91.4 | ||
| 1914 | 6,251,000 | 176,831 | 77,739 | 99,092 | 28.3 | 12.4 | 15.9 | 2.2 | 3.86 | 94.8 | ||
| 1915 | 6,364,000 | 167,426 | 79,613 | 87,813 | 26.3 | 12.5 | 13.8 | 4.4 | 3.59 | 86.8 | ||
| 1916 | 6,480,000 | 172,572 | 84,024 | 88,548 | 26.6 | 13.0 | 13.7 | 6.7 | 3.64 | 84.5 | ||
| 1917 | 6,612,000 | 173,112 | 87,273 | 85,839 | 26.2 | 13.2 | 13.0 | 1.1 | 3.59 | 86.8 | ||
| 1918 | 6,705,000 | 167,636 | 115,440 | 52,196 | 25.0 | 17.2 | 7.8 | -0.8 | 3.47 | 103.9 | ||
| 1919 | 6,752,000 | 164,447 | 89,646 | 74,801 | 24.4 | 13.3 | 11.1 | -1.0 | 3.36 | 94.0 | ||
| 1920 | 6,820,000 | 192,987 | 81,525 | 111,462 | 28.3 | 12.0 | 16.3 | -1.5 | 3.89 | 83.3 | ||
| 1921 | 6,921,000 | 189,546 | 77,002 | 112,544 | 27.4 | 11.1 | 16.3 | -0.3 | 3.75 | 86.1 | ||
| 1922 | 7,032,000 | 181,886 | 80,381 | 101,505 | 25.9 | 11.4 | 14.4 | 2.4 | 3.54 | 77.6 | ||
| 1923 | 7,150,000 | 187,512 | 72,809 | 114,703 | 26.2 | 10.2 | 16.0 | -0.1 | 3.55 | 66.8 | ||
| 1924 | 7,264,000 | 182,430 | 71,167 | 111,263 | 25.1 | 9.8 | 15.3 | -1.3 | 3.39 | 60.6 | ||
| 1925 | 7,366,000 | 178,545 | 72,121 | 106,424 | 24.2 | 9.8 | 14.4 | 0 | 3.26 | 58.4 | ||
| 1926 | 7,472,000 | 177,498 | 73,357 | 104,141 | 23.8 | 9.8 | 13.9 | 0 | 3.18 | 61.1 | ||
| 1927 | 7,576,000 | 175,098 | 77,614 | 97,484 | 23.1 | 10.2 | 12.9 | 0.6 | 3.08 | 58.7 | ||
| 1928 | 7,678,000 | 179,028 | 73,816 | 105,212 | 23.3 | 9.6 | 13.7 | -0.3 | 3.09 | 52.3 | ||
| 1929 | 7,781,000 | 177,216 | 83,224 | 93,992 | 22.8 | 10.7 | 12.1 | 1.1 | 3.00 | 59.0 | ||
| 1930 | 7,884,000 | 182,310 | 71,682 | 110,628 | 23.1 | 9.1 | 14.0 | 0.6 | 3.03 | 50.9 | ||
| 1931 | 7,999,000 | 177,387 | 77,048 | 100,339 | 22.2 | 9.6 | 12.5 | 2.9 | 2.88 | 49.6 | ||
| 1932 | 8,122,000 | 178,525 | 73,059 | 105,466 | 22.0 | 9.0 | 13.0 | 1.2 | 2.83 | 46.3 | ||
| 1933 | 8,237,000 | 171,289 | 72,096 | 99,193 | 20.8 | 8.8 | 12.0 | 0.6 | 2.66 | 43.9 | ||
| 1934 | 8,341,000 | 172,214 | 70,164 | 102,050 | 20.6 | 8.4 | 12.2 | -1.2 | 2.63 | 42.6 | ||
| 1935 | 8,433,000 | 170,425 | 73,660 | 96,765 | 20.2 | 8.7 | 11.5 | -1.7 | 2.57 | 40.0 | ||
| 1936 | 8,516,000 | 171,675 | 73,923 | 97,752 | 20.2 | 8.7 | 11.5 | -1.9 | 2.51 | 38.9 | ||
| 1937 | 8,598,000 | 170,220 | 75,516 | 94,704 | 19.8 | 8.8 | 11.0 | -1.0 | 2.53 | 38.1 | ||
| 1938 | 8,684,000 | 178,422 | 77,043 | 101,379 | 20.5 | 8.9 | 11.7 | -0.5 | 2.63 | 36.5 | ||
| 1939 | 8,781,000 | 180,917 | 75,841 | 105,076 | 20.6 | 8.6 | 12.0 | -0.8 | 2.64 | 33.7 | ||
| 1940 | 8,879,000 | 184,846 | 87,722 | 97,124 | 20.8 | 9.9 | 10.9 | -1.2 | 2.67 | 39.1 | ||
| 1941 | 8,965,000 | 181,959 | 89,716 | 92,243 | 20.3 | 10.0 | 10.3 | -1.7 | 2.61 | 43.6 | ||
| 1942 | 9,042,000 | 189,975 | 76,040 | 113,935 | 21.0 | 8.4 | 12.6 | -6.0 | 2.71 | 39.5 | ||
| 1943 | 9,102,000 | 209,379 | 91,438 | 117,941 | 23.0 | 10.0 | 13.0 | -5.1 | 2.98 | 40.1 | ||
| 1944 | 9,174,000 | 219,946 | 108,087 | 111,859 | 24.0 | 11.8 | 12.2 | -2.6 | 3.13 | 46.3 | ||
| 1945 | 9,262,000 | 209,607 | 141,398 | 68,209 | 22.6 | 15.3 | 7.4 | 10.0 | 2.96 | 79.7 | ||
| 1946 | 9,423,000 | 284,456 | 80,151 | 204,305 | 30.2 | 8.5 | 21.7 | 0.2 | 3.97 | 38.7 | ||
| 1947 | 9,629,000 | 267,348 | 77,646 | 189,702 | 27.8 | 8.1 | 19.7 | -1.9 | 3.70 | 33.5 | ||
| 1948 | 9,800,000 | 247,923 | 72,459 | 175,464 | 25.3 | 7.4 | 17.9 | -2.0 | 3.41 | 29.3 | ||
| 1949 | 9,956,000 | 236,177 | 81,077 | 155,100 | 23.7 | 8.1 | 15.6 | -8.5 | 3.22 | 26.8 | ||
| 1950 | 10,026,773 [20] | 229,718 | 75,929 | 153,789 | 22.7 | 7.5 | 15.2 | 2.1 | 3.10 | 26.7 | 70.3 | 72.6 |
| 1951 | 10,200,280 | 228,405 | 77,560 | 150,845 | 22.3 | 7.6 | 14.7 | -2.1 | 3.05 | 26.7 | 70.2 | 72.8 |
| 1952 | 10,328,343 | 231,888 | 76,346 | 155,542 | 22.3 | 7.4 | 15.0 | -4.6 | 3.09 | 24.1 | 71.0 | 73.3 |
| 1953 | 10,435,631 | 227,964 | 80,901 | 147,063 | 21.7 | 7.7 | 14.0 | -3.0 | 3.03 | 23.7 | 70.4 | 73.0 |
| 1954 | 10,550,737 | 228,173 | 79,623 | 148,550 | 21.5 | 7.5 | 14.0 | -1.7 | 3.03 | 22.6 | 71.0 | 73.8 |
| 1955 | 10,680,023 | 229,222 | 81,708 | 147,514 | 21.3 | 7.6 | 13.7 | -0.4 | 3.03 | 21.6 | 70.9 | 71.4 |
| 1956 | 10,821,661 | 231,492 | 84,809 | 146,683 | 21.3 | 7.8 | 13.5 | -1.0 | 3.05 | 20.2 | 71.0 | 74.1 |
| 1957 | 10,957,040 | 233,892 | 82,961 | 150,931 | 21.2 | 7.5 | 13.7 | -1.0 | 3.08 | 18.4 | 71.4 | 74.6 |
| 1958 | 11,095,726 | 236,859 | 84,491 | 152,368 | 21.2 | 7.6 | 13.6 | 2.8 | 3.11 | 18.5 | 71.5 | 74.8 |
| 1959 | 11,278,024 | 242,518 | 86,072 | 156,446 | 21.4 | 7.6 | 13.8 | -1.7 | 3.17 | 18.1 | 71.2 | 75.2 |
| 1960 | 11,417,245 | 239,128 | 87,825 | 151,303 | 20.8 | 7.7 | 13.2 | -1.0 | 3.12 | 17.9 | 71.4 | 75.3 |
| 1961 | 11,556,008 | 247,407 | 88,321 | 159,086 | 21.3 | 7.6 | 13.7 | 0.6 | 3.22 | 17.0 | 71.5 | 75.7 |
| 1962 | 11,721,416 | 246,150 | 93,969 | 152,181 | 20.7 | 7.9 | 12.8 | 1.6 | 3.18 | 17.0 | 71.0 | 75.6 |
| 1963 | 11,889,962 | 249,879 | 95,734 | 154,145 | 20.8 | 8.0 | 12.8 | 0 | 3.19 | 15.8 | 71.0 | 75.8 |
| 1964 | 12,041,970 | 250,914 | 93,437 | 157,477 | 20.5 | 7.7 | 12.9 | 1.2 | 3.17 | 14.8 | 71.3 | 76.3 |
| 1965 | 12,212,269 | 245,216 | 98,026 | 147,190 | 19.8 | 7.9 | 11.9 | 1.6 | 3.04 | 14.4 | 71.1 | 76.1 |
| 1966 | 12,377,194 | 239,611 | 100,516 | 139,095 | 19.1 | 8.0 | 11.1 | 1.7 | 2.90 | 14.7 | 71.0 | 76.1 |
| 1967 | 12,535,307 | 238,678 | 99,792 | 138,886 | 18.9 | 7.9 | 11.0 | -1.0 | 2.81 | 13.4 | 71.2 | 76.6 |
| 1968 | 12,661,095 | 237,112 | 104,989 | 132,123 | 18.6 | 8.3 | 10.4 | 0.4 | 2.72 | 13.6 | 70.9 | 76.4 |
| 1969 | 12,798,346 | 247,588 | 107,615 | 139,973 | 19.1 | 8.3 | 10.8 | 1.6 | 2.75 | 13.2 | 70.9 | 76.3 |
| 1970 | 12,957,621 | 238,912 | 109,619 | 129,293 | 18.3 | 8.4 | 9.9 | 2.6 | 2.57 | 12.7 | 70.8 | 76.5 |
| 1971 | 13,119,430 | 227,180 | 110,243 | 116,937 | 17.1 | 8.3 | 8.8 | 2.6 | 2.36 | 12.1 | 71.0 | 76.8 |
| 1972 | 13,269,563 | 214,133 | 113,576 | 100,557 | 16.1 | 8.5 | 7.5 | 1.4 | 2.15 | 11.7 | 70.8 | 76.5 |
| 1973 | 13,387,623 | 194,993 | 110,682 | 84,311 | 14.5 | 8.2 | 6.3 | 1.4 | 1.90 | 11.5 | 71.3 | 77.1 |
| 1974 | 13,491,020 | 185,982 | 109,250 | 76,732 | 13.7 | 8.1 | 5.7 | 2.3 | 1.77 | 11.3 | 71.6 | 77.6 |
| 1975 | 13,599,092 | 177,876 | 113,737 | 64,139 | 13.0 | 8.3 | 4.7 | 5.2 | 1.66 | 10.6 | 71.5 | 77.7 |
| 1976 | 13,733,578 | 177,090 | 114,454 | 62,636 | 12.9 | 8.3 | 4.5 | 1.4 | 1.63 | 10.7 | 71.5 | 77.9 |
| 1977 | 13,814,495 | 173,296 | 110,093 | 63,203 | 12.5 | 7.9 | 4.6 | 1.4 | 1.58 | 9.5 | 72.1 | 78.5 |
| 1978 | 13,897,874 | 175,550 | 114,415 | 61,135 | 12.6 | 8.2 | 4.4 | 1.9 | 1.58 | 9.6 | 72.0 | 78.5 |
| 1979 | 13,985,526 | 174,979 | 112,565 | 62,414 | 12.5 | 8.0 | 4.4 | 3.1 | 1.56 | 8.7 | 72.5 | 78.9 |
| 1980 | 14,091,014 | 181,294 | 114,279 | 67,015 | 12.8 | 8.1 | 4.7 | 3.6 | 1.60 | 8.6 | 72.5 | 79.2 |
| 1981 | 14,208,586 | 178,569 | 115,515 | 63,054 | 12.5 | 8.1 | 4.4 | 1.0 | 1.56 | 8.3 | 72.7 | 79.3 |
| 1982 | 14,285,829 | 172,071 | 117,264 | 54,807 | 12.0 | 8.2 | 3.8 | 0 | 1.50 | 8.3 | 72.8 | 79.4 |
| 1983 | 14,339,551 | 170,246 | 117,761 | 52,485 | 11.9 | 8.2 | 3.7 | 0.1 | 1.47 | 8.4 | 72.9 | 79.6 |
| 1984 | 14,394,589 | 174,436 | 119,812 | 54,624 | 12.1 | 8.3 | 3.8 | 0.3 | 1.49 | 8.3 | 73.0 | 79.7 |
| 1985 | 14,453,833 | 178,136 | 122,704 | 55,432 | 12.3 | 8.5 | 3.8 | 1.4 | 1.51 | 8.0 | 73.1 | 79.7 |
| 1986 | 14,529,430 | 184,513 | 125,307 | 59,206 | 12.7 | 8.6 | 4.1 | 1.8 | 1.55 | 7.7 | 73.1 | 79.6 |
| 1987 | 14,615,125 | 186,667 | 122,199 | 64,468 | 12.7 | 8.3 | 4.4 | 2.4 | 1.56 | 7.6 | 73.5 | 80.1 |
| 1988 | 14,714,948 | 186,647 | 124,163 | 62,484 | 12.6 | 8.4 | 4.2 | 1.9 | 1.55 | 6.8 | 73.7 | 80.2 |
| 1989 | 14,805,240 | 188,979 | 128,905 | 60,086 | 12.7 | 8.7 | 4.0 | 1.9 | 1.55 | 6.8 | 73.7 | 79.9 |
| 1990 | 14,892,574 | 197,965 | 128,824 | 69,115 | 13.2 | 8.6 | 4.6 | 3.3 | 1.62 | 7.1 | 73.8 | 80.1 |
| 1991 | 15,010,445 | 198,665 | 129,958 | 68,707 | 13.2 | 8.6 | 4.6 | 3.3 | 1.61 | 6.5 | 74.1 | 80.2 |
| 1992 | 15,129,150 | 196,734 | 129,887 | 66,847 | 13.0 | 8.6 | 4.4 | 2.9 | 1.59 | 6.3 | 74.3 | 80.3 |
| 1993 | 15,239,182 | 195,748 | 137,795 | 57,953 | 12.8 | 9.0 | 3.8 | 2.9 | 1.57 | 6.3 | 74.0 | 80.0 |
| 1994 | 15,341,553 | 195,611 | 133,471 | 62,140 | 12.7 | 8.7 | 4.0 | 1.4 | 1.57 | 5.6 | 74.6 | 80.3 |
| 1995 | 15,424,122 | 190,513 | 135,675 | 54,838 | 12.3 | 8.8 | 3.5 | 1.0 | 1.531 | 5.5 | 74.6 | 80.4 |
| 1996 | 15,493,889 | 189,521 | 137,561 | 51,960 | 12.2 | 8.9 | 3.3 | 1.4 | 1.529 | 5.7 | 74.7 | 80.4 |
| 1997 | 15,567,107 | 192,443 | 135,783 | 56,660 | 12.3 | 8.7 | 3.6 | 2.0 | 1.562 | 5.0 | 75.2 | 80.6 |
| 1998 | 15,654,192 | 199,412 | 137,968 | 61,444 | 12.7 | 8.8 | 3.9 | 2.9 | 1.628 | 5.2 | 75.2 | 80.7 |
| 1999 | 15,760,225 | 200,445 | 140,487 | 59,958 | 12.7 | 8.9 | 3.8 | 2.8 | 1.652 | 5.2 | 75.3 | 80.5 |
| 2000 | 15,863,950 | 206,619 | 140,527 | 66,092 | 13.0 | 8.8 | 4.2 | 3.6 | 1.723 | 5.1 | 75.5 | 80.6 |
| 2001 | 15,987,075 | 202,603 | 140,377 | 62,226 | 12.6 | 8.7 | 3.9 | 3.5 | 1.710 | 5.4 | 75.8 | 80.7 |
| 2002 | 16,105,285 | 202,083 | 142,355 | 59,728 | 12.5 | 8.8 | 3.7 | 1.7 | 1.731 | 5.0 | 76.0 | 80.7 |
| 2003 | 16,192,572 | 200,297 | 141,936 | 58,361 | 12.3 | 8.7 | 3.6 | 0.4 | 1.747 | 4.8 | 76.2 | 80.9 |
| 2004 | 16,258,032 | 194,007 | 136,553 | 57,454 | 11.9 | 8.4 | 3.5 | -0.6 | 1.726 | 4.4 | 76.9 | 81.4 |
| 2005 | 16,305,526 | 187,910 | 136,402 | 51,508 | 11.5 | 8.4 | 3.2 | -1.4 | 1.708 | 4.9 | 77.2 | 81.6 |
| 2006 | 16,334,210 | 185,057 | 135,372 | 49,685 | 11.3 | 8.3 | 3.0 | -1.5 | 1.720 | 4.4 | 77.6 | 81.9 |
| 2007 | 16,357,992 | 181,336 | 133,022 | 48,314 | 11.1 | 8.1 | 2.9 | 0 | 1.718 | 4.1 | 78.0 | 82.3 |
| 2008 | 16,405,399 | 184,634 | 135,136 | 49,498 | 11.2 | 8.2 | 3.0 | 1.9 | 1.773 | 3.8 | 78.3 | 82.3 |
| 2009 | 16,485,787 | 184,915 | 134,235 | 50,680 | 11.2 | 8.1 | 3.1 | 2.3 | 1.790 | 3.8 | 78.5 | 82.7 |
| 2010 | 16,574,989 | 184,397 | 136,058 | 48,339 | 11.1 | 8.2 | 2.9 | 2.0 | 1.796 | 3.8 | 78.8 | 82.7 |
| 2011 | 16,655,799 | 180,060 | 135,741 | 44,319 | 10.8 | 8.1 | 2.7 | 1.8 | 1.759 | 3.6 | 79.2 | 82.8 |
| 2012 | 16,730,348 | 175,959 | 140,813 | 35,146 | 10.5 | 8.4 | 2.1 | 0.8 | 1.723 | 3.7 | 79.1 | 82.8 |
| 2013 | 16,779,575 | 171,341 | 141,245 | 30,096 | 10.2 | 8.4 | 1.8 | 1.2 | 1.679 | 3.8 | 79.4 | 83.0 |
| 2014 | 16,829,289 | 175,181 | 139,073 | 35,434 | 10.3 | 8.2 | 2.1 | 2.1 | 1.713 | 3.6 | 79.9 | 83.3 |
| 2015 | 16,900,726 | 170,510 | 147,134 | 23,376 | 10.0 | 8.7 | 1.3 | 3.3 | 1.658 | 3.3 | 79.7 | 83.1 |
| 2016 | 16,979,000 | 172,520 | 148,997 | 23,523 | 10.2 | 8.8 | 1.3 | 4.7 | 1.663 | 3.5 | 79.9 | 83.1 |
| 2017 | 17,081,507 | 169,836 | 150,214 | 19,622 | 9.9 | 8.8 | 1.1 | 4.7 | 1.619 | 3.6 | 80.1 | 83.3 |
| 2018 | 17,181,084 | 168,525 | 153,363 | 15,162 | 9.8 | 8.9 | 0.9 | 5.0 | 1.586 | 3.5 | 80.2 | 83.3 |
| 2019 | 17,282,163 | 169,680 | 151,885 | 17,795 | 9.8 | 8.8 | 1.0 | 6.3 | 1.574 | 3.6 | 80.5 | 83.6 |
| 2020 | 17,407,585 | 168,681 | 168,678 | 3 | 9.7 | 9.7 | 0.0 | 3.9 | 1.545 | 3.8 | 79.7 | 83.1 |
| 2021 | 17,475,415 | 179,441 | 170,972 | 8,469 | 10.2 | 9.8 | 0.4 | 6.2 | 1.624 | 3.3 | 79.7 | 83.0 |
| 2022 | 17,590,672 | 167,504 | 170,112 | -2,608 | 9.5 | 9.6 | -0.1 | 12.7 | 1.487 | 3.2 | 80.1 | 83.1 |
| 2023 | 17,811,291 | 163,818 | 169,320 | -5,502 | 9.3 | 9.5 | -0.2 | 8.2 | 1.43 | |||
| 2024 | 17,954,000 |
Current vital statistics
Source: Centraal Bureau voor de Statistiek[21]
| Period | Live births | Deaths | Natural increase |
|---|---|---|---|
| January-March 2023 | 39,003 | 46,664 | -7,661 |
| January-March 2024 | 40,002 | 47,220 | -7,218 |
| Difference |
Structure of the population
| Age Group | Male | Female | Total | % |
|---|---|---|---|---|
| Total | 8 243 482 | 8 412 317 | 16 655 799 | 100 |
| 0–4 | 472 308 | 450 798 | 923 106 | 5.54 |
| 5–9 | 503 882 | 481 347 | 985 229 | 5.92 |
| 10–14 | 510 974 | 487 766 | 998 740 | 6.00 |
| 15–19 | 514 830 | 491 914 | 1 006 744 | 6.04 |
| 20–24 | 522 667 | 512 062 | 1 034 729 | 6.21 |
| 25–29 | 504 117 | 497 421 | 1 001 538 | 6.01 |
| 30–34 | 503 323 | 501 441 | 1 004 764 | 6.03 |
| 35–39 | 560 289 | 561 279 | 1 121 568 | 6.73 |
| 40–44 | 653 664 | 642 261 | 1 295 925 | 7.78 |
| 45–49 | 655 302 | 642 990 | 1 298 292 | 7.79 |
| 50–54 | 601 040 | 595 279 | 1 196 319 | 7.18 |
| 55–59 | 546 952 | 543 295 | 1 090 247 | 6.55 |
| 60–64 | 553 446 | 550 206 | 1 103 652 | 6.63 |
| 65-69 | 390 725 | 399 835 | 790 560 | 4.75 |
| 70-74 | 302 542 | 334 976 | 637 518 | 3.83 |
| 75-79 | 219 108 | 280 213 | 499 321 | 3.00 |
| 80-84 | 139 348 | 221 480 | 360 828 | 2.17 |
| 85-89 | 66 949 | 145 107 | 212 056 | 1.27 |
| 90-94 | 18 812 | 57 379 | 76 191 | 0.46 |
| 95+ | 3 204 | 15 268 | 18 472 | 0.11 |
| Age group | Male | Female | Total | Percent |
| 0–14 | 1 487 164 | 1 419 911 | 2 907 075 | 17.45 |
| 15–64 | 5 615 630 | 5 538 148 | 11 153 778 | 66.97 |
| 65+ | 1 140 688 | 1 454 258 | 2 594 946 | 15.58 |
| Age Group | Male | Female | Total | % |
|---|---|---|---|---|
| Total | 8 686 536 | 8 788 879 | 17 475 415 | 100 |
| 0–4 | 439 516 | 418 110 | 857 626 | 4.91 |
| 5–9 | 461 357 | 438 470 | 899 827 | 5.15 |
| 10–14 | 488 746 | 465 532 | 954 278 | 5.46 |
| 15–19 | 527 596 | 504 139 | 1 031 735 | 5.90 |
| 20–24 | 563 311 | 544 175 | 1 107 486 | 6.34 |
| 25–29 | 575 570 | 557 372 | 1 132 942 | 6.48 |
| 30–34 | 570 427 | 556 062 | 1 126 489 | 6.45 |
| 35–39 | 530 309 | 523 777 | 1 054 086 | 6.03 |
| 40–44 | 516 034 | 517 454 | 1 033 488 | 5.91 |
| 45–49 | 562 979 | 569 595 | 1 132 574 | 6.48 |
| 50–54 | 644 880 | 641 251 | 1 286 131 | 7.36 |
| 55–59 | 633 972 | 629 585 | 1 263 557 | 7.23 |
| 60–64 | 566 770 | 570 891 | 1 137 661 | 6.51 |
| 65-69 | 496 148 | 507 630 | 1 003 778 | 5.74 |
| 70-74 | 474 058 | 496 978 | 971 036 | 5.56 |
| 75-79 | 303 655 | 340 405 | 644 060 | 3.69 |
| 80-84 | 196 115 | 253 008 | 449 123 | 2.57 |
| 85-89 | 97 307 | 160 502 | 257 809 | 1.48 |
| 90-94 | 31 861 | 73 187 | 105 048 | 0.60 |
| 95-99 | 5 514 | 18 631 | 24 145 | 0.14 |
| 100-104 | 406 | 2 040 | 2 446 | 0.01 |
| 105-109 | 5 | 84 | 89 | <0.01 |
| 110+ | 0 | 1 | 1 | <0.01 |
| Age group | Male | Female | Total | Percent |
| 0–14 | 1 389 619 | 1 322 112 | 2 711 731 | 15.52 |
| 15–64 | 5 691 848 | 5 614 301 | 11 306 149 | 64.70 |
| 65+ | 1 605 069 | 1 852 466 | 3 457 535 | 19.79 |
Migration and origin groups
Between 1590 and 1800 the estimated share of foreign-born population was consistently above 5%.[23]
According to Eurostat, in 2010 there were 1,800,000 foreign-born residents in the Netherlands, corresponding to 11.1% of the total population. Of these, 1,400,000 (8.5%) were born outside the EU (including those from Dutch colonies) and 428,000 (2.6%) were born in another EU member state. The most common countries of birth being: Belgium, Germany, Poland and the United Kingdom.[24] On 1 January 2016, 26,2% of persons aged 0–50 had at least one parent born in a foreign country. 11,4% of persons aged 0–50 of 'Dutch background' belonged to the 'third generation', the majority descending from Western immigrants. The third generation constitutes persons born from two second generation immigrants or one second generation immigrant and one person with a Dutch background. First and second generation immigrants and the third generation were 34,5% of the population aged 0–50.[25]
As the result of immigration from overseas, the Netherlands have a sizeable minority of non-indigenous peoples. There is also a considerable level of emigration, in majority consisting of former immigrants. In 2005, some 121,000 people left the country, while 94,000 entered it. Out of a total of 101,150 people immigrating into the Netherlands in 2006, 66,658 were from Europe, Oceania, the Americas or Japan, and 34,492 were from other (mostly developing) countries. Out of a total of 132,470 emigrants, 94,834 were going to Europe, Oceania, the Americas or Japan and 37,636 to other countries.[26]
A large number[23] of immigrants come from countries in Western Europe, mostly from the neighbouring countries of Germany and Belgium. There were five subsequent waves of immigration to the Netherlands in recent history.
- In the late-1940s and into the 1950s, following the end of the Second World War, people from the newly independent Republic of Indonesia repatriated or emigrated to the Netherlands - mainly Indo-European (people of mixed European and Indonesian ancestry of Dutch nationality) and supporters of the Republic of South Maluku.
- Between 1960 and 1974, migrants from Greece, Portugal, Spain, Turkey and Morocco came to work in the Netherlands as guest workers. They were expected to return to their own country and many did, but others remained and in the 1970s and 1980s were joined by their families. Until 2004, when marriage immigration was restricted, their children usually married others from their home country.[citation needed]
- After 1974, people emigrated from the newly independent Suriname and from the Netherlands Antilles, which remained part of the Kingdom of the Netherlands. In 1974, about forty thousand Surinamese migrated while still retaining Dutch citizenship; between 1975 and 1980 there was a transitional arrangement allowing migration. Antilleans have the Dutch nationality and behave like typical labour migrants, travelling to and from the country in response to the employment available.
- During the 1970s and 1980s, the number of asylum seekers was low, consisting e.g. of Chileans fleeing from political oppression and/or persecution. In the 1990s, asylum migration sharply increased,[27] largely consisting of Yugoslavs, Somalis, Iraqis, Iranians, Ethiopians, Eritreans, Afghans and Vietnamese, fleeing war or famine.[28] Between 2000 and 2014 asylum migration strongly decreased due to the strict "Cohen Law". However, the Syrian Civil War from 2011 resulted in a large influx of Syrian asylum seekers in 2015 and 2016; about ninety thousand Syrians had been granted asylum by 2018.
- Since the 2000s, migrant workers and their families from the newly joined EU member states in Central and Eastern Europe, including: Poland, Romania and Bulgaria, and non-EU states Moldova, Ukraine and the former Yugoslavia.[citation needed] In addition, a number of Spaniards, Greeks, Italians, and Portuguese also migrated due to the impact of the Great Recession in those countries. In 2005, non-Western ethnic population comprised 1.7 million individuals, about 10% of the population in the country.[29]
Illegal immigration to the Netherlands results in automatic deportation[30] but this is often not enforced for various reasons such as unknown country of origin, etc. Many Dutch provinces in 2012 had quotas for deporting illegal immigrants.[31][32][33][34]
By 2017, persons with an immigration background, both western and non-western, formed a majority in Amsterdam (2011), Rotterdam (2013) and The Hague, the three largest cities of the Netherlands.[35]
In 2005, the governmental Sociaal en Cultureel Planbureau in its annual report, noted recurring integration problems for ethnic minorities. While during the economic boom of the 1990s their unemployment and dependence on welfare had strongly decreased, the economic downturn between 2001 and 2004 disproportionally affected immigrant groups. This would be explained by their functioning as a labour reserve, by their lower educational levels and by lower language skills. The report also noted that per capita social interactions between native Dutch and immigrant populations tended to decline over time, partly explainable by the size growth of immigrant groups. Integration levels strongly varied between groups. Surinamese and Antilleans were well economically integrated, but the latter less so culturally. Cultural integration was limited for Turks, but better for Moroccans. Of the asylum seekers, Somalis were among the least integrated into Dutch society, while Iranians were the best integrated with the highest education levels and modern lifestyles. Though the educational levels of the second generation were a significant improvement over those of the first generation, they still lagged behind the native Dutch who themselves on average had been attending ever higher school types. While half of all native Dutch pupils in 2005 proceeded to higher secondary education (HAVO and VWO), for Turks and Moroccans the share was a fifth and for Somali pupils even lower.[29]
In 2007, non-Western groups were generally socio-economically disadvantaged and of the four largest non-Western groups, Turks and Moroccans were the most disadvantaged. In 2006 38.7% of Moroccans and 43.9% of Turks aged 15–64 were in employment, their unemployment rate was about four times the level of the native Dutch (17.2% for Moroccans and 15.1% for Turks), and 30% received some type of social welfare.[23]
After 2008, the financial crisis and the eurocrisis again hit immigrant groups particularly hard. In 2012, at 12% non-Western migrants were six times more likely than native Dutch to receive social welfare benefits, with 2% for the Dutch.[36]

According to a 2010 Statistics Netherlands report, the third generation of non-Western immigrants was predominantly young with 80% being younger than 15, while growing with 10% each year. The third generation have a similar employment rate as the native Dutch and receive a similar amount of social benefits. The third non-Western generation follow adult education more frequently than both the native Dutch and non-Western immigrants. The non-Western immigrant population as a whole has 1.5 to 2 times the benefit dependence compared to the natives. The non-Western third generation had a rate slightly higher than the native Dutch as crime suspects, but lower than for non-Western immigrants as a whole.[38][39]
According to Statistics Netherlands, nearly 53% of refugee households have a low income, six times the Netherlands average (8.2%).[37] For Syrian and Eritrean households the share is about 80%. At 33% the poverty risk is lowest among Iranian refugee households. The group of Syrian households at risk of poverty grew from ten thousand (76% of all Syrian households in 2016) to eighteen thousand (79% of all Syrian households) in 2018. Households of Polish, Romanian or Bulgarian origin have a greater than average risk of poverty even though households from these Eastern European countries generally depend on work for their income. Migrant workers from Eastern Europe generally perform low-skilled work while migrants from Western Europe are often highly educated.[37]
Immigrants from foreign countries are divided into several ethnic groups. For example, there are both Russians and Chechens from Russia, Turks and Kurds from Turkey, Serbs and Albanians from Serbia and immigrants from Iran are divided into Persians, Azeris and Kurds.[40]
National origins

Pie chart showing the breakdown of the Netherlands by national origin (2022)
As of 1 January 2022[update], 4 438 900 citizens are of non-Dutch/Frisian origin. A majority of these (50,86%) are from seven backgrounds alone: Turks (inc. Kurds), Moroccans (inc. Berbers), Surinamese, Indonesians (inc. Moluccans), Germans, Poles and Curaçao.[41]
With the huge expansion of the European Union during the 2000s, the Netherlands has seen a rise in the number of immigrants coming from new member states. Migrant workers from these countries are estimated to be about 100,000 as of 2007.[42] Legal migrants from new EU-member states doubled between 2007–11 to 200,000,[43] with estimates totaling up to 300,000. Of the Poles who initially moved to the Netherlands in 2004, about a quarter had returned to Poland by 2006.[44] In addition, a large number of Syrians moved to the Netherlands in the 2010s mostly as refugees, with the population increasing seven-fold between 2014 and 2019. Both Poles and Syrians have overtaken the population of Antilleans during the decade.[41] More than 36,000 Roma live in the Netherlands.[45] Dutch Roma, Sinti and Dutch Jews were decimated by the Holocaust.[46][47] However, the Jewish population has seen growth in the Netherlands in recent years.[48]
As of 1 January 2022[update]:[41]
| National origins/Migration background | 2022 | 2021 | 2020 | 2019 | 2018 | 2017 | 2016 | 2015 | 2014 | 2013 | 2012 | 2010 |
|---|---|---|---|---|---|---|---|---|---|---|---|---|
| Dutch (& Frisians) | 13 151 772(74.77%) | 13 169 507(75.36%) | 13 186 880 (75.75%) | 13 196 025 (76.36%) | 13 209 225 (76.88%) | 13 218 754 (77.39%) | 13 226 829 (77.90%) | 13 235 405 (78.31%) | 13 234 545 (78.64%) | 13 236 494 (78.89%) | 13 236 618 (79.12%) | 13 215 458 (79.73%) |
| Turks (& Kurds) | 429 978 (2.444%) | 422 030 (2.415%) | 416 864 (2.395%) | 409 877 (2.37%) | 404 459 (2.35%) | 400 367 (2.34%) | 397 471 (2.34%) | 396 555 (2.35%) | 396 414 (2.36%) | 392 923 (2.34%) | 392 923 (2.35%) | 384 164 (2.32%) |
| Moroccans (& Berbers) | 419 272 (2.38%) | 414 186 (2.37%) | 408 864 (2.35%) | 402 492 (2.33%) | 396 539 (2.31%) | 391 088 (2.29%) | 385 761 (2.27%) | 380 755 (2.25%) | 374 996 (2.23%) | 368 838 (2.20%) | 362 954 (2.17%) | 349 270 (2.11%) |
| Surinamese | 359 814 (2.05%) | 358 266 (2.05%) | 356 402 (2.05%) | 353 909 (2.05%) | 351 681 (2.05%) | 349 978 (2.05%) | 349 022 (2.06%) | 348 662 (2.06%) | 348 291 (2.07%) | 344 734 (2.05%) | 344 734 (2.06%) | 342 016 (2.06%) |
| Indos (& Moluccans) | 349 301 (1.986%) | 352 266 (2.016%) | 356 029 (2.045%) | 358 773 (2.08%) | 361 594 (2.10%) | 364 328 (2.13%) | 366 849 (2.16%) | 369 661 (2.19%) | 372 233 (2.21%) | 374 847 (2.23%) | 377 618 (2.26%) | 382 319 (2.31%) |
| Germans | 342 925 (1.95%) | 345 746 (1.98%) | 349 284 (2.006%) | 351 552 (2.03%) | 354 136 (2.06%) | 356 875 (2.09%) | 360 116 (2.12%) | 364 125 (2.15%) | 368 512 (2.19%) | ? | ? | 379 017 (2.29%) |
| Poles | 220 980 (1.26%) | 209 278 (1.2%) | 198 024 (1.14%) | 185 497 (1.07%) | 173 050 (1.01%) | 161 158 (0.94%) | 149 831 (0.88%) | 137 794 (0.82%) | 123 003 (0.73%) | 111 121 (0.66%) | 100 775 (0.60%) | 77 178 (0.47%) |
| Antilleans | 165 477 (0.94%) | 160 429 (0.92%) | 158 487 (0.91%) | 155 492 (0.90%) | 153 469 (0.90%) | 150 981 (0.89%) | 148 926 (0.88%) | 146 855 (0.87%) | 145 499 (0.87%) | 143 992 (0.86%) | 138 113 (0.83%) | 134 486 (0.82%) |
| Syrians | 126 260 (0.72%) | 113 126 (0.65%) | 105 440 (0.61%) | 98 090 (0.57%) | 90 771 (0.53%) | 72 903 (0.43%) | 43 838 (0.26%) | 22 568 (0.13%) | 13 744 (0.08%) | 11 665 (0.07%) | 11 025 (0.07%) | 10 263 (0.06%) |
| Belgians | 123 136 (0.7%) | 122 197 (0.7%) | 121 019 (0.695%) | 119 769 (0.69%) | 118 725 (0.69%) | 117 495 (0.69%) | 116 389 (0.69%) | 115 687 (0.68%) | ? | ? | ? | ? |
| Former Soviets[a] | ? | 110 877 | 92 128 (0.53%) | 84 498 (0.49%) | 80 013 (0.47%) | 76 102 (0.45%) | ? | ? | ? | ? | ||
| British | 97 844 (0.56%) | 97 614(0.56%) | 91 154 (0.53%) | 88 390 (0.51%) | 86 293 (0.51%) | 84 466 (0.50%) | 82 879 (0.49%) | ? | ? | ? | ? | |
| Former Yugoslavs[b] | ? | 91 951 | 87 536 (0.51%) | 85 504 (0.50%) | 84 243 (0.50%) | 83 261 (0.49%) | ? | ? | ? | ? | ||
| Chinese | 84 453 (0.48%) | 81 735 (0.47%) | 77 648 (0.45%) | 74 234 (0.43%) | 71 229 (0.42%) | 68 697 (0.40%) | 66 088 (0.39%) | ? | ? | ? | ? | |
| Iraqis | 67 757(0.39%) | 66 216 (0.38%) | 63 008 (0.36%) | 61 255 (0.36%) | 59 497 (0.35%) | 56 269 (0.33%) | ? | ? | ? | ? | ? | |
| Indians | 65 399 (0.37%) | 58 460 (0.33%) | 48 724 (0.28%) | 36 818 (0.22%) | 32 682 (0.19%) | ? | ? | ? | ? | ? | ||
| Italians | 64 398 (0.37%) | 61 367 (0.35%) | 56 645 (0.33%) | 53 703 (0.31%) | 50 925 (0.30%) | 48 366 (0.28%) | ? | ? | ? | ? | ? | |
| Afghans | 54 991 (0.31%) | 51 830 (0.3%) | 49 122 (0.28%) | 47 776 (0.28%) | 46 701 (0.27%) | 44 339 (0.26%) | ? | ? | ? | ? | ? | |
| Spaniards | 54 269 (0.31%) | 50 466 (0.29%) | 46 741 (0.27%) | 42 926 (0.25%) | 41 572 (0.24%) | ? | ? | ? | ? | ? | ||
| French | 52 389 (0.3%) | 50 207 (0.29%) | 47 009 (0.27%) | 45 558 (0.27%) | 43 836 (0.26%) | 42 070 (0.25%) | ? | ? | ? | ? | ? | |
| Iranians (Persians, Azeris and Kurds) | 52 099 (0.3%) | 49 723 (0.29%) | 44 379 (0.26%) | 42 464 (0.25%) | 40 893 (0.24%) | 38 458 (0.23%) | ? | ? | ? | ? | ? | |
| Bulgarians | 50 305 (0.29%) | 44 874 (0.26%) | 40 216 (0.23%) | 34 809 (0.20%) | 27 729 (0.16%) | 25 520 (0.15%) | ? | ? | ? | ? | ? | |
| Americans | 49 246 (0.28%) | 47 408(0.27%) | 44 399 (0.26%) | 40 022 (0.23%) | 38 494 (0.23%) | ? | ? | ? | ? | ? | ||
| Romanians | 48 563(0.28%) | 43 161(0.25%) | 39 340 (0.225%) | 34 185 (0.20%) | 25 551 (0.15%) | 23 020 (0.14%) | ? | ? | ? | ? | ? | |
| Somalis | 41 064(0.23%) | 40 701 (0.23%) | 40 251 (0.23%) | 39 947 (0.23%) | 39 737 (0.23%) | 39 457 (0.23%) | 39 465 (0.23%) | ? | ? | ? | ? | ? |
| Bosnians | 39 265 (0.22%) | 38 927 (0.22%) | ? | ? | ? | ? | ? | ? | ? | ? | ? | ? |
| Brazilians | 38 125 (0.22%) | 35 285 (0.2%) | 33 348 (0.19%) | 30 104 (0.17%) | 24 725 (0.14%) | 23 675 (0.14%) | ? | ? | ? | ? | ? | |
| South Africans ( Afrikaners) | 31 693 (0.18%) | 28 562 (0.16%) | 23 738 (0.14%) | 20 859 (0.12%) | 19 877 (0.12%) | ? | ? | ? | ? | ? | ||
| Greeks | 31 480 (0.18%) | 28 856 (0.16%) | 28 100 (0.16%) | 25 709 (0.15%) | 22 141 (0.13%) | 20 769 (0.12%) | ? | ? | ? | ? | ? | |
| Portuguese | 31 306 (0.18%) | 29 092(0.17%) | 28 802 (0.17%) | 27 450 (0.16%) | 25 637 (0.15%) | 24 930 (0.15%) | ? | ? | ? | ? | ? | |
| Egyptians | 29 483 (0.17%) | 28 399 (0.16%) | 26 152 (0.15%) | 23 956 (0.14%) | 23 198 (0.14%) | ? | ? | ? | ? | ? | ||
| Ethiopians | 28 635 (0.16%) | 27 139(0.15%) | 23 777 (0.14%) | 19 528 (0.11%) | 16 347 (0.10%) | ? | ? | ? | ? | ? | ||
| Hungarians | 28 210 (0.16%) | 26 853 (0.15%) | 24 898 (0.14%) | 22 870 (0.13%) | 22 080 (0.13%) | ? | ? | ? | ? | ? | ||
| Pakistanis | 27 261 (0.15%) | 25 938 (0.15%) | 23 855 (0.14%) | 22 897 (0.13%) | 22 137 (0.13%) | 21 447 (0.13%) | ? | ? | ? | ? | ? | |
| Ghanaians | 26 694 (0.15%) | 25 999 (0.15%) | 24 460 (0.14%) | 23 430 (0.14%) | 23 168 (0.14%) | ? | ? | ? | ? | ? | ||
| Filipinos | 26 658 (0.15%) | 25 365 (0.14%) | 23 128 (0.13%) | 22 000 (0.13%) | 20 937 (0.12%) | 20 073 (0.12%) | ? | ? | ? | ? | ? | |
| Vietnamese (Kinh) | 25 135 (0.14%) | 24 594 (0.14%) | 23 488 (0.14%) | 22 023 (0.13%) | 21 435 (0.13%) | ? | ? | ? | ? | ? | ||
| Thai | 23 390 (0.13%) | 22 642 (0.13%) | 21 364 (0.12%) | 20 106 (0.12%) | 19 513 (0.11%) | ? | ? | ? | ? | ? | ||
| Cape Verdeans | 23 150 (0.13%) | 22 980 (0.13%) | 22 632 (0.13%) | 22 285 (0.13%) | 22 157 (0.13%) | ? | ? | ? | ? | ? | ||
| Colombians | 21 853 (0.12%) | 20 515 (0.12%) | 18 351 (0.11%) | 16 607 (0.10%) | 15 892 (0.09%) | ? | ? | ? | ? | ? | ||
| Hong Kongers | 18 363 (0.1%) | 18 332 (0.10%) | 18 367 (0.11%) | 18 357 (0.11%) | 18 300 (0.11%) | ? | ? | ? | ? | ? | ||
| Australians | 17 722 (0.10%) | 17 688 (0.10%) | 17 349 (0.10%) | 16 597 (0.10%) | 16 127 (0.09%) | ? | ? | ? | ? | ? | ||
| Canadians | 17 266(0.1%) | 16 997 (0.10%) | 16 614 (0.10%) | 16 240 (0.09%) | 15 944 (0.09%) | 15 625 (0.09%) | ? | ? | ? | ? | ? | |
| Austrians | 16 216 (0.09%) | 16 130 (0.09%) | 16 055 (0.09%) | 15 777 (0.09%) | 15 674 (0.09%) | ? | ? | ? | ? | ? | ||
| Rest of Sub-Saharan Africa | ? | 108 621 (0.63%) | 97 026 (0.57%) | 91 797 (0.54%) | ? | ? | ? | ? | ? | |||
| Rest of Europe | ? | 77 245 (0.45%) | 68 592 (0.40%) | 65 849 (0.39%) | ? | ? | ? | ? | ? | |||
| Rest of Americas (except Caribbean) | ? | 52 425 (0.30) | 47 048 (0.28%) | 45 256 (0.27%) | ? | ? | ? | ? | ? | |||
| Rest of North Africa and Middle East | ? | 55 180 (0.32%) | 46 231 (0.27%) | 44 059 (0.26%) | ? | ? | ? | ? | ? | |||
| Rest of East and Southeast Asia | ? | 38 279 (0.22%) | 34 562 (0.20%) | 33 473 (0.20%) | ? | ? | ? | ? | ? | |||
| Rest of Caribbean | ? | 28 861 (0.17%) | 21 514 (0.13%) | 20 956 (0.12%) | ? | ? | ? | ? | ? | |||
| Rest of South Asia | ? | 18 672 (0.11%) | 17 448 (0.10%) | 16 762 (0.10%) | ? | ? | ? | ? | ? | |||
| Rest of Oceania | ? | 6 479 (0.04%) | 6 062 (0.04%) | 5 916 (0.03%) | ? | ? | ? | ? | ? | |||
| Others | ? | 1 094 826 (6.48%) | 1 587 433 (9.43%) | 1 437 462 (8.57%) | 1 437 462 (8.59%) | 1 387 255 (8.37%) | ||||||
| Total | 17 590 672 | 17 475 415 | 17 407 575 | 17 282 163 | 17 181 084 | 17 081 507 | 16 979 120 | 16 900 726 | 16 829 289 | 16 779 575 | 16 730 348 | 16 577 612 |
- Population pyramids of background groups
 Dutch background population pyramid in 2022
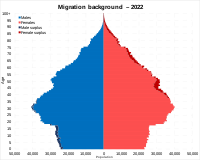 Migration background: Total
 1st generation migrant background
 2nd generation (both parents born abroad) migrant background
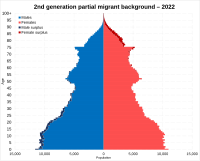 2nd generation partial (one parent born abroad) migrant background
 Europe (total foreign/non-Dutch) migrant background
 Americas (total foreign/non-Dutch) migrant background
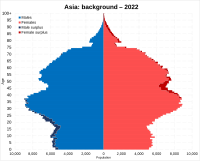 Asia (total foreign/non-Dutch) migrant background
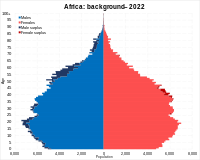 Africa (total foreign/non-Dutch) migrant background


| Region of the World[49] | 2023[50] | 2022[49] | 2021 | 2019 | 2018 | 2017 | 2016 |
|---|---|---|---|---|---|---|---|
| Netherlands | 12 978 154 (72.86%) | 13 013 279 (73.97%) | 13 169 507 (75.36%) | 13 196 025 (76.36%) | 13 209 225 (76.88%) | 13 218 754 (77.39%) | 13 226 829 (77.90%) |
| Europe (Except Netherlands) | 1 617 454 (9.08%) | 1 477 069 (8.39%) | 1 237 807 (7.25%) | 1 204 908 (7.10%) | |||
| Asia | 1 594 551 (8.95%) | 1 523 493 (8.66%) | |||||
| Americas | 804 097 (4.51%) | 815,554 (4.63%) | |||||
| Africa | 785 016 (4.41%) | 761,277 (4.32%) | |||||
| North Africa and Middle East | 1 148 300 (6.64%) | 1 081 636 (6.33%) | 1 033 393 (6.09%) | ||||
| East and South East Asia | 561 047 (3.25%) | 551 542 (3.23%) | 548 340 (3.23%) | ||||
| Caribbean and Suriname | 538 262 (3.11%) | 524 961 (3.07%) | 520 959 (3.07%) | ||||
| Sub-Saharan Africa | 243 175 (1.41%) | 222 585 (1.30%) | 212 811 (1.25%) | ||||
| Americas (Except Caribbean and Suriname) | 161 893 (0.94%) | 144 346 (0.85%) | 138 942 (0.82%) | ||||
| South Asia | 91 251 (0.53%) | 76 403 (0.45%) | 70 891 (0.42%) | ||||
| Oceania | 32 019 (0.18%) | 24 423 (0.14%) | 24 390 (0.14%) | 22 828 (0.14%) | 22 659 (0.13%) | 22 043 (0.13%) |
| Nationality | Population (2022)[51] |
|---|---|
 Turkey Turkey | 429,978 |
 Morocco Morocco | 419,272 |
 Suriname Suriname | 359,814 |
 Indonesia Indonesia | 349,301 |
  Germany Germany | 342,925 |
 Poland Poland | 220,980 |
 Syria Syria | 126,260 |
 Belgium Belgium | 123,136 |
 United Kingdom United Kingdom | 97,844 |
 China China | 84,453 |
 Iraq Iraq | 67,757 |
 India India | 65,399 |
 Italy Italy | 55,001 |
 Afghanistan Afghanistan | 54,991 |
 Spain Spain | 54,269 |
 France France | 52,389 |
 Iran Iran | 52,099 |
 Bulgaria Bulgaria | 50,305 |
 United States United States | 49,246 |
 Romania Romania | 48,563 |
 Somalia Somalia | 41,064 |
 Bosnia and Herzegovina Bosnia and Herzegovina | 39,265 |
 Brazil Brazil | 38,125 |
 South Africa South Africa | 31,693 |
 Greece Greece | 31,480 |
 Portugal Portugal | 31,306 |
 Egypt Egypt | 29,483 |
 Ethiopia Ethiopia | 28,635 |
 Hungary Hungary | 28,210 |
 Pakistan Pakistan | 27,261 |
 Ghana Ghana | 26,694 |
 Philippines Philippines | 26,658 |
 Cape Verde Cape Verde | 23,150 |
 Thailand Thailand | 23,390 |
 Colombia Colombia | 21,853 |
 Hong Kong Hong Kong | 18,363 |
 Australia Australia | 17,722 |
 Canada Canada | 17,266 |
 Austria Austria | 16,216 |
| Rank | Country | Number | Percentage |
|---|---|---|---|
| 1 |  Ukraine Ukraine | 82,767 | 37 |
| 2 | Syria | 16,276 | 7.2 |
| 3 | Turkey | 12,040 | 5.4 |
| 4 | India | 10,903 | 4.9 |
| 5 | Poland | 10,025 | 4.5 |
| 6 | Romania | 6,043 | 2.7 |
| 7 | Bulgaria | 5,527 | 2.5 |
| 8 | South Africa | 4,616 | 2 |
| 9 | Afghanistan | 3,278 | 1.7 |
| 10 | Greece | 3,270 | 1.7 |
| Top 10 total | 154,745 | 69.1 | |
| Other | 69,053 | 30.9 | |
| Total | 223,798 | 100 |
Emigration
The Netherlands has seen considerable emigration. In the 1950s, 560,000[citation needed] people migrated to the United States, South Africa, Australia, Canada and New Zealand, leaving their war-torn and overpopulated home country behind. At least 60,000 of these migrants were Indo-European (mixed Dutch-Indonesian) repatriates that moved on, mostly to the United States, after being repatriated to the Netherlands from the former Dutch East Indies during and after the Indonesian Revolution.
In 2005, some 121,000 people migrated from the Netherlands. There is considerable migration towards neighbouring states, Belgium, Germany and the United Kingdom and to the Netherlands Antilles. Furthermore, almost half of the current emigration consists of people returning to their country of birth, including rejected asylum seekers, after the more stringent migration laws were implemented.
Education by background
According to a 2016 study by Statistics Netherlands, students with a non-western background generally study at a lower level of secondary education. 48 percent of those with a Dutch background were at HAVO or VWO level at third year, compared to 23 percent for Dutch Turks, 28 percent for Dutch Moroccans, 35 percent for Dutch Surinamese and 31 percent for Dutch Antilleans. Some backgrounds fared better: over 40 percent of Dutch Afghans studied at HAVO/VWO level, and for Dutch Iranians the rate was 50 percent, which was above native Dutch students.[53]
Employment and income
Unemployment, youth ages 15–24
- total: 7.2%. Country comparison to the world: 130th
- male: 7.7%
- female: 6.6% (2018 est.)
Religion
In 2013, Statistics Netherlands found that 26% of the population identified as Roman Catholic, 16% as Protestant, 5% as Muslim, and 6% as "other" (the last includes other Christian denominations, Hindus 0.6%, Jews 0.1%, and Buddhists 0.4%). The agency interviewed 355,237 people in the period 2010–2013.[54] In 2019, the Central Bureau of Statistics reported that for the first time non-religious people were in the majority in the Netherlands. Only 49% of people older than 15 years reported to be religious; in 2012 that was still 54%. The largest religion was still Catholicism (24%), while 5% identified with Islam.[55]
Religion in Netherlands (2018) by Statista[56]
Language
The main language is Dutch, while Frisian (known as West Frisian outside of the Netherlands) is also a recognized language in the province of Friesland and is used by the government and schools there. Several dialects of Low Saxon (Nedersaksisch in Dutch) are spoken in much of the north and east and are recognized by the Netherlands as regional languages according to the European Charter for Regional or Minority Languages. Another group of dialects granted the status of regional language is Limburgish, which is spoken in the south-eastern province of Limburg. Major immigrant languages are Indonesian, Turkish, Arabic, Berber, Papiamento, German and Polish.
See also
Notes
References
External links
- CIA World Factbook data
- CBS Dutch Bureau of Statistics