Hertfordshire County Council in England is elected every four years. Since the last boundary changes took effect in 2017 there have been 78 electoral divisions electing one councillor each.[1]
Elections
Summary of the council composition, click on the year for full details of each election.
| Year | Conservative | Labour | Liberal Democrats | Green | BNP | Independent | Council control after election | Notes | |
|---|---|---|---|---|---|---|---|---|---|
| 1973[2] | 35 | 33 | 3 | 0 | 0 | 1 | No overall control | ||
| 1977[2] | 65 | 6 | 0 | 0 | 0 | 1 | Conservative | ||
| 1981[2] | 43 | 29 | 4 | 0 | 0 | 1 | Conservative | New ward boundaries[3] | |
| 1985[2] | 36 | 27 | 14 | 0 | 0 | 0 | No overall control | ||
| 1989[2] | 45 | 27 | 5 | 0 | 0 | 0 | Conservative | ||
| 1993[2] | 27 | 30 | 19 | 0 | 0 | 1 | No overall control | ||
| 1997[2] | 38 | 30 | 9 | 0 | 0 | 0 | No overall control | ||
| 2001[4] | 40 | 27 | 10 | 0 | 0 | 0 | Conservative | New ward boundaries[5] | |
| 2005[6] | 46 | 16 | 14 | 1 | 0 | 0 | Conservative | ||
| 2009[7] | 55 | 3 | 17 | 1 | 1 | 0 | Conservative | ||
| 2013[8] | 46 | 15 | 16 | 0 | 0 | 0 | Conservative | ||
| 2017[9] | 51 | 9 | 18 | 0 | 0 | 0 | Conservative | New ward boundaries[1] | |
| 2021[10] | 46 | 7 | 23 | 1 | 0 | 1 | Conservative | ||
Result maps
 2001 results map
 2005 results map
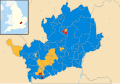 2009 results map
 2013 results map
 2017 results map
 2021 results map


By-election results
By-elections are held for any vacancies that arise between elections.
1993–1997
| Party | Candidate | Votes | % | ±% | |
|---|---|---|---|---|---|
| Conservative | Gerald Game | 1,067 | 62.0 | ||
| Labour | Sylvia Courtnage | 424 | 24.6 | ||
| Liberal Democrats | Henry Appiah | 231 | 13.4 | ||
| Majority | 643 | 37.4 | |||
| Turnout | 1,722 | 14.83 | |||
| Conservative hold | Swing | ||||
| Party | Candidate | Votes | % | ±% | |
|---|---|---|---|---|---|
| Conservative | 1,406 | 50.9 | |||
| Labour | 1,083 | 39.2 | |||
| Liberal Democrats | 273 | 9.9 | |||
| Majority | 323 | ||||
| Turnout | 2,762 | ||||
| Conservative hold | Swing | ||||
1997–2001
| Party | Candidate | Votes | % | ±% | |
|---|---|---|---|---|---|
| Conservative | 1,842 | 47.8 | +12.6 | ||
| Labour | 1,642 | 42.1 | -6.0 | ||
| Liberal Democrats | 388 | 10.1 | -6.6 | ||
| Majority | 218 | 5.7 | |||
| Turnout | 3,854 | 34.0 | |||
| Conservative gain from Labour | Swing | ||||
| Party | Candidate | Votes | % | ±% | |
|---|---|---|---|---|---|
| Labour | 1,399 | 50.6 | -4.8 | ||
| Conservative | 1,106 | 40.1 | +12.4 | ||
| Liberal Democrats | 166 | 6.0 | -11.0 | ||
| Natural Law | 95 | 3.4 | +3.4 | ||
| Majority | 293 | 10.5 | |||
| Turnout | 2,766 | 24.9 | |||
| Labour hold | Swing | ||||
| Party | Candidate | Votes | % | ±% | |
|---|---|---|---|---|---|
| Conservative | 1,293 | 51.7 | +11.3 | ||
| Labour | 941 | 37.6 | -5.5 | ||
| Liberal Democrats | 240 | 9.6 | -6.9 | ||
| Natural Law | 27 | 1.1 | +1.1 | ||
| Majority | 352 | 14.1 | |||
| Turnout | 2,501 | 27.9 | |||
| Conservative gain from Labour | Swing | ||||
| Party | Candidate | Votes | % | ±% | |
|---|---|---|---|---|---|
| Conservative | 1,590 | 60.3 | +5.1 | ||
| Liberal Democrats | 808 | 30.7 | +3.6 | ||
| Labour | 237 | 9.0 | -8.7 | ||
| Majority | 782 | 29.6 | |||
| Turnout | 2,635 | 32.7 | |||
| Conservative hold | Swing | ||||
| Party | Candidate | Votes | % | ±% | |
|---|---|---|---|---|---|
| Labour | 1,434 | 65.6 | +5.1 | ||
| Conservative | 482 | 22.0 | -1.6 | ||
| Liberal Democrats | 270 | 12.4 | +0.3 | ||
| Majority | 952 | 43.6 | |||
| Turnout | 2,186 | 23.5 | |||
| Labour hold | Swing | ||||
2001–2005
| Party | Candidate | Votes | % | ±% | |
|---|---|---|---|---|---|
| Labour | 1,445 | 41.3 | +3.9 | ||
| Liberal Democrats | 1,113 | 31.8 | -0.2 | ||
| Conservative | 912 | 26.1 | -4.5 | ||
| Independent | 25 | 0.7 | +0.7 | ||
| Majority | 332 | 9.5 | |||
| Turnout | 3,495 | 34.7 | |||
| Labour hold | Swing | ||||
| Party | Candidate | Votes | % | ±% | |
|---|---|---|---|---|---|
| Liberal Democrats | Audrey Oaten | 1,413 | 51.0 | +35.1 | |
| Labour | Geoffrey O'Connell | 817 | 29.5 | -14.6 | |
| Conservative | Richard Southern | 472 | 17.0 | -15.8 | |
| Green | Ian West | 70 | 2.5 | -0.7 | |
| Majority | 596 | 21.5 | |||
| Turnout | 2,772 | 27.7 | |||
| Liberal Democrats gain from Labour | Swing | ||||
| Party | Candidate | Votes | % | ±% | |
|---|---|---|---|---|---|
| Conservative | 1,246 | 48.8 | +11.5 | ||
| Labour | 933 | 36.6 | -8.5 | ||
| Liberal Democrats | 372 | 14.6 | -3.0 | ||
| Majority | 313 | 12.2 | |||
| Turnout | 2,551 | 26.8 | |||
| Conservative gain from Labour | Swing | ||||
| Party | Candidate | Votes | % | ±% | |
|---|---|---|---|---|---|
| Conservative | 1,851 | 59.9 | +8.8 | ||
| Liberal Democrats | 625 | 20.2 | +2.3 | ||
| Labour | 614 | 19.9 | -5.6 | ||
| Majority | 1,226 | 39.7 | |||
| Turnout | 3,090 | 30.2 | |||
| Conservative hold | Swing | ||||
| Party | Candidate | Votes | % | ±% | |
|---|---|---|---|---|---|
| Conservative | 1,064 | 52.5 | +11.4 | ||
| Labour | 559 | 27.6 | -5.6 | ||
| Liberal Democrats | 403 | 19.9 | -5.8 | ||
| Majority | 505 | 24.9 | |||
| Turnout | 2,026 | 21.8 | |||
| Conservative hold | Swing | ||||
2005–2009
| Party | Candidate | Votes | % | ±% | |
|---|---|---|---|---|---|
| Labour | John Lloyd | 1,144 | 45.5 | -5.5 | |
| Liberal Democrats | Elisabeth Knight | 994 | 39.6 | +18.8 | |
| Conservative | Ralph Dimelow | 374 | 14.9 | -13.3 | |
| Majority | 150 | 5.9 | |||
| Turnout | 2,512 | 28.1 | |||
| Labour hold | Swing | ||||
| Party | Candidate | Votes | % | ±% | |
|---|---|---|---|---|---|
| Conservative | Richard Thake | 1,759 | 69.7 | +14.4 | |
| Labour | Joseph McWalter | 322 | 12.7 | -5.6 | |
| Liberal Democrats | Debra Wilkins | 310 | 12.3 | -7.0 | |
| Green | Stuart Madgin | 133 | 5.2 | -1.8 | |
| Majority | 1,437 | 57.0 | |||
| Turnout | 2,524 | 23.0 | |||
| Conservative hold | Swing | ||||
| Party | Candidate | Votes | % | ±% | |
|---|---|---|---|---|---|
| Conservative | Teresa Heritage | 2,161 | 66.6 | +10.4 | |
| Liberal Democrats | Alison Steer | 819 | 25.3 | -0.4 | |
| Labour | Linda Spiri | 153 | 4.7 | -7.2 | |
| Green | Annette Tate | 110 | 3.4 | -2.8 | |
| Majority | 1,342 | 41.3 | |||
| Turnout | 3,243 | 30.2 | |||
| Conservative hold | Swing | ||||
| Party | Candidate | Votes | % | ±% | |
|---|---|---|---|---|---|
| Labour | Sharon Taylor | 1,452 | 56.5 | +1.0 | |
| Conservative | Leslie Clark | 625 | 24.3 | -0.6 | |
| Liberal Democrats | Len Lambert | 329 | 12.8 | -6.8 | |
| UKIP | Rick Seddon | 165 | 6.4 | +6.4 | |
| Majority | 827 | 32.2 | |||
| Turnout | 2,571 | 29.0 | |||
| Labour hold | Swing | ||||
2009–2013
| Party | Candidate | Votes | % | ±% | |
|---|---|---|---|---|---|
| Conservative | Alan Plancey | 982 | 44.5 | +5.5 | |
| Labour | Leon Reefe | 928 | 42.1 | +13.2 | |
| Liberal Democrats | Robert Gamble | 170 | 7.7 | -4.6 | |
| Independent | Frank Ward | 125 | 5.7 | -0.1 | |
| Majority | 54 | 2.4 | |||
| Turnout | 2,205 | 18.5 | |||
| Conservative hold | Swing | ||||
| Party | Candidate | Votes | % | ±% | |
|---|---|---|---|---|---|
| Liberal Democrats | Martin Frearson | 1,482 | 42.1 | +2.6 | |
| Conservative | Salih Gaygusuz | 1,250 | 35.5 | +4.1 | |
| Labour | Iain Grant | 540 | 15.3 | -0.1 | |
| Green | Kate Metcalf | 249 | 7.1 | -6.7 | |
| Majority | 232 | 6.6 | |||
| Turnout | 3,521 | 33.1 | |||
| Liberal Democrats hold | Swing | ||||
| Party | Candidate | Votes | % | ±% | |
|---|---|---|---|---|---|
| Conservative | Colin Bernard Woodward | 2,483 | 52.7% | +7.6% | |
| Liberal Democrats | Robert Ian Taylor | 1,256 | 26.6% | +0.6% | |
| Labour | Alexander Julian Young | 977 | 20.7% | +10.5% | |
| Majority | 1,227 | ||||
| Turnout | 4,716 | ||||
| Conservative hold | Swing | ||||
At the preceding election there had also been candidates for the British National Party (307 votes, 8.0%) and for the Green Party (392 votes, 10.3%).
| Party | Candidate | Votes | % | ±% | |
|---|---|---|---|---|---|
| Conservative | Dee Hart | 1,389 | 56.44 | +14.54 | |
| Labour | Malcolm Aitken | 837 | 34.01 | +6.91 | |
| UKIP | Albert Nicholas | 159 | 6.46 | +6.46 | |
| Liberal Democrats | Peter Huse | 76 | 3.09 | -10.51 | |
| Majority | 552 | 22.43 | |||
| Turnout | 2,461 | 22.88 | |||
| Conservative hold | Swing | ||||
| Party | Candidate | Votes | % | ±% | |
|---|---|---|---|---|---|
| Liberal Democrats | Kareen Mary Hastrick | 1231 | 40.2 | -3.3% | |
| Labour | Diana Mary Ivory | 791 | 25.8 | +13.1% | |
| Conservative | Richard Lloyd Vaughan Southern | 534 | 17.4 | -10.2% | |
| UKIP | Nicholas Richard Lincoln | 351 | 11.5 | n/a | |
| Green | Paula Mary Evelyn Broadhurst | 154 | 5.0 | -2.5% | |
| Majority | 440 | 12.6% | |||
| Turnout | 3061 | 33.5 | |||
| Liberal Democrats hold | Swing | ||||
Election caused by the resignation of previous incumbent.
| Party | Candidate | Votes | % | ±% | |
|---|---|---|---|---|---|
| Conservative | William Wyatt-Lowe | 1413 | 47.8 | -3.0 | |
| Labour | Mike Bromberg | 693 | 23.5 | +8.8 | |
| Liberal Democrats | Chris Angell | 456 | 15.4 | -5.8 | |
| Green | Paul Harris | 180 | 6.1 | -7.2 | |
| UKIP | Howard Koch | 151 | 5.1 | +5.1 | |
| Independent | Rodney Tucker | 61 | 2.1 | +2.1 | |
| Majority | 720 | ||||
| Turnout | 23.8 | ||||
| Conservative hold | Swing | ||||
Election caused by the resignation of previous incumbent.[22] Percentage change is since June 2009.
2013–2017
| Party | Candidate | Votes | % | ±% | |
|---|---|---|---|---|---|
| Labour Co-op | Judi Candida BILLING | 1250 | 47.8 | +1.8 | |
| Conservative | Alan MILLARD | 673 | 25.7 | -7.0 | |
| Liberal Democrats | Lisa Victoria COURTS | 246 | 9.4 | +2.8 | |
| UKIP | John Finbarr BARRY | 235 | 9.0 | +9.0 | |
| Green | Gavin NICHOLSON | 212 | 8.1 | -6.6 | |
| Majority | 577 | ||||
| Turnout | 2621 | 22.42 | |||
| Labour Co-op hold | Swing | ||||
Caused by the death of the previous incumbent.
2017–2021
Council leader and Conservative councillor Robert Gordon CBE (Goffs Oak and Bury Green) died in October 2017.[25] The seat was held for the Conservatives by Lesley Greensmith in the by-election on 22 February 2018.[26]
| Party | Candidate | Votes | % | ±% | |
|---|---|---|---|---|---|
| Conservative | Lesley Greensmyth | 1,390 | 59.6 | -5.3 | |
| Liberal Democrats | David Payne | 482 | 20.7 | +14.9 | |
| Labour | Selina Norgrove | 393 | 16.8 | -0.8 | |
| Green | Sally Kemp | 69 | 3.0 | N/A | |
| Majority | 1,536 | ||||
| Turnout | 2,334 | 19 | -8 | ||
| Conservative hold | Swing | ||||
Liberal Democrat councillor Charlotte Hogg (St Albans North) resigned from the council in March 2018.[27] A by-election was held on 3 May, where Roma Mills from the Labour Party captured the seat from the Liberal Democrats.[26]
| Party | Candidate | Votes | % | ±% | |
|---|---|---|---|---|---|
| Labour | Roma Mills | 1,779 | 36.6 | +2.8 | |
| Liberal Democrats | Karen Young | 1,460 | 30.1 | -5.2 | |
| Conservative | Salih Gaygusuz | 1,361 | 28.0 | +1.9 | |
| Green | Simon Grover | 258 | 5.3 | +2.2 | |
| Majority | 319 | 6.5 | |||
| Turnout | 4,858 | 48 | |||
| Labour gain from Liberal Democrats | Swing | ||||
| Party | Candidate | Votes | % | ±% | |
|---|---|---|---|---|---|
| Liberal Democrats | Phil Williams | 1,846 | 53.4 | +9.6 | |
| Conservative | Angela Killick | 1,315 | 38.0 | -9.0 | |
| Labour | Jenni Gillet | 144 | 4.2 | ±0.0 | |
| UKIP | David Bennett | 86 | 2.5 | +0.6 | |
| Green | Roan Alder | 68 | 2.0 | -1.0 | |
| Majority | |||||
| Turnout | 3,463 | 30 | |||
| Liberal Democrats gain from Conservative | Swing | ||||
2021–2025
| Party | Candidate | Votes | % | ±% | |
|---|---|---|---|---|---|
| Liberal Democrats | Keith Hoskins | 2,401 | 71.7 | +34.0 | |
| Conservative | Claire Strong | 690 | 20.6 | -16.3 | |
| Green | Deolinda Eltringham | 223 | 6.7 | -2.2 | |
| CPA | Leigh Smith | 35 | 1.0 | ±0.0 | |
| Majority | 1,711 | 51.1 | |||
| Turnout | 3,363 | 31.4 | |||
| Liberal Democrats hold | Swing | ||||
The by-election was caused by the death of the incumbent Liberal Democrat, Paul Clark in December 2021. The Lib Dems won with an increased majority with Labour opting not to nominate a candidate.
| Party | Candidate | Votes | % | ±% | |
|---|---|---|---|---|---|
| Labour | Ian Clive Albert | 1992 | 65.8 | +12.7 | |
| Conservative | Ralph Gerald Muncer | 526 | 17.4 | -9.5 | |
| Green | Deolinda Maria Eltringham | 415 | 13.7 | +3.3 | |
| CPA | Leigh Smith | 93 | 3.1 | +3.1 | |
| Majority | 1466 | 48.4 | |||
| Turnout | 3036 | 26.4 | -17 | ||
| Labour hold | Swing | ||||
The by-election was caused by the death of the Labour incumbent, Judi Billing in November 2022. Labour won with an increased majority with the Lib Dems opting not to nominate a candidate.
| Party | Candidate | Votes | % | ±% | |
|---|---|---|---|---|---|
| Liberal Democrats | Allison Wren | 1,474 | 58.2 | +32.9 | |
| Conservative | Claudio Duran | 766 | 30.3 | -26.8 | |
| Labour | Symon Vegro | 168 | 6.7 | -4.0 | |
| Green | Mario May | 119 | 4.8 | -2.1 | |
| Majority | 708 | 27.9 | N/A | ||
| Turnout | 2,538 | 22.6 | -21.6 | ||
| Liberal Democrats gain from Conservative | Swing | ||||
This by-election was caused by the resignation of the incumbent Conservative, Annie Brewster.
References
- By-election results Archived 29 March 2010 at the Wayback Machine