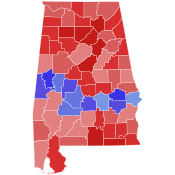
United States Senate elections in Alabama occur when voters in the U.S. state of Alabama select an individual to represent the state in the United States Senate in either of the state's two seats allotted by the Constitution . Regularly scheduled general elections occur on Election Day , coinciding with various other federal, statewide, and local races.
Each state is allotted two U.S. Senators elected to staggered six-year terms, which were originally selected by the state legislature . The Senate is divided into three classes to stagger the terms of its members such that one-third of the Senate would be up for re-election every two years. Upon Alabama's admission to the Union in 1819, the state was assigned a Class 2 seat and a Class 3 seat, first elected in 1819 . Since the passage of the Seventeenth Amendment in 1913, U.S. Senators are elected directly by the voters of each state. Special elections may be held to fill mid-term vacancies to elect an individual to serve the remainder of the unexpired term.
The list below contains results from all U.S. Senate elections held in Alabama after the passage of the Seventeenth Amendment, sorted by year. The next scheduled election for the Class 2 seat is in 2026 , while the Class 3 seat will hold its next election in 2028 .
List of recent elections
Class 2 Year Winner Runner-up Others Ref Candidate Party Votes % Candidate Party Votes % Votes % 1918 John H. Bankhead Democratic 54,880 100.00% [1] 1920 (sp) James Thomas Heflin Democratic 160,680 Charles P. Lunsford Republican 68,460 2,820 [2] 1924 James Thomas Heflin Democratic 154,560 Frank H. Lathrop Republican 39,818 [3] 1930 John H. Bankhead II Democratic 150,985 James Thomas Heflin Independent 100,952 [4] 1936 John H. Bankhead II Democratic 239,532 H. E. Berkstresser Republican 33,697 2,023 [5] 1942 John H. Bankhead II Democratic 69,212 100.00% [6] 1946 (sp) John Sparkman Democratic 163,217 100.00% [7] 1948 John Sparkman Democratic 185,534 Paul G. Parsons Republican 35,341 [8] 1954 John Sparkman Democratic 259,348 Junius Foy Guin Jr. Republican 55,110 [9] 1960 John Sparkman Democratic 389,196 Julian Elgin Republican 164,868 [10] 1966 John Sparkman Democratic 482,138 John Grenier Republican 313,018 7,452 [11] 1972 John Sparkman Democratic 654,491 Winton M. Blount Republican 347,523 49,085 [12] 1978 Howell Heflin Democratic 547,054 Jerome B. Couch Prohibition 34,951 [13] 1984 Howell Heflin Democratic 860,535 Albert L. Smith Jr. Republican 498,508 12,195 [14] 1990 Howell Heflin Democratic 717,814 60.55% William J. Cabaniss Republican 467,190 39.41% 559 0.04% [15] 1996 Jeff Sessions Republican 786,436 52.45% Roger Bedford Jr. Democratic 681,651 45.46% 31,306 2.09% [16] 2002 Jeff Sessions Republican 792,561 58.58% Susan Parker Democratic 538,878 39.83% 21,584 1.59% [17] 2008 Jeff Sessions Republican 1,305,383 63.36% Vivian Davis Figures Democratic 752,391 36.52% 2,417 0.12% [18] 2014 Jeff Sessions Republican 795,606 97.25% Scattered Write-in 22,484 2.75% [19] 2017 (sp) Doug Jones Democratic 673,896 Roy Moore Republican 651,972 22,852 [20] 2020 Tommy Tuberville Republican 1,392,076 60.10% Doug Jones Democratic 920,478 39.74% 3,891 0.17% [21]
County results of Class 2 elections since 2002
Class 3 Year Winner Runner(s)-up Others Ref Candidate Party Votes % Candidate Party Votes % Votes % 1914 (sp) Francis S. White Democratic 102,326 99.94% Scattered Write-in 58 0.06% [22] 1914 Oscar Underwood Democratic 163,338 90.20% Alex C. Birch Republican 12,320 6.80% 4,263 2.35% [23] 1920 Oscar Underwood Democratic 154,664 L. H. Reynolds Republican 77,337 1,984 [2] 1926 Hugo Black Democratic 91,801 Edmund H. Dryer Republican 21,712 [24] 1932 Hugo Black Democratic 209,614 J. Theodore Johnson Republican 33,425 [25] 1938 (sp) J. Lister Hill Democratic 49,429 100.00% [26] 1938 J. Lister Hill Democratic 113,413 J. M. Pennington Republican 17,885 1 [27] 1944 J. Lister Hill Democratic 202,604 John Posey Republican 41,983 3,162 [28] 1950 J. Lister Hill Democratic 125,534 John G. Crommelin Independent 38,477 [29] 1956 J. Lister Hill Democratic 330,182 100.00% [30] 1962 J. Lister Hill Democratic 201,937 James D. Martin Republican 195,134 [31] 1968 James Allen Democratic 638,774 Perry Hooper Sr. Republican 201,227 [32] Robert P. Schwenn National Democratic 72,699 1974 James Allen Democratic 501,541 Alvin Abercrombie Prohibition 21,749 [33] 1978 (sp) Donald Stewart Democratic 401,852 James D. Martin Republican 316,170 11,820 [34] 1980 Jeremiah Denton Republican 650,362 Jim Folsom Jr. Democratic 610,175 36,220 [35] 1986 Richard Shelby Democratic 609,360 50.28% Jeremiah Denton Republican 602,537 49.72% 56 0.00% [36] 1992 Richard Shelby Democratic 1,022,698 64.82% Richard Sellers Republican 522,015 33.08% 33,086 [37] 1998 Richard Shelby Republican 817,973 63.24% Clayton Suddith Democratic 474,568 36.69% 864 0.07% [38] 2004 Richard Shelby Republican 1,242,200 67.55% Wayne Sowell Democratic 595,018 32.35% 1,848 0.10% [39] 2010 Richard Shelby Republican 968,181 65.18% William G. Barnes Democratic 515,619 34.71% 1,699 0.11% [40] 2016 Richard Shelby Republican 1,335,104 63.96% Ron Crumpton Democratic 748,709 35.87% 3,631 0.17% [41] 2022 Katie Britt Republican 942,154 Will Boyd Democratic 436,746 35,338 [42]
County results of Class 3 elections since 2004
See also
References
External links 


