Nazi Party Election Results presents a series of tables that summarize the election results of the Nazi Party in German national and state elections. They display the number of votes received, the percentage of the vote, the Party's numerical ranking, the number of parliamentary seats won and the change in the number of seats.
- The national data track the results of all parliamentary and presidential elections that the Party contested from its re-founding in 1925 throughout the existence of the Weimar Republic and the Third Reich, ending with the last Reichstag election in 1938.
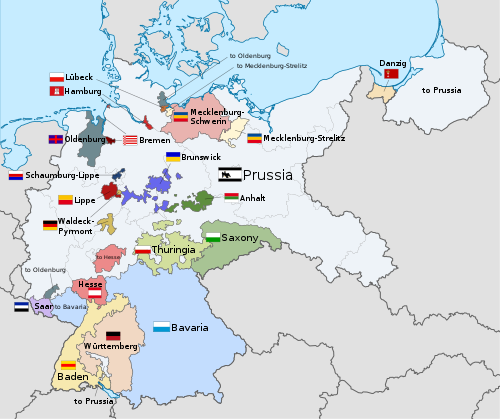
- The state tables provide election results in the seventeen landtage (state parliaments) during the Weimar period only, from the Party's reestablishment in 1925 through the elections of 1932. The "Provisional Law on the Coordination of the States with the Reich" was enacted on 31 March 1933 and directed that the existing elected landtage were to be reconstituted on the basis of each party's share of the votes received in the Reichstag election of 5 March.[1] This was followed by the Law on the Reconstruction of the Reich, which was passed on 30 January 1934, abolishing the state landtage altogether and transferring the sovereign rights of the states to the Reich government, thus effectively replacing the German federal system with a unitary state.[2] No subsequent state elections were conducted.
Tables of national election results[3]
German Reichstag
| Election year | Votes | % | +/– | Seats won | +/– | Position | Leader | Status | Notes |
|---|---|---|---|---|---|---|---|---|---|
| 1928 | 810,127 | 2.63 | 12 / 491 | 9 | Opposition | ||||
| 1930 | 6,379,672 | 18.25 | 107 / 577 | Main opposition | |||||
| July 1932 | 13,745,680 | 37.27 | 230 / 608 | ||||||
| November 1932 | 11,737,021 | 33.09 | 196 / 584 | Last free and fair election. | |||||
| March 1933 | 17,277,180 | 43.91 | 288 / 647 | Coalition government | Semi-free yet questionable election. Last multi-party contested election. | ||||
| November 1933 | 39,655,224 | 92.11 | 661 / 661 | Majority government | Sole legal party. | ||||
| 1936 | 44,462,458 | 98.80 | 741 / 741 | ||||||
| 1938 | 44,451,092 | 99.08 | 813 / 813 |

German Presidency
| Election year | Candidate | First round | Second round | ||||
|---|---|---|---|---|---|---|---|
| Votes | % | Place | Votes | % | Place | ||
| 1925 | endorsed Erich Ludendorff (1.1%) | endorsed Paul von Hindenburg (48.3%) | |||||
| 1932 | Adolf Hitler | 11,339,446 | 30.1 | 2nd | 13,418,547 | 36.8 | 2nd |
Tables of state Landtag election results[4]
Anhalt
| Election year | Votes | % | Seats won | +/– |
|---|---|---|---|---|
| 1928 | 4,117 | 2.07% #8 | 1 / 36 | |
| 1932 | 89,652 | 40.88% #1 | 15 / 36 |
Baden
| Election year | Votes | % | Seats won | +/– |
|---|---|---|---|---|
| 1925 | 8,917 | 1.16% #8 | 0 / 72 | |
| 1929 | 65,121 | 6.98% #4 | 6 / 88 |
Bavaria
| Election year | Votes | % | Seats won | +/– |
|---|---|---|---|---|
| 1928 | 203,115 | 6.13 #5 | 9 / 128 | |
| 1932 | 1,270,792 | 32.52% #2 | 43 / 128 |
Bremen
| Election year | Votes | % | Seats won | +/– |
|---|---|---|---|---|
| 1930 | 51,327 | 25.40% #2 | 32 / 120 |
Brunswick
| Election year | Votes | % | Seats won | +/– |
|---|---|---|---|---|
| 1927 | 10,358 | 3.73 #8 | 1 / 48 | |
| 1930 | 67,902 | 22.16% #3 | 9 / 40 |
Hamburg
| Election year | Votes | % | Seats won | +/– |
|---|---|---|---|---|
| 1927 | 9,754 | 1.50% #8 | 2 / 160 | |
| 1928 | 14,760 | 2.15% #7 | 3 / 160 | |
| 1931 | 202,506 | 26.25% #2 | 43 / 160 | |
| 1932 | 233,750 | 31.23% #1 | 51 / 160 |
Hesse
| Election year | Votes | % | Seats won | +/– |
|---|---|---|---|---|
| 1931 | 291,183 | 37.08% #1 | 27 / 70 | |
| 1932 | 328,306 | 43.97% #1 | 32 / 70 |
Lippe
| Election year | Votes | % | Seats won | +/– |
|---|---|---|---|---|
| 1929 | 2,713 | 3.35% #9 | 0 / 21 | |
| 1933 | 39,064 | 39.48% #1 | 9 / 21 |
Lübeck
| Election year | Votes | % | Seats won | +/– |
|---|---|---|---|---|
| 1929 | 6,347 | 8.08% #4 | 6 / 80 | |
| 1932 | 27,689 | 33.13% #2 | 27 / 80 |
Mecklenburg-Schwerin
| Election year | Votes | % | Seats won | +/– |
|---|---|---|---|---|
| 1926 | 4,607 | 1.65% #9 | 0 / 50 | |
| 1927 | 5,611 | 1.80% #9 | 0 / 52 | |
| 1929 | 12,721 | 4.05% #4 | 2 / 51 | |
| 1932 | 177,076 | 48.98% #1 | 30 / 59 |
Mecklenburg-Strelitz
| Election year | Votes | % | Seats won | +/– |
|---|---|---|---|---|
| 1932 | 14,235 | 23.86% #3 | 9 / 35 |
Oldenburg
| Election year | Votes | % | Seats won | +/– |
|---|---|---|---|---|
| 1928 | 17,457 | 7.52% #5 | 3 / 48 | |
| 1931 | 97,806 | 37.23%#1 | 19 / 48 | |
| 1932 | 131,543 | 48.38% #1 | 24 / 46 |
Prussia
| Election year | Votes | % | Seats won | +/– |
|---|---|---|---|---|
| 1928 | 346,771 | 1.84 #9 | 6 / 450 | |
| 1932 | 8,091,072 | 36.67% #1 | 162 / 423 |
Saxony
| Election year | Votes | % | Seats won | +/– |
|---|---|---|---|---|
| 1929 | 133,958 | 4.96 #7 | 5 / 96 | |
| 1930 | 376,769 | 14.43% #2 | 14 / 96 |
Schaumburg-Lippe
| Election year | Votes | % | Seats won | +/– |
|---|---|---|---|---|
| 1928 | 1,690 | 6.78 #6 | 1 / 15 | |
| 1931 | 7,854 | 26.94% #2 | 4 / 15 |
Thuringia
| Election year | Votes | % | Seats won | +/– |
|---|---|---|---|---|
| 1927 | 27,946 | 3.48% #5 | 2 / 56 | |
| 1929 | 90,159 | 11.29% #3 | 6 / 53 | |
| 1932 | 395,321 | 42.49% #1 | 26 / 61 |
Württemberg
| Election year | Votes | % | Seats won | +/– |
|---|---|---|---|---|
| 1928 | 20,342 | 1.81% #10 | 0 / 80 | |
| 1932 | 328,320 | 26.38% #1 | 23 / 80 |
References
Sources
- Broszat, Martin (1981). The Hitler State: The Foundation and Development of the Internal Structure of the Third Reich. New York: Longman Inc. ISBN 978-0-582-48997-4.
- Gonschior, Andreas. "Wahlen in der Weimarer Republik". (Elections in the Weimar Republic).
🔥 Top keywords: Main PageSpecial:SearchWikipedia:Featured picturesYasukeHarrison ButkerRobert FicoBridgertonCleopatraDeaths in 2024Joyce VincentXXXTentacionHank AdamsIt Ends with UsYouTubeNew Caledonia2024 Indian general electionHeeramandiDarren DutchyshenSlovakiaKingdom of the Planet of the ApesAttempted assassination of Robert FicoLawrence WongBaby ReindeerXXX: Return of Xander CageThelma HoustonFuriosa: A Mad Max SagaMegalopolis (film)Richard GaddKepler's SupernovaWicked (musical)Sunil ChhetriXXX (2002 film)Ashley MadisonAnya Taylor-JoyPlanet of the ApesNava MauYoung SheldonPortal:Current eventsX-Men '97