Northamptonshire County Council was the county council for Northamptonshire in England. It was initially created in 1889 under the Local Government Act 1888, with its functions being substantially reformed in 1974 under the Local Government Act 1972. The council was abolished in 2021, with the area split into North Northamptonshire and West Northamptonshire. Elections to Northamptonshire County Council were held every four years.
Political control
| Party in control | Years | |
|---|---|---|
| Labour | 1973–1977 | |
| Conservative | 1977–1981 | |
| No overall control | 1981–1993 | |
| Labour | 1993–2005 | |
| Conservative | 2005–2021 | |
Leadership
The leaders of the council from 2005 until the council's abolition in 2021 were:
| Councillor | Party | From | To | |
|---|---|---|---|---|
| Jim Harker[1] | Conservative | 2005 | May 2016 | |
| Heather Smith[2] | Conservative | May 2016 | 15 Mar 2018 | |
| Matthew Golby[3] | Conservative | 12 Apr 2018 | 31 Mar 2021 | |
Council elections
County result maps
 2001 results map
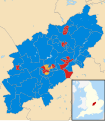 2005 results map
 2009 results map
 2013 results map
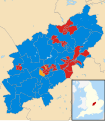
 2017 results map


By-election results
1993–1997
| Party | Candidate | Votes | % | ±% | |
|---|---|---|---|---|---|
| Liberal Democrats | 801 | 56.6 | |||
| Labour | 486 | 34.4 | |||
| Conservative | 104 | 7.4 | |||
| UKIP | 23 | 1.6 | |||
| Majority | 315 | 22.2 | |||
| Turnout | 1,414 | 28.2 | |||
| Liberal Democrats hold | Swing | ||||
| Party | Candidate | Votes | % | ±% | |
|---|---|---|---|---|---|
| Labour | 793 | 51.6 | |||
| Conservative | 562 | 36.4 | |||
| Liberal Democrats | 181 | 11.8 | |||
| Majority | 231 | 15.2 | |||
| Turnout | 1,536 | 20.8 | |||
| Labour hold | Swing | ||||
2001–2005
| Party | Candidate | Votes | % | ±% | |
|---|---|---|---|---|---|
| Conservative | 1,621 | 68.3 | +9.6 | ||
| Labour | 753 | 31.7 | -9.6 | ||
| Majority | 868 | 36.6 | |||
| Turnout | 2,374 | ||||
| Conservative hold | Swing | ||||
| Party | Candidate | Votes | % | ±% | |
|---|---|---|---|---|---|
| Labour | 469 | 41.9 | -30.7 | ||
| Liberal Democrats | 420 | 37.5 | +37.5 | ||
| Conservative | 230 | 20.6 | -6.8 | ||
| Majority | 49 | 4.4 | |||
| Turnout | 1,119 | 17.1 | |||
| Labour hold | Swing | ||||
| Party | Candidate | Votes | % | ±% | |
|---|---|---|---|---|---|
| Labour | 524 | 39.2 | -20.2 | ||
| Liberal Democrats | 466 | 34.9 | +18.6 | ||
| Conservative | 347 | 26.0 | +1.7 | ||
| Majority | 58 | 4.3 | |||
| Turnout | 1,337 | 21.8 | |||
| Labour hold | Swing | ||||
| Party | Candidate | Votes | % | ±% | |
|---|---|---|---|---|---|
| Conservative | Andre Gonzalez de Savage | 1,228 | 48.4 | +1.7 | |
| Liberal Democrats | Charles Markham | 694 | 27.4 | +9.1 | |
| Labour | Simon Draper | 614 | 24.2 | -10.8 | |
| Majority | 534 | 21.0 | |||
| Turnout | 2,536 | 38.5 | |||
| Conservative hold | Swing | ||||
2005–2009
| Party | Candidate | Votes | % | ±% | |
|---|---|---|---|---|---|
| Conservative | Stephen Osborne | 1,541 | 67.0 | +2.4 | |
| Liberal Democrats | Robert Patchett | 456 | 19.8 | +19.8 | |
| Labour | Beatrice Price | 302 | 13.1 | -22.3 | |
| Majority | 1,085 | 47.2 | |||
| Turnout | 2,299 | 36.7 | |||
| Conservative hold | Swing | ||||
| Party | Candidate | Votes | % | ±% | |
|---|---|---|---|---|---|
| Conservative | Heather Smith | 1,866 | 70.4 | +8.2 | |
| Liberal Democrats | David Burgess | 461 | 17.4 | -2.8 | |
| Labour | David Fisher | 322 | 12.2 | -5.4 | |
| Majority | 1,405 | 53.0 | |||
| Turnout | 2,649 | 44.7 | |||
| Conservative hold | Swing | ||||
| Party | Candidate | Votes | % | ±% | |
|---|---|---|---|---|---|
| Conservative | Catherine Boardman | 2,307 | 70.3 | +8.6 | |
| Liberal Democrats | Robert Patchett | 641 | 19.5 | +19.5 | |
| Independent | Alan Tebbutt | 333 | 10.1 | +10.1 | |
| Majority | 1,666 | 50.8 | |||
| Turnout | 3,281 | 43.4 | |||
| Conservative hold | Swing | ||||
| Party | Candidate | Votes | % | ±% | |
|---|---|---|---|---|---|
| Labour | Bob Scott | 1,093 | 53.5 | -8.7 | |
| Conservative | Lynn Wilson | 375 | 18.3 | -2.7 | |
| Liberal Democrats | Chris Stanbra | 311 | 15.2 | -1.6 | |
| BNP | Rob Walker | 265 | 13.0 | +13.0 | |
| Majority | 718 | 35.2 | |||
| Turnout | 2,044 | 30.7 | |||
| Labour hold | Swing | ||||
2009–2013
| Party | Candidate | Votes | % | ±% | |
|---|---|---|---|---|---|
| Liberal Democrats | Chris Lofts | 1,279 | 60.7% | +32.6% | |
| Conservative | Ian Alexander McCord | 638 | 30.3% | -30.7% | |
| UKIP | Barry Joseph Mahoney | 124 | 5.9% | +5.9% | |
| BNP | Mark Andrew Plowman | 66 | 3.1% | +3.1% | |
| Majority | 641 | 30.4% | |||
| Turnout | 2107 | ||||
| Liberal Democrats gain from Conservative | Swing | +31.7% | |||
2013–2017
| Party | Candidate | Votes | % | ±% | |
|---|---|---|---|---|---|
| Conservative | Ronald Sawbridge | 1081 | 52.7 | +9.9 | |
| UKIP | Barry Joseph Mahoney | 604 | 29.4 | -6.0 | |
| Labour | Christopher Lee | 221 | 10.8 | -2.3 | |
| Liberal Democrats | Scott Jon Collins | 141 | 6.9 | -1.9 | |
| Majority | 477 | 23.6 | +16.2 | ||
| Turnout | 2051 | 22.86 | |||
| Conservative hold | Swing | ||||
| Party | Candidate | Votes | % | ±% | |
|---|---|---|---|---|---|
| Conservative | Malcolm Longley | 1,019 | 40.5 | +6.5 | |
| Labour | Abigail Campbell | 989 | 39.3 | +9.5 | |
| UKIP | Eric MacAnndrais | 506 | 20.1 | -11.4 | |
| Majority | 30 | 1.2 | |||
| Turnout | 2,514 | ||||
| Conservative hold | Swing | ||||
| Party | Candidate | Votes | % | ±% | |
|---|---|---|---|---|---|
| Conservative | Cecile Irving-Swift | 1,297 | 55.4 | +4.4 | |
| UKIP | Stephen Pointer | 500 | 21.3 | -3.7 | |
| Labour | Robert McNally | 248 | 10.6 | -2.6 | |
| Green | Stephen Whiffen | 228 | 9.7 | +3.0 | |
| Liberal Democrats | Daniel Jones | 69 | 2.9 | -1.1 | |
| Majority | 797 | 34.0 | |||
| Turnout | 2,342 | ||||
| Conservative hold | Swing | ||||
2017–2021
| Party | Candidate | Votes | % | ±% | |
|---|---|---|---|---|---|
| Conservative | Jason Smithers | 1,414 | 56.6 | -3.5 | |
| Labour | Gary Day | 557 | 22.3 | +3.5 | |
| Liberal Democrats | Suzanna Austin | 336 | 13.5 | +2.3 | |
| UKIP | Bill Cross | 109 | 4.4 | -5.5 | |
| Green | Simon Turner | 81 | 3.2 | +3.2 | |
| Majority | 857 | 34.3 | |||
| Turnout | 2,497 | ||||
| Conservative hold | Swing | ||||
| Party | Candidate | Votes | % | ±% | |
|---|---|---|---|---|---|
| Labour | Anjona Roy | 839 | 44.6 | +4.3 | |
| Liberal Democrats | Martin Sawyer | 564 | 30.0 | +0.1 | |
| Conservative | Ausra Uzukauskaite | 285 | 15.1 | -7.2 | |
| UKIP | Andy Smiles | 111 | 5.9 | -1.6 | |
| Green | Scott Mabbutt | 83 | 4.4 | +4.4 | |
| Majority | 275 | 14.6 | |||
| Turnout | 1883 | 21.4 | |||
| Labour hold | Swing | ||||
| Party | Candidate | Votes | % | ±% | |
|---|---|---|---|---|---|
| Conservative | Annabel de Capell Brooke | 1,864 | 51.3 | -14.1 | |
| Liberal Democrats | Marc Folgate | 1,276 | 35.1 | +24.6 | |
| Labour | Harry James | 403 | 11.1 | -12.9 | |
| UKIP | Allan Shipham | 89 | 2.4 | +2.4 | |
| Majority | 588 | 16.2 | |||
| Turnout | 3632 | 36.9 | |||
| Conservative hold | Swing | ||||
References
External links
- "Elections and voting". Northamptonshire County Council.
- "Local Authority Byelection Results (1996-2016)". gwydir.demon.co.uk. Archived from the original on 2 February 2016.
🔥 Top keywords: Main PageSpecial:SearchWikipedia:Featured picturesYasukeHarrison ButkerRobert FicoBridgertonCleopatraDeaths in 2024Joyce VincentXXXTentacionHank AdamsIt Ends with UsYouTubeNew Caledonia2024 Indian general electionHeeramandiDarren DutchyshenSlovakiaKingdom of the Planet of the ApesAttempted assassination of Robert FicoLawrence WongBaby ReindeerXXX: Return of Xander CageThelma HoustonFuriosa: A Mad Max SagaMegalopolis (film)Richard GaddKepler's SupernovaWicked (musical)Sunil ChhetriXXX (2002 film)Ashley MadisonAnya Taylor-JoyPlanet of the ApesNava MauYoung SheldonPortal:Current eventsX-Men '97