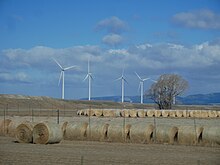
Wind power in Montana is a growing industry. Montana had over 695 MW of wind generation capability by 2016, responsible for 7.6% of in-state electricity generation.[1]

History


At a nameplate capacity of 210 megawatts (MW),[2][3] the $500 million[4][5] Glacier Wind Farm, which is located in Toole and Glacier counties,[2] became Montana's largest in October 2009,[4] surpassing the 135 MW Judith Gap Wind Farm in Wheatland County.[4]
Rim Rock Wind Farm, brought online in September 2012, is located about 25 miles due north of the Glacier project. The wind farm has 126 wind turbines of 1.5 megawatts each, to be supplied by Acciona.[6] The project had been delayed due to issues with the Montana-Alberta Tie Line, which connects wind farms in the area to Lethbridge, Alberta.[2][7][8]Montana added two significant wind projects in 2012. The Gordon Butte Wind Farm, 9 MW, was completed early in the year and the Rim Rock Wind Project, 189 MW, was completed in September.
Installed capacity growth
| Montana Wind Generation Capacity by Year | Montana Wind Generation by Year |
|---|---|
 |  |
| Megawatts of Wind Capacity[9][10][11][12] | Thousand megawatt-hours of Wind Generation[13][14][15] |
Wind Farms

Glacier Wind Farm became Montana's largest wind farm with completion of the first 106.5 MW stage in late 2008, then nearly doubled in size to a 210 MW capacity when joined by the second stage in 2009.[16] Numerous smaller farms were constructed during the following decade. Glacier will be surpassed by the 240 MW Pryor Mountain Wind Project upon its completion in late 2020.[17]
Wind generation
| Montana Wind Generation (GWh, Million kWh) | |||||||||||||
|---|---|---|---|---|---|---|---|---|---|---|---|---|---|
| Year | Total | Jan | Feb | Mar | Apr | May | Jun | Jul | Aug | Sep | Oct | Nov | Dec |
| 2006 | 434 | 47 | 48 | 32 | 38 | 34 | 29 | 25 | 24 | 34 | 21 | 46 | 56 |
| 2007 | 496 | 72 | 44 | 53 | 36 | 35 | 24 | 19 | 28 | 35 | 47 | 37 | 66 |
| 2008 | 594 | 69 | 67 | 56 | 46 | 45 | 37 | 29 | 36 | 27 | 52 | 62 | 68 |
| 2009 | 819 | 107 | 58 | 81 | 77 | 64 | 40 | 36 | 20 | 49 | 75 | 130 | 82 |
| 2010 | 930 | 81 | 55 | 92 | 104 | 85 | 69 | 62 | 60 | 60 | 81 | 101 | 80 |
| 2011 | 1,263 | 150 | 108 | 84 | 112 | 102 | 84 | 76 | 59 | 73 | 113 | 138 | 164 |
| 2012 | 1,263 | 163 | 87 | 130 | 94 | 98 | 110 | 57 | 58 | 54 | 121 | 127 | 164 |
| 2013 | 1,755 | 206 | 189 | 140 | 164 | 132 | 110 | 88 | 57 | 85 | 127 | 197 | 259 |
| 2014 | 1,973 | 259 | 172 | 174 | 188 | 98 | 126 | 100 | 101 | 108 | 202 | 237 | 208 |
| 2015 | 2,174 | 258 | 167 | 238 | 147 | 101 | 82 | 132 | 117 | 141 | 166 | 209 | 207 |
| 2016 | 2,139 | 197 | 263 | 223 | 162 | 140 | 150 | 125 | 113 | 168 | 150 | 205 | 243 |
| 2017 | 2,155 | 200 | 195 | 206 | 204 | 195 | 147 | 122 | 132 | 137 | 208 | 198 | 211 |
| 2018 | 2,153 | 178 | 169 | 214 | 216 | 161 | 179 | 141 | 148 | 149 | 177 | 211 | 210 |
| 2019 | 2,373 | 221 | 192 | 191 | 212 | 189 | 177 | 171 | 161 | 209 | 219 | 211 | 220 |
| 2020 | 2,992 | 273 | 286 | 234 | 265 | 215 | 233 | 164 | 161 | 220 | 257 | 371 | 313 |
| 2021 | 2,823 | 286 | 212 | 275 | 236 | 197 | 193 | 138 | 186 | 222 | 241 | 350 | 287 |
| 2022 | 4,035 | 472 | 411 | 390 | 345 | 317 | 234 | 185 | 188 | 210 | 289 | 526 | 468 |
| 2023 | 1,399 | 457 | 573 | 369 | |||||||||
Teal background indicates the largest wind generation month for the year.
Green background indicates the largest wind generation month to date.
Source:[18]
See also
References


