Tập tin:Solar AM0 spectrum with visible spectrum background (en).png
Kích thước hình xem trước: 800×494 điểm ảnh. Độ phân giải khác: 320×198 điểm ảnh | 640×395 điểm ảnh | 1.024×632 điểm ảnh | 1.280×790 điểm ảnh | 1.882×1.162 điểm ảnh.
Tập tin gốc (1.882×1.162 điểm ảnh, kích thước tập tin: 181 kB, kiểu MIME: image/png)
Miêu tả
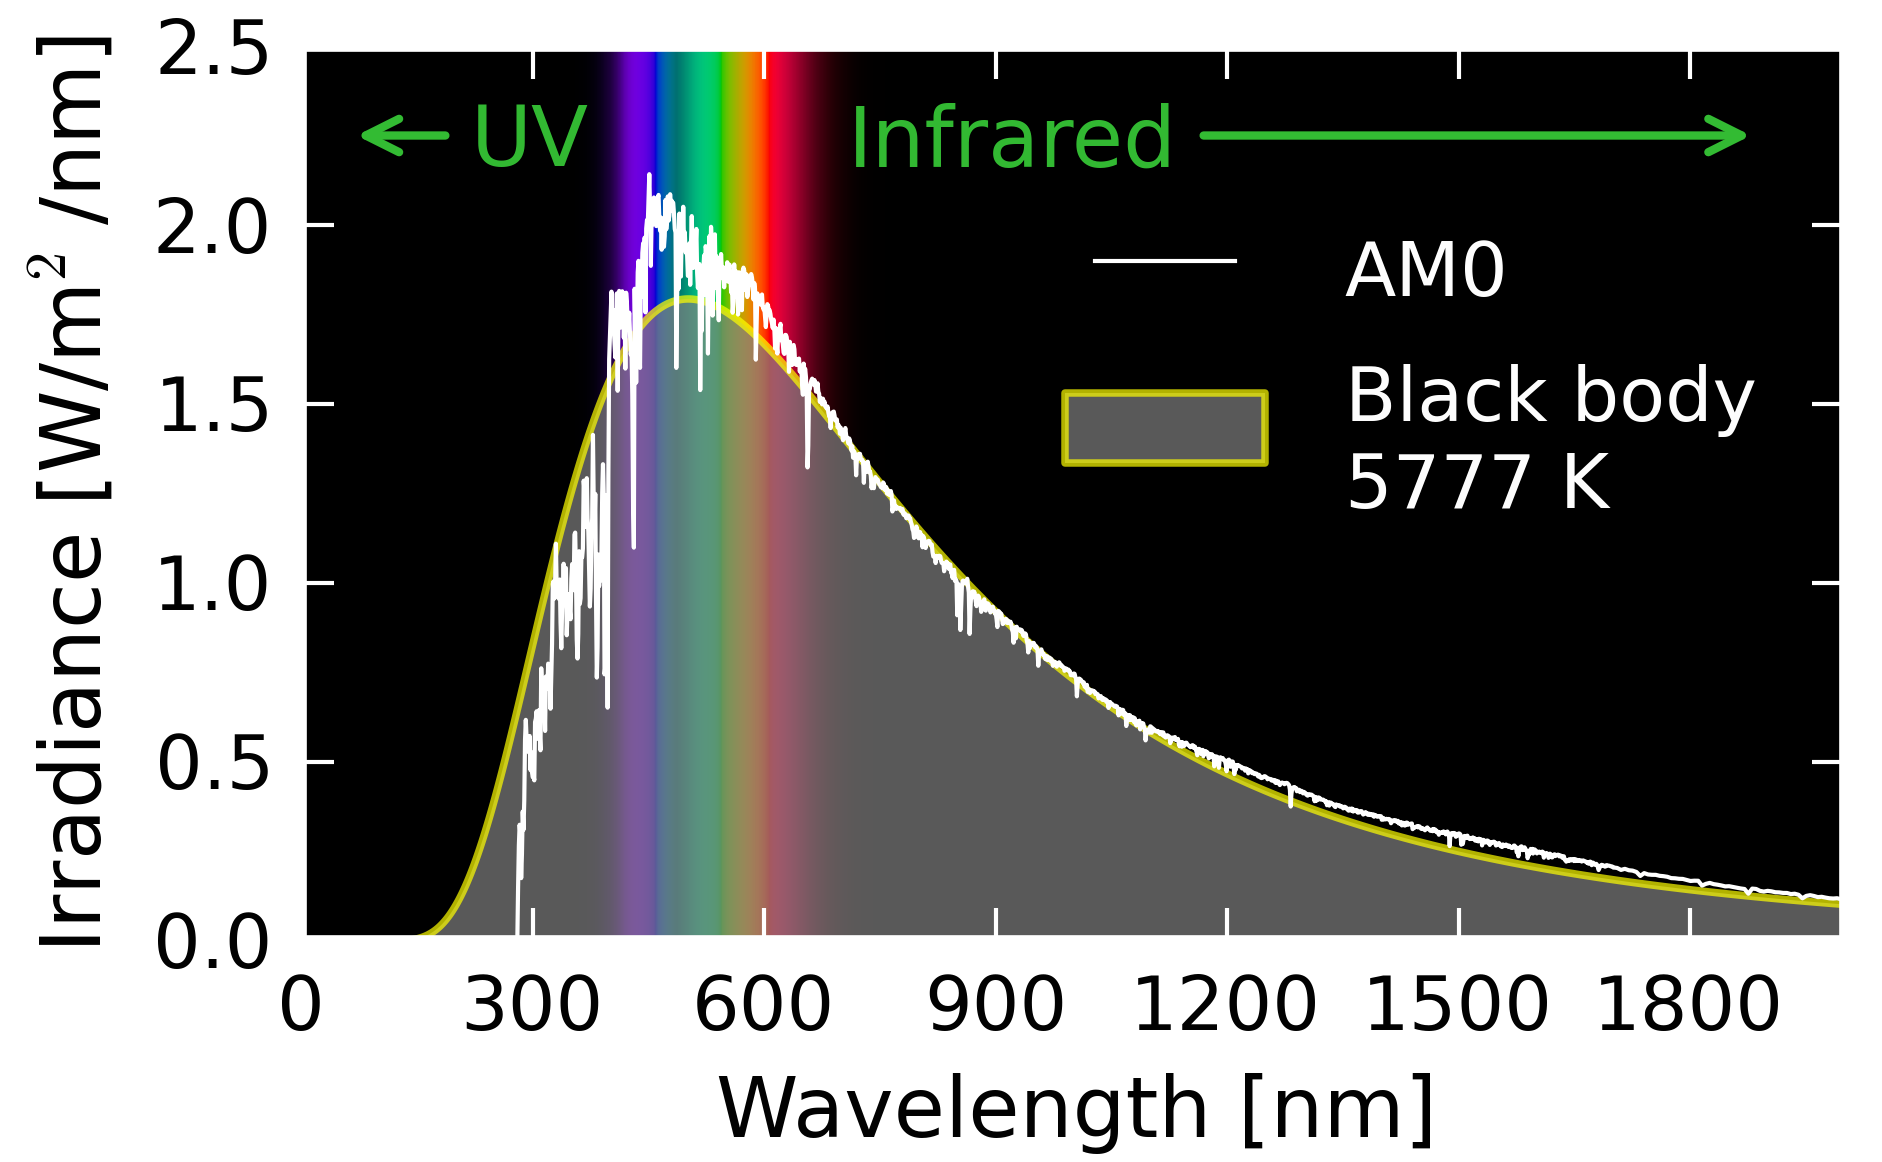
| Miêu tả | English: Solar AM0 (Air Mass Zero) spectrum (Chris A. Gueymard 2002) as included in SMARTS 2.95, together with a blackbody spectrum for 5777 kelvin and solid angle 2.16e-5*π steradian for the source (the solar disk). The visible region of the electromagnetic spectrum is shown using the CIE visible spectrum as implemented in ColorPy by Mark Kness (2008). Figure with English labels. |
| Ngày | |
| Nguồn gốc | Tác phẩm được tạo bởi người tải lên This plot was created with Matplotlib. |
| Tác giả | Danmichaelo |
| Phiên bản khác | Version with Norwegian labels |
.png)
| Source |
|---|
#encoding=utf8import matplotlibfrom matplotlib import rcfrom matplotlib import pyplot as pltimport numpy as nprc('lines', linewidth=0.5)rc('font', family='sans-serif', size=10)rc('axes', labelsize=10)rc('xtick', labelsize=9)rc('ytick', labelsize=9)golden_mean = (np.sqrt(5)-1.0)/2.0inches_per_cm = 1.0/2.54fig_width = 8 * inches_per_cmfig_height = golden_mean * fig_widthfig = plt.figure(figsize = [fig_width, fig_height])from colorpy import ciexyz, colormodelsFs = 2.16e-5 * np.pi; # Geometrical factor of sun as viewed from Earthh = 6.63e-34; # Boltzmann const. [Js]c = 3.e8; # speed of light [m/s]q = 1.602e-19; # electron charge [C]def blackbody(wvlgth, temp): # per nanometer 1e-9: fac = (2 * Fs * h * c**2) / ((wvlgth * 1.e-9)**5) return fac / (np.exp(1240./(wvlgth*8.62e-5*temp)) - 1) * 1.e-9def draw_vis_spec(ax, ymax): spectrum = ciexyz.empty_spectrum()[:,0] (num_wl,) = spectrum.shape rgb_colors = np.empty((num_wl, 3)) for i in xrange (0, num_wl): xyz = ciexyz.xyz_from_wavelength(spectrum[i]) rgb = colormodels.rgb_from_xyz(xyz) rgb_colors [i] = rgb rgb_colors /= np.max(rgb_colors) # scale to make brightest rgb value = 1.0 num_points = len(spectrum) for i in xrange (0, num_points-1): x0 = spectrum[i] x1 = spectrum[i+1] y0 = 0.0 y1 = ymax poly_x = [x0, x1, x1, x0] poly_y = [y0, y0, y1, y1] color_string = colormodels.irgb_string_from_rgb(rgb_colors [i]) ax.fill(poly_x, poly_y, color_string, edgecolor=color_string)ax = fig.add_subplot(111)frame = ax.get_frame()frame.set_facecolor('black')xmax = 2000ymax = 2.5# Visible spectrum:draw_vis_spec(ax, ymax)# Blackbody:temp = 5777x = np.arange(100, 2000)y = blackbody(x, temp)y[-1] = 0.ax.fill(x, y, '0.5', alpha = 0.7, linewidth = 0.9, edgecolor='yellow', label = 'Black body\n%d K' % temp)# AM0 spectrum:d = np.loadtxt('smarts295.ext.txt', skiprows = 1)x = d[:,0]y = d[:,1]y[0] = 0.y[-1] = 0.ax.plot(x, y, color='white', linewidth=0.5, label = 'AM0')ax.set_xlim(0, xmax)ax.set_xticks(np.arange(0, 1999, 300))ax.set_ylim(0, ymax)# Tweak, tweak and annotate:texty = 2.25ax.annotate('UV', xy = (50,texty), xytext = (230,texty), xycoords = 'data', horizontalalignment='left', verticalalignment='center', color='#33bb33', arrowprops = dict(arrowstyle='->', color='#33bb33'))#ax.annotate('Synlig', xy=(400,texty), xycoords='data', # horizontalalignment='left', verticalalignment='center', color='white')ax.annotate(u'Infrared', xytext = (720,texty), xy = (1900,texty), xycoords = 'data', horizontalalignment='left', verticalalignment='center', color='#33bb33', arrowprops = dict(arrowstyle='->',color='#33bb33'))leg = ax.legend(loc='upper right', frameon=False, bbox_to_anchor = (1.0, 0.90) )txts = leg.get_texts()for txt in txts: txt.set_color('white') txt.set_fontsize(9)ax.tick_params(color='white', labelcolor='black')for spine in ax.spines.values(): spine.set_edgecolor('white') spine.set_linewidth(1.4)fig.subplots_adjust(left=0.16, bottom = 0.19, right=0.98, top=0.96)ax.set_xlabel(u'Wavelength [nm]')ax.set_ylabel(u'Irradiance [W/m$^2$/nm]')fig.savefig('Solar AM0 spectrum with visible spectrum background (en).png',dpi=600) |
Giấy phép
| Tôi, người giữ bản quyền của tác phẩm này, chuyển tác phẩm này vào phạm vi công cộng. Điều này có giá trị trên toàn thế giới. Tại một quốc gia mà luật pháp không cho phép điều này, thì: Tôi cho phép tất cả mọi người được quyền sử dụng tác phẩm này với bất cứ mục đích nào, không kèm theo bất kỳ điều kiện nào, trừ phi luật pháp yêu cầu những điều kiện đó. |
Lịch sử tập tin
Nhấn vào ngày/giờ để xem nội dung tập tin tại thời điểm đó.
| Ngày/giờ | Hình xem trước | Kích cỡ | Thành viên | Miêu tả | |
|---|---|---|---|---|---|
| hiện tại | 20:32, ngày 16 tháng 5 năm 2012 | | 1.882×1.162 (181 kB) | Danmichaelo |
Trang sử dụng tập tin
Có 1 trang tại Wikipedia tiếng Việt có liên kết đến tập tin (không hiển thị trang ở các dự án khác):
Đặc tính hình
.png)
🔥 Top keywords: Đài Truyền hình Kỹ thuật số VTCTrang ChínhGiỗ Tổ Hùng VươngTrương Mỹ LanĐặc biệt:Tìm kiếmHùng VươngVương Đình HuệUEFA Champions LeagueKuwaitChiến dịch Điện Biên PhủFacebookĐài Truyền hình Việt NamTrần Cẩm TúĐội tuyển bóng đá quốc gia KuwaitGoogle DịchViệt NamCúp bóng đá U-23 châu ÁCúp bóng đá U-23 châu Á 2024Real Madrid CFBảng xếp hạng bóng đá nam FIFACleopatra VIITô LâmTim CookNguyễn Phú TrọngHồ Chí MinhHai Bà TrưngManchester City F.C.VnExpressChủ tịch nước Cộng hòa xã hội chủ nghĩa Việt NamNguyễn Ngọc ThắngĐền HùngCúp bóng đá trong nhà châu Á 2024Võ Văn ThưởngOne PieceLịch sử Việt NamCuộc đua xe đạp toàn quốc tranh Cúp truyền hình Thành phố Hồ Chí Minh 2024Phạm Minh ChínhTikTokĐinh Tiên Hoàng