
1973-75_recession.jpg (484×292 điểm ảnh, kích thước tập tin: 23 kB, kiểu MIME: image/jpeg)
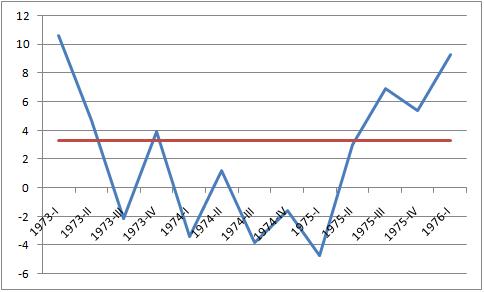
| Miêu tả1973-75 recession.jpg | English: A graph of the recession in the United States from 1973-75.
| |||
| Ngày | ||||
| Nguồn gốc | Tác phẩm được tạo bởi người tải lên | |||
| Tác giả | JayHenry | |||
| Giấy phép (Dùng lại tập tin) |
|
 | Hình ảnh thuộc thể loại "graph" cần được vẽ lại bằng đồ họa vector theo định dạng tập tin SVG. Để biết ưu điểm của định dạng này, hãy đọc Commons:Media for cleanup. Nếu tập tin này đã có SVG, xin hãy tải lên đây rồi thay bản mẫu này bằng {{vector version available|tên hình mới.svg}}. |
 | This graph image was uploaded in the JPEG format even though it consists of non-photographic data. This information could be stored more efficiently or accurately in the PNG or SVG format. If possible, please upload a PNG or SVG version of this image without compression artifacts, derived from a non-JPEG source (or with existing artifacts removed). After doing so, please tag the JPEG version with {{Superseded|NewImage.ext}} and remove this tag. This tag should not be applied to photographs or scans. If this image is a diagram or other image suitable for vectorisation, please tag this image with {{Convert to SVG}} instead of {{BadJPEG}}. If not suitable for vectorisation, use {{Convert to PNG}}. For more information, see {{BadJPEG}}. |  |
| Public domainPublic domainfalsefalse |
| Tôi, người giữ bản quyền của tác phẩm này, chuyển tác phẩm này vào phạm vi công cộng. Điều này có giá trị trên toàn thế giới. Tại một quốc gia mà luật pháp không cho phép điều này, thì: Tôi cho phép tất cả mọi người được quyền sử dụng tác phẩm này với bất cứ mục đích nào, không kèm theo bất kỳ điều kiện nào, trừ phi luật pháp yêu cầu những điều kiện đó. |
Nhấn vào ngày/giờ để xem nội dung tập tin tại thời điểm đó.
| Ngày/giờ | Hình xem trước | Kích cỡ | Thành viên | Miêu tả | |
|---|---|---|---|---|---|
| hiện tại | 03:26, ngày 27 tháng 7 năm 2009 | | 484×292 (23 kB) | JayHenry | {{Information |Description={{en|1=A graph of the recession in the United States from 1973-75. *Blue line is Percent Change From Preceding Period in Real Gross Domestic Product (annualized; seasonally adjusted) * Red line is Average GDP growth 1947–2009 |
Những wiki sau đang sử dụng tập tin này: