The 1913–14 season was the 26th season of The Football League.
| Season | 1913–14 |
|---|---|
| Champions | Blackburn Rovers |
← 1912–13 1914–15 → | |
Final league tables
Beginning in the 1894–95 season, clubs finishing level on points were separated according to goal average (goals scored divided by goals conceded). In case one or more teams had the same goal difference, this system favoured those teams who had scored fewer goals. The goal average system was eventually scrapped beginning with the 1976–77 season.
During the first six seasons of the league, (up to the 1893–94 season), re-election process concerned the clubs which finished in the bottom four of the league. From the 1894–95 season and until the 1920–21 season the re-election process was required of the clubs which finished in the bottom three of the league.
First Division
| Season | 1913–14 |
|---|---|
| Champions | Blackburn Rovers 2nd English title |
| Relegated | Preston North End Derby County |
| Matches played | 380 |
| Goals scored | 1,103 (2.9 per match) |
| Top goalscorer | George Elliott (32 goals)[1] |
| Biggest home win | Blackburn Rovers 6–0 Middlesbrough (20 September 1913) Blackburn Rovers 6–0 Everton (8 November 1913) Middlesbrough 6–0 Tottenham Hotspur (13 April 1914) |
| Biggest away win | Everton 1–5 Sunderland (15 November 1913) Preston North End 1–5 Blackburn Rovers (26 December 1913) |
| Highest scoring | Blackburn Rovers 6–2 Liverpool (6 September 1913) Bolton Wanderers 6–2 Oldham Athletic (6 September 1913) Derby County 3–5 Sheffield United (6 September 1913) The Wednesday 2–6 Burnley (3 January 1914) |
← 1912–13 1914–15 → | |
| Pos | Team | Pld | W | D | L | GF | GA | GAv | Pts | Relegation |
|---|---|---|---|---|---|---|---|---|---|---|
| 1 | Blackburn Rovers (C) | 38 | 20 | 11 | 7 | 78 | 42 | 1.857 | 51 | |
| 2 | Aston Villa | 38 | 19 | 6 | 13 | 65 | 50 | 1.300 | 44 | |
| 3 | Middlesbrough | 38 | 19 | 5 | 14 | 77 | 60 | 1.283 | 43 | |
| 4 | Oldham Athletic | 38 | 17 | 9 | 12 | 55 | 45 | 1.222 | 43 | |
| 5 | West Bromwich Albion | 38 | 15 | 13 | 10 | 46 | 42 | 1.095 | 43 | |
| 6 | Bolton Wanderers | 38 | 16 | 10 | 12 | 65 | 52 | 1.250 | 42 | |
| 7 | Sunderland | 38 | 17 | 6 | 15 | 63 | 52 | 1.212 | 40 | |
| 8 | Chelsea | 38 | 16 | 7 | 15 | 46 | 55 | 0.836 | 39 | |
| 9 | Bradford City | 38 | 12 | 14 | 12 | 40 | 40 | 1.000 | 38 | |
| 10 | Sheffield United | 38 | 16 | 5 | 17 | 63 | 60 | 1.050 | 37 | |
| 11 | Newcastle United | 38 | 13 | 11 | 14 | 39 | 48 | 0.813 | 37 | |
| 12 | Burnley | 38 | 12 | 12 | 14 | 61 | 53 | 1.151 | 36 | |
| 13 | Manchester City | 38 | 14 | 8 | 16 | 51 | 53 | 0.962 | 36 | |
| 14 | Manchester United | 38 | 15 | 6 | 17 | 52 | 62 | 0.839 | 36 | |
| 15 | Everton | 38 | 12 | 11 | 15 | 46 | 55 | 0.836 | 35 | |
| 16 | Liverpool | 38 | 14 | 7 | 17 | 46 | 62 | 0.742 | 35 | |
| 17 | Tottenham Hotspur | 38 | 12 | 10 | 16 | 50 | 62 | 0.806 | 34 | |
| 18 | The Wednesday | 38 | 13 | 8 | 17 | 53 | 70 | 0.757 | 34 | |
| 19 | Preston North End (R) | 38 | 12 | 6 | 20 | 52 | 69 | 0.754 | 30 | Relegation to the Second Division |
| 20 | Derby County (R) | 38 | 8 | 11 | 19 | 55 | 71 | 0.775 | 27 |
Source: World Football
Rules for classification: 1) Points; 2) Goal average; 3) Goals scored
(C) Champions; (R) Relegated
Rules for classification: 1) Points; 2) Goal average; 3) Goals scored
(C) Champions; (R) Relegated
Results
Maps
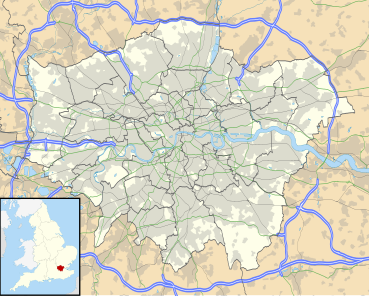
Locations of the Football League First Division London teams
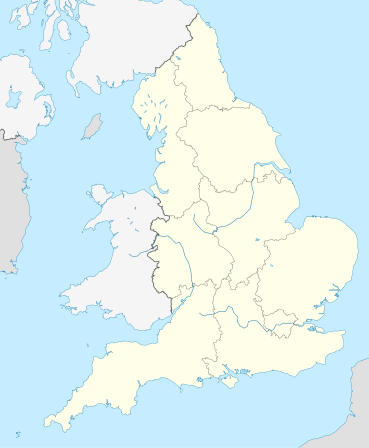
Locations of the Football League First Division teams
Second Division
| Season | 1913–14 |
|---|---|
| Champions | Notts County (2nd title) |
| Failed re-election | (none) |
| Matches played | 380 |
| Goals scored | 1,011 (2.66 per match) |
| Top goalscorer | Sammy Stevens (Hull City), 28 Jack Peart (Notts County), 28[1] |
| Biggest home win | Leeds City – Nottingham Forest 8–0 (29 Nov 1913) |
| Biggest away win | Fulham – Bradford Park Avenue 1–6 (21 Feb 1914) |
| Highest scoring | Hull City – Wolverhampton Wanderers 7–1 (6 Dec 1914) |
← 1912–13 1914–15 → | |
| Pos | Team | Pld | HW | HD | HL | HGF | HGA | AW | AD | AL | AGF | AGA | GAv | Pts | Promotion or relegation |
|---|---|---|---|---|---|---|---|---|---|---|---|---|---|---|---|
| 1 | Notts County | 38 | 16 | 2 | 1 | 55 | 13 | 7 | 5 | 7 | 22 | 23 | 2.139 | 53 | Division Champions |
| 2 | Bradford Park Avenue | 38 | 15 | 1 | 3 | 44 | 20 | 8 | 2 | 9 | 27 | 27 | 1.511 | 49 | Promoted |
| 3 | Woolwich Arsenal | 38 | 14 | 3 | 2 | 34 | 10 | 6 | 6 | 7 | 20 | 28 | 1.421 | 49 | |
| 4 | Leeds City | 38 | 15 | 2 | 2 | 54 | 16 | 5 | 5 | 9 | 22 | 30 | 1.652 | 47 | |
| 5 | Barnsley | 38 | 14 | 1 | 4 | 33 | 15 | 5 | 6 | 8 | 18 | 30 | 1.133 | 45 | |
| 6 | Clapton Orient | 38 | 14 | 5 | 0 | 38 | 11 | 2 | 6 | 11 | 9 | 24 | 1.343 | 43 | |
| 7 | Hull City | 38 | 9 | 5 | 5 | 29 | 13 | 7 | 4 | 8 | 24 | 24 | 1.432 | 41 | |
| 8 | Bristol City | 38 | 12 | 5 | 2 | 32 | 10 | 4 | 4 | 11 | 20 | 40 | 1.040 | 41 | |
| 9 | Wolverhampton Wanderers | 38 | 14 | 1 | 4 | 33 | 16 | 4 | 4 | 11 | 18 | 36 | 0.981 | 41 | |
| 10 | Bury | 38 | 12 | 6 | 1 | 30 | 14 | 3 | 4 | 12 | 9 | 26 | 0.975 | 40 | |
| 11 | Fulham | 38 | 10 | 3 | 6 | 31 | 20 | 6 | 3 | 10 | 15 | 23 | 1.070 | 38 | |
| 12 | Stockport County | 38 | 9 | 6 | 4 | 32 | 18 | 4 | 4 | 11 | 23 | 39 | 0.965 | 36 | |
| 13 | Huddersfield Town | 38 | 8 | 4 | 7 | 28 | 22 | 5 | 4 | 10 | 19 | 31 | 0.887 | 34 | |
| 14 | Birmingham | 38 | 10 | 4 | 5 | 31 | 18 | 2 | 6 | 11 | 17 | 42 | 0.800 | 34 | |
| 15 | Grimsby Town | 38 | 10 | 4 | 5 | 24 | 15 | 3 | 4 | 12 | 18 | 43 | 0.724 | 34 | |
| 16 | Blackpool | 38 | 6 | 10 | 3 | 24 | 19 | 3 | 4 | 12 | 9 | 25 | 0.750 | 32 | |
| 17 | Glossop | 38 | 8 | 3 | 8 | 32 | 24 | 3 | 3 | 13 | 19 | 43 | 0.761 | 28 | |
| 18 | Leicester Fosse | 38 | 7 | 2 | 10 | 29 | 28 | 4 | 2 | 13 | 16 | 33 | 0.738 | 26 | Re-elected |
| 19 | Lincoln City | 38 | 8 | 5 | 6 | 23 | 23 | 2 | 1 | 16 | 13 | 43 | 0.545 | 26 | |
| 20 | Nottingham Forest | 38 | 7 | 7 | 5 | 27 | 23 | 0 | 2 | 17 | 10 | 53 | 0.487 | 23 |
Source: [citation needed]
Results
Maps
Locations of the Football League Second Division London teams
See also
References
- Ian Laschke: Rothmans Book of Football League Records 1888–89 to 1978–79. Macdonald and Jane's, London & Sydney, 1980.
🔥 Top keywords: Main PageSpecial:SearchIndian Premier LeagueWikipedia:Featured picturesPornhubUEFA Champions League2024 Indian Premier LeagueFallout (American TV series)Jontay PorterXXXTentacionAmar Singh ChamkilaFallout (series)Cloud seedingReal Madrid CFCleopatraRama NavamiRichard GaddDeaths in 2024Civil War (film)Shōgun (2024 miniseries)2024 Indian general electionJennifer PanO. J. SimpsonElla PurnellBaby ReindeerCaitlin ClarkLaverne CoxXXX (film series)Facebook2023–24 UEFA Champions LeagueYouTubeCandidates Tournament 2024InstagramList of European Cup and UEFA Champions League finalsJude BellinghamMichael Porter Jr.Andriy LuninCarlo AncelottiBade Miyan Chote Miyan (2024 film)


