Demographic features of the population of Kiribati include population density, ethnicity, education level, health of the populace, economic status, religious affiliations and other aspects of the population.
| Demographics of Kiribati | |
|---|---|
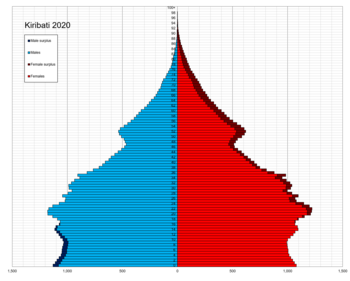
 Kiribati population pyramid in 2020 | |
| Population | 128,874 (2021) |
Population
| Rank | Name | Island | Pop. | ||||||
|---|---|---|---|---|---|---|---|---|---|
 Betio  Bikenibeu | 1 | Betio | South Tarawa | 18,565 |  Teaoraereke  Bairiki | ||||
| 2 | Bikenibeu | South Tarawa | 7,547 | ||||||
| 3 | Teaoraereke | South Tarawa | 6,073 | ||||||
| 4 | Bairiki | South Tarawa | 3,500 | ||||||
| 5 | Temwaiku | South Tarawa | 5,504 | ||||||
| 6 | Eita | South Tarawa | 3,921 | ||||||
| 7 | Tabwakea | Kiritimati | 3,537 | ||||||
| 8 | Bonriki | South Tarawa | 3,075 | ||||||
| 9 | Ambo | South Tarawa | 3,373 | ||||||
| 10 | London | Kiritimati | 1,970 | ||||||
Structure of the population
Population by Sex and Age Group (Census 07.XI.2015): [3]
| Age Group | Male | Female | Total | % |
|---|---|---|---|---|
| Total | 54 096 | 56 040 | 110 136 | 100 |
| 0–4 | 7 546 | 6 847 | 14 393 | 13.07 |
| 5–9 | 6 903 | 6 697 | 13 600 | 12.35 |
| 10–14 | 5 309 | 5 136 | 10 445 | 9.48 |
| 15–19 | 5 851 | 5 825 | 11 676 | 10.60 |
| 20–24 | 5 199 | 5 120 | 10 319 | 9.37 |
| 25–29 | 4 682 | 4 990 | 9 672 | 8.78 |
| 30–34 | 3 838 | 4 174 | 8 012 | 7.27 |
| 35–39 | 3 161 | 3 423 | 6 584 | 5.98 |
| 40–44 | 2 433 | 2 658 | 5 091 | 4.62 |
| 45–49 | 2 676 | 3 031 | 5 707 | 5.18 |
| 50–54 | 2 372 | 2 533 | 4 905 | 4.45 |
| 55–59 | 1 548 | 1 773 | 3 321 | 3.02 |
| 60–64 | 1 051 | 1 355 | 2 406 | 2.18 |
| 65-69 | 731 | 1 017 | 1 748 | 1.59 |
| 70-74 | 460 | 778 | 1 238 | 1.12 |
| 75-79 | 217 | 391 | 608 | 0.55 |
| 80-84 | 80 | 187 | 267 | 0.24 |
| 85-89 | 30 | 79 | 109 | 0.10 |
| 90-94 | 7 | 17 | 24 | 0.02 |
| 95-99 | 2 | 9 | 11 | 0.01 |
| 100+ | 0 | 0 | 0 | 0 |
| Age group | Male | Female | Total | Percent |
| 0–14 | 19 758 | 18 680 | 38 438 | 34.90 |
| 15–64 | 32 811 | 34 882 | 67 693 | 61.46 |
| 65+ | 1 527 | 2 478 | 4 005 | 3.64 |
Population by Sex and Age Group (Census 07.XI.2020) (Provisional): [3]
| Age Group | Male | Female | Total | % |
|---|---|---|---|---|
| Total | 59 154 | 60 786 | 119 940 | 100 |
| 0–4 | 7 965 | 7 422 | 15 387 | 12.83 |
| 5–9 | 7 517 | 6 895 | 14 412 | 12.02 |
| 10–14 | 6 701 | 6 598 | 13 299 | 11.09 |
| 15–19 | 5 368 | 5 022 | 10 390 | 8.66 |
| 20–24 | 5 629 | 5 520 | 11 149 | 9.30 |
| 25–29 | 4 993 | 5 113 | 10 106 | 8.43 |
| 30–34 | 4 511 | 4 776 | 9 287 | 7.74 |
| 35–39 | 3 791 | 4 086 | 7 877 | 6.57 |
| 40–44 | 2 997 | 3 145 | 6 142 | 5.12 |
| 45–49 | 2 311 | 2 555 | 4 866 | 4.06 |
| 50–54 | 2 413 | 2 802 | 5 215 | 4.35 |
| 55–59 | 1 861 | 2 289 | 4 150 | 3.46 |
| 60–64 | 1 386 | 1 679 | 3 065 | 2.56 |
| 65+ | 1 711 | 2 884 | 4 595 | 3.83 |
| Age group | Male | Female | Total | Percent |
| 0–14 | 22 183 | 20 915 | 43 098 | 35.93 |
| 15–64 | 35 260 | 36 987 | 72 247 | 60.24 |
| 65+ | 1 711 | 2 884 | 4 595 | 3.83 |
Statistics
| Year | Pop. | ±% |
|---|---|---|
| 1921 | 26,430 | — |
| 1931 | 29,751 | +12.6% |
| 1947 | 31,513 | +5.9% |
| 1963 | 43,336 | +37.5% |
| 1973 | 51,926 | +19.8% |
| 1978 | 56,213 | +8.3% |
| 1985 | 63,883 | +13.6% |
| 1990 | 72,335 | +13.2% |
| 1995 | 77,658 | +7.4% |
| 2000 | 84,494 | +8.8% |
| 2005 | 92,533 | +9.5% |
| 2010 | 103,058 | +11.4% |
| 2015 | 110,136 | +6.9% |
| 2020 | 119,940 | +8.9% |
| Source: [4][5] | ||

The following demographic statistics are from the CIA World Factbook, unless otherwise indicated.[6]
Nationality
- Noun: I-Kiribati (singular and plural forms)
- Adjective: Kiribati or Gilbertese
Ethnic groups
- I-Kiribati 96.2%, 105,983
- Mixed/I-Kiribati 1.8% 1,974
- Tuvaluans 0.2% 198
- Others 1.8% 1,981 (2015 census)
Religions
- Roman Catholic: 57.3%
- Kiribati Uniting Church: 31.3%[7]
- Latter-day Saints: 5.3%
- Baháʼí: 2.1%
- Seventh-day Adventist: 1.9%
- Other: 2.1% (2015 est.)
Languages
- English (official)
- Gilbertese (official)
Population
- 110,136 (2015 Census)
- 119,940 (2020 Census)
Age structure
- 0–14 years: 28.47% (male 16,223, female 15,604)
- 15–24 years: 20.24% (male 11,171, female 11,459)
- 25–54 years: 40.05% (male 21,530, female 23,249)
- 55–64 years: 6.65% (male 3,350, female 4,084)
- 65 years and over: 4.59% (male 2,004, female 3,122) (2015 est.)
From 2015 Census:
- 0–5 years: 17,466
- 6–14 years: 20,962
- 15–17 years: 7,089
- 18–49 years: 49,972
- + 50 years: 14,637
Median age
- Average: 23.9 years
- Male: 23.1 years
- Female: 24.8 years (2015 est.)
Population growth rate
- 1.09% (2020 est.)
Birth rate
- 20.5 births/1,000 population (2020 est.)
Death rate
- 6.9 deaths/1,000 population (2020 est.)
Net migration rate
- -2.8 migrant(s)/1,000 population (2020 est.)
Urbanization
- Urban population: 55.6% of Total population (2020)
- Rate of urbanization: 1.78% annual rate of change (2010—15 est.)
Sex ratio (male(s) to female)
- At birth: 1.05
- 0–14 years: 1.04
- 15–24 years: 0.97
- 25–54 years: 0.93
- 55–64 years: 0.82
- 65 years and over: 0.64
- Total population: 0.94 (2020 est.)
Maternal mortality rate
- 90 deaths/100,000 live births (2015 est.)
Infant mortality rate
- Total: 34.26 deaths/1,000 live births
- Male: 35.48 deaths/1,000 live births
- Female: 32.99 deaths/1,000 live births (2015 est.)
Life expectancy at birth
- Total population: 67.5 years
- Male: 65 years
- Female: 70.2 years (2020 est.)
Total fertility rate
- 2.25 children born/woman (2020 est.)
- 3.3 (2018–19) - Pacific community[8]
Health expenditure (% of GDP)
- 10.8% (2017)
Physicians density
- 0.2 physicians/1,000 population (2013)
Hospital bed density
- 1.9 beds/1,000 population (2015)
Obesity – adult prevalence rate
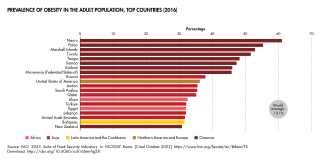
- 46% (2016)
School life expectancy
- Male: 11 years
- Female: 12 years (2015 est.)
References
![]() This article incorporates public domain material from The World Factbook. CIA.
This article incorporates public domain material from The World Factbook. CIA.
🔥 Top keywords: Main PageSpecial:SearchIndian Premier LeagueWikipedia:Featured picturesPornhubUEFA Champions League2024 Indian Premier LeagueFallout (American TV series)Jontay PorterXXXTentacionAmar Singh ChamkilaFallout (series)Cloud seedingReal Madrid CFCleopatraRama NavamiRichard GaddDeaths in 2024Civil War (film)Shōgun (2024 miniseries)2024 Indian general electionJennifer PanO. J. SimpsonElla PurnellBaby ReindeerCaitlin ClarkLaverne CoxXXX (film series)Facebook2023–24 UEFA Champions LeagueYouTubeCandidates Tournament 2024InstagramList of European Cup and UEFA Champions League finalsJude BellinghamMichael Porter Jr.Andriy LuninCarlo AncelottiBade Miyan Chote Miyan (2024 film)