Demographic features of the population of the Czech Republic include population density, ethnicity, education level, health of the populace, economic status, and religious affiliations.
| Demographics of the Czech Republic | |
|---|---|
 Czech Republic population pyramid in 2020 | |
| Population | |
| Growth rate | 0.004% (2020)[2] |
| Birth rate | |
| Death rate | |
| Life expectancy | 79.3 years (2020)[2] |
| • male | 76.3 years (2020)[2] |
| • female | 82.4 years (2020)[2] |
| Fertility rate | |
| Infant mortality rate | 2.6 deaths/1,000 live births (2020)[2] |
| Net migration rate | 2.3 migrant(s)/1,000 population (2020)[2] |
| Age structure | |
| 0–14 years | |
| 15–64 years | |
| 65 and over | |
| Sex ratio | |
| Total | 0.97 male(s)/female (2018)[4] |
| Nationality | |
| Nationality |
|
| Major ethnic | Czech 64.3% (2011)[2] [fn 1] |
| Minor ethnic |
|
| Language | |
| Official | Czech |
| Spoken |
|

Population
With an estimated population of 10,516,707 as of 2022, compared to 9.3 million at the beginning of the 20th century, the population growth of the Czech Republic has been limited, due to low fertility rates and loss of population in and around World Wars I and II. Population loss during World War I was approximately 350,000. At the beginning of World War II the population of the Czech Republic reached its maximum (11.2 million). Due to the expulsion of the German residents after World War II, the Czech Republic lost about 3 million inhabitants and in 1947 the population was only 8.8 million. Population growth resumed, and in 1994 the population was 10.33 million.
From 1994 to 2003 natural growth was slightly negative (−0.15% per year) and the population decreased to 10.2 million. Since 2005, natural growth has been positive, but in recent times the most important influence on the population of the Czech Republic has been immigration: approximately 300,000 during the 2010s.
- One birth every 5 minutes
- One death every 5 minutes
- One net migrant every 44 minutes
- Net gain of one person every 131 minutes
Total population
|
|
| ||||||||||||||||||||||||||||||||||||||||||||||||||||||||||||||||||||||||||||||
| Since 1869, the data come from the censuses. Source: Czech Demographic Handbook [6] | ||||||||||||||||||||||||||||||||||||||||||||||||||||||||||||||||||||||||||||||||
Life expectancy
- total population: 79.5 years. Country comparison to the world: 56th
- male: 76.55 years
- female: 82.61 years (2021 est.)
Death rate
- 10.72 deaths/1,000 population (2021 est.) Country comparison to the world: 23rd
Average life expectancy at age 0 of the total population.[7]


| Period | Life expectancy in years |
|---|---|
| 1950–1955 | 66.86 |
| 1955–1960 | |
| 1960–1965 | |
| 1965–1970 | |
| 1970–1975 | |
| 1975–1980 | |
| 1980–1985 | |
| 1985–1990 | |
| 1990–1995 | |
| 1995–2000 | |
| 2000–2005 | |
| 2005–2010 | |
| 2010–2015 |
| 2.4|}
Fertility

| 1.9 – 2.1 1.7 – 1.9 1.5 – 1.7 1.4 – 1.5 1.3 – 1.4 < 1.3 |
Population density and urban areas
| Name | Population (2021)[9] | Area (km²) | Region |
|---|---|---|---|
| Prague | 1,335,084 | 496 | Prague |
| Brno | 382,405 | 230 | South Moravian |
| Ostrava | 284,982 | 214 | Moravian-Silesian |
| Plzeň | 175,219 | 138 | Plzeň |
| Liberec | 104,261 | 106 | Liberec |
| Olomouc | 100,514 | 103 | Olomouc |
Age structure
2020
0–14 years:15.17% (male 834,447 /female 789,328)
15–24 years:9.2% (male 508,329 /female 475,846)
25–54 years:43.29% (male 2,382,899 /female 2,249,774)
55–64 years:12.12% (male 636,357 /female 660,748)
65 years and over:20.23% (male 907,255 /female 1,257,515)
Median age
- total: 43.3 years. Country comparison to the world: 28th
- male: 42 years
- female: 44.7 years (2020 est.)
- Age structure over time
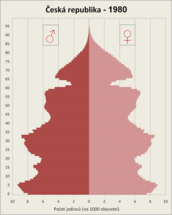 1980
1980 1990
1990 1999
1999 2007
2007


Vital statistics

Source: Czech Demographic Handbook[10]
| Average population (Mid-year) | Live births | Deaths | Natural change | Crude birth rate (per 1000) | Crude death rate (per 1000) | Natural change (per 1000) | Crude population change (per 1000) | Total fertility rates[11] | Migration change[12] | Induced abortions[13] | |
|---|---|---|---|---|---|---|---|---|---|---|---|
| 1900 | 9,333,853 | 335,441 | 231,190 | 104,251 | 35.4 | 24.4 | 11.1 | 4.85 | |||
| 1901 | 9,404,689 | 330,411 | 224,151 | 106,260 | 34.6 | 23.5 | 11.2 | 7.5 | 4.76 | ||
| 1902 | 9,474,876 | 338,746 | 225,686 | 113,060 | 35.2 | 23.5 | 11.8 | 7.4 | 4.68 | ||
| 1903 | 9,545,134 | 323,257 | 221,682 | 101,575 | 33.3 | 22.9 | 10.6 | 7.4 | 4.6 | ||
| 1904 | 9,615,027 | 324,295 | 225,817 | 98,478 | 33.2 | 23.1 | 10.2 | 7.3 | 4.52 | ||
| 1905 | 9,684,512 | 305,183 | 236,324 | 68,859 | 31.0 | 24.1 | 7.1 | 7.2 | 4.44 | ||
| 1906 | 9,745,475 | 318,287 | 206,380 | 111,907 | 32.1 | 20.8 | 11.4 | 6.3 | 4.36 | ||
| 1907 | 9,824,544 | 311,131 | 214,301 | 96,830 | 31.2 | 21.4 | 9.8 | 8.0 | 4.27 | ||
| 1908 | 9,894,520 | 313,417 | 213,207 | 100,210 | 31.2 | 21.2 | 10.1 | 7.1 | 4.19 | ||
| 1909 | 9,964,789 | 310,338 | 213,338 | 97,000 | 30.6 | 21.1 | 9.7 | 7.1 | 4.11 | ||
| 1910 | 10,035,575 | 300,362 | 199,961 | 100,401 | 29.5 | 19.6 | 9.9 | 7.1 | 4.03 | ||
| 1911 | 10,099,152 | 292,360 | 208,057 | 84,303 | 28.6 | 20.4 | 8.3 | 6.3 | 3.92 | ||
| 1912 | 10,157,344 | 283,527 | 205,165 | 78,362 | 27.6 | 20.0 | 7.7 | 5.7 | 3.82 | ||
| 1913 | 10,221,343 | 278,072 | 192,332 | 85,740 | 26.9 | 18.6 | 8.3 | 6.3 | 3.71 | ||
| 1914 | 10,283,486 | 257,265 | 181,981 | 75,284 | 26.2 | 18.4 | 7.6 | 6.0 | 3.6 | ||
| 1915 | 10,285,882 | 188,657 | 193,900 | -5,243 | 19.2 | 19.6 | -0.5 | 0.2 | 3.5 | ||
| 1916 | 10,221,815 | 132,818 | 179,796 | -46,978 | 13.7 | 18.2 | -4.8 | -6.3 | 3.39 | ||
| 1917 | 10,128,304 | 119,938 | 182,554 | -62,616 | 12.5 | 18.6 | -6.4 | -9.2 | 3.28 | ||
| 1918 | 10,004,335 | 113,489 | 227,729 | -114,240 | 12.1 | 23.6 | -11.9 | -12.4 | 3.18 | ||
| 1919 | 9,921,710 | 189,675 | 177,428 | 12,247 | 19.1 | 17.9 | 1.2 | -8.3 | 3.07 | ||
| 1920 | 9,978,420 | 244,668 | 176,562 | 68,106 | 24.5 | 17.7 | 6.8 | 5.7 | 2.964 | ||
| 1921 | 10,002,030 | 257,281 | 161,321 | 95,960 | 25.7 | 16.1 | 9.6 | 2.4 | 3.035 | ||
| 1922 | 10,112,730 | 248,728 | 163,366 | 85,362 | 24.6 | 16.2 | 8.4 | 10.9 | 2.882 | -14,842 | |
| 1923 | 10,198,370 | 241,230 | 142,335 | 98,895 | 23.7 | 14.0 | 9.7 | 8.4 | 2.768 | -10,930 | |
| 1924 | 10,277,770 | 228,894 | 146,098 | 82,796 | 22.3 | 14.2 | 8.1 | 7.7 | 2.590 | -7,856 | |
| 1925 | 10,369,760 | 225,555 | 146,450 | 79,105 | 21.8 | 14.1 | 7.6 | 8.9 | 2.484 | -8,720 | |
| 1926 | 10,442,610 | 219,802 | 148,298 | 71,504 | 21.0 | 14.2 | 6.8 | 7.0 | 2.392 | -6,488 | |
| 1927 | 10,495,940 | 208,711 | 155,479 | 53,232 | 19.9 | 14.8 | 5.1 | 5.1 | 2.237 | -5,501 | |
| 1928 | 10,549,221 | 208,942 | 147,064 | 61,878 | 19.8 | 13.9 | 5.9 | 5.1 | 2.209 | -6,634 | |
| 1929 | 10,597,761 | 203,064 | 155,493 | 47,571 | 19.2 | 14.7 | 4.5 | 4.6 | 2.124 | -5,440 | |
| 1930 | 10,648,057 | 207,224 | 142,159 | 65,065 | 19.5 | 13.4 | 6.1 | 4.7 | 2.149 | -4,948 | |
| 1931 | 10,702,208 | 196,214 | 144,534 | 51,680 | 18.3 | 13.5 | 4.8 | 5.1 | 2.026 | -3,105 | |
| 1932 | 10,750,003 | 190,397 | 142,997 | 47,400 | 17.7 | 13.3 | 4.4 | 4.4 | 1.966 | -1,246 | |
| 1933 | 10,791,313 | 176,201 | 140,906 | 35,295 | 16.3 | 13.1 | 3.3 | 3.8 | 1.826 | -211 | |
| 1934 | 10,826,082 | 171,042 | 135,914 | 35,128 | 15.8 | 12.6 | 3.2 | 3.2 | 1.774 | -1,069 | |
| 1935 | 10,853,125 | 161,748 | 140,878 | 20,870 | 14.9 | 13.0 | 1.9 | 2.5 | 1.678 | -1,044 | |
| 1936 | 10,872,519 | 157,992 | 139,093 | 18,899 | 14.5 | 12.8 | 1.7 | 1.8 | 1.664 | -1,538 | |
| 1937 | 10,888,540 | 155,996 | 139,558 | 16,438 | 14.3 | 12.8 | 1.5 | 1.5 | 1.690 | -2,997 | |
| 1938 | 10,877,442 | 163,525 | 143,115 | 20,410 | 15.0 | 13.2 | 1.9 | -1.9 | 1.847 | ||
| 1939 | 11,105,990 | 192,344 | 146,976 | 45,368 | 17.3 | 13.2 | 4.1 | 20.6 | 1.916 | ||
| 1940 | 11,159,539 | 218,043 | 153,499 | 64,544 | 19.5 | 13.8 | 5.8 | 4.8 | 2.195 | ||
| 1941 | 11,129,373 | 208,913 | 152,048 | 56,865 | 18.8 | 13.7 | 5.1 | -2.7 | 2.279 | ||
| 1942 | 11,054,018 | 199,259 | 153,096 | 46,163 | 18.0 | 13.8 | 4.2 | -6.8 | 2.422 | ||
| 1943 | 11,034,846 | 225,379 | 153,349 | 72,030 | 20.4 | 13.9 | 6.5 | -1.7 | 2.784 | ||
| 1944 | 11,109,341 | 230,183 | 161,457 | 68,726 | 20.7 | 14.5 | 6.2 | 6.7 | 2.796 | ||
| 1945 | 10,692,912 | 194,182 | 184,944 | 9,238 | 18.2 | 17.3 | 0.9 | -38.9 | 2.673 | ||
| 1946 | 9,523,266 | 210,454 | 134,568 | 75,886 | 22.1 | 14.1 | 8.0 | -122.8 | 3.254 | ||
| 1947 | 8,765,230 | 206,745 | 105,277 | 101,468 | 23.6 | 12.0 | 11.6 | -86.5 | 3.050 | 49,731 | |
| 1948 | 8,893,104 | 197,837 | 101,501 | 96,336 | 22.2 | 11.4 | 10.8 | 14.4 | 2.886 | 720 | |
| 1949 | 8,892,613 | 185,484 | 104,632 | 80,852 | 20.9 | 11.8 | 9.1 | -0.1 | 2.728 | 3,202 | |
| 1950 | 8,925,122 | 188,341 | 103,203 | 85,138 | 21.1 | 11.6 | 9.5 | 3.6 | 2.801 | 16,784 | |
| 1951 | 9,023,170 | 185,570 | 102,658 | 82,912 | 20.6 | 11.4 | 9.2 | 10.9 | 2.763 | 12,910 | |
| 1952 | 9,125,183 | 180,143 | 97,726 | 82,417 | 19.9 | 10.8 | 9.0 | 11.2 | 2.701 | 21,022 | |
| 1953 | 9,220,908 | 172,547 | 98,837 | 73,710 | 18.9 | 10.8 | 8.0 | 10.4 | 2.611 | 11,325 | |
| 1954 | 9,290,617 | 168,402 | 99,636 | 68,766 | 18.3 | 10.8 | 7.4 | 7.5 | 2.581 | -2,376 | |
| 1955 | 9,365,969 | 165,874 | 93,300 | 72,574 | 17.9 | 10.1 | 7.7 | 8.0 | 2.578 | 3,437 | |
| 1956 | 9,442,040 | 162,509 | 93,526 | 68,983 | 17.4 | 10.0 | 7.3 | 8.1 | 2.568 | 6,176 | |
| 1957 | 9,513,758 | 155,429 | 98,687 | 56,742 | 16.6 | 10.5 | 6.0 | 7.5 | 2.495 | 6,832 | |
| 1958 | 9,574,650 | 141,762 | 93,697 | 48,065 | 15.0 | 9.9 | 5.0 | 6.4 | 2.305 | 6,118 | 49,035 |
| 1959 | 9,618,554 | 128,982 | 97,159 | 31,823 | 13.6 | 10.3 | 3.3 | 4.6 | 2.121 | 8,054 | 61,914 |
| 1960 | 9,659,818 | 128,879 | 93,863 | 35,016 | 13.6 | 9.9 | 3.6 | 4.3 | 2.113 | 6,521 | 67,550 |
| 1961 | 9,588,016 | 131,019 | 94,973 | 36,046 | 13.7 | 9.9 | 3.8 | -7.5 | 2.133 | 4,911 | 70,062 |
| 1962 | 9,621,808 | 133,557 | 104,318 | 29,239 | 13.9 | 10.8 | 3.0 | 3.5 | 2.140 | 5,823 | 66,031 |
| 1963 | 9,668,741 | 148,840 | 100,129 | 48,711 | 15.4 | 10.4 | 5.0 | 4.9 | 2.332 | 8,277 | 51,470 |
| 1964 | 9,730,019 | 154,420 | 101,984 | 52,436 | 15.9 | 10.5 | 5.4 | 6.3 | 2.356 | 4,814 | 51,525 |
| 1965 | 9,785,102 | 147,438 | 105,108 | 42,330 | 15.1 | 10.7 | 4.3 | 5.6 | 2.178 | 3,528 | 58,554 |
| 1966 | 9,826,188 | 141,162 | 105,784 | 35,378 | 14.4 | 10.8 | 3.6 | 4.2 | 2.01 | 2,127 | 65,818 |
| 1967 | 9,854,241 | 138,448 | 108,967 | 29,481 | 14.1 | 11.1 | 3.0 | 2.8 | 1.90 | -3,267 | 69,850 |
| 1968 | 9,877,632 | 137,437 | 115,195 | 22,242 | 13.9 | 11.7 | 2.3 | 2.4 | 1.83 | -1,562 | 72,488 |
| 1969 | 9,896,695 | 143,165 | 120,653 | 22,512 | 14.5 | 12.2 | 2.3 | 1.9 | 1.86 | -2,724 | 74,263 |
| 1970 | 9,805,157 | 147,865 | 123,327 | 24,538 | 15.1 | 12.6 | 2.5 | -9.3 | 1.91 | -4,350 | 71,893 |
| 1971 | 9,830,602 | 154,180 | 122,375 | 31,805 | 15.7 | 12.5 | 3.2 | 2.6 | 1.98 | 2,490 | 68,652 |
| 1972 | 9,868,379 | 163,661 | 119,205 | 44,456 | 16.6 | 12.1 | 4.5 | 3.8 | 2.07 | 2,884 | 65,079 |
| 1973 | 9,919,519 | 181,750 | 124,437 | 57,313 | 18.3 | 12.5 | 5.8 | 5.2 | 2.29 | 4,615 | 55,898 |
| 1974 | 9,994,761 | 194,215 | 126,809 | 67,406 | 19.4 | 12.7 | 6.7 | 7.5 | 2.43 | 3,052 | 56,969 |
| 1975 | 10,062,366 | 191,776 | 124,314 | 67,462 | 19.1 | 12.4 | 6.7 | 6.7 | 2.40 | 2,401 | 55,511 |
| 1976 | 10,128,220 | 187,378 | 125,232 | 62,146 | 18.5 | 12.4 | 6.1 | 6.5 | 2.36 | 2,630 | 56,889 |
| 1977 | 10,189,312 | 181,763 | 126,214 | 55,549 | 17.8 | 12.4 | 5.5 | 6.0 | 2.32 | 1,307 | 61,114 |
| 1978 | 10,245,686 | 178,901 | 127,136 | 51,765 | 17.5 | 12.4 | 5.1 | 5.5 | 2.32 | 2,064 | 63,904 |
| 1979 | 10,296,489 | 172,112 | 127,949 | 44,163 | 16.7 | 12.4 | 4.3 | 4.9 | 2.29 | 2,494 | 64,505 |
| 1980 | 10,326,792 | 153,801 | 135,537 | 18,264 | 15.0 | 13.2 | 1.8 | 2.9 | 2.10 | 1,856 | 68,930 |
| 1981 | 10,303,208 | 144,438 | 130,407 | 14,031 | 14.0 | 12.7 | 1.4 | -2.3 | 2.02 | 1,717 | 71,574 |
| 1982 | 10,314,321 | 141,738 | 130,765 | 10,973 | 13.7 | 12.7 | 1.1 | 1.1 | 2.01 | 1,748 | 74,574 |
| 1983 | 10,322,823 | 137,431 | 134,474 | 2,957 | 13.3 | 13.0 | 0.3 | 0.8 | 1.96 | 2,383 | 75,037 |
| 1984 | 10,330,481 | 136,941 | 132,188 | 4,753 | 13.3 | 12.8 | 0.5 | 0.7 | 1.97 | 2,621 | 79,534 |
| 1985 | 10,336,742 | 135,881 | 131,641 | 4,240 | 13.1 | 12.7 | 0.4 | 0.6 | 1.96 | 2,195 | 83,042 |
| 1986 | 10,340,737 | 133,356 | 132,585 | 771 | 12.9 | 12.8 | 0.1 | 0.4 | 1.94 | 3,013 | 83,564 |
| 1987 | 10,348,834 | 130,921 | 127,244 | 3,677 | 12.7 | 12.3 | 0.4 | 0.8 | 1.91 | 2,721 | 109,626 |
| 1988 | 10,356,359 | 132,667 | 125,694 | 6,973 | 12.8 | 12.1 | 0.7 | 0.7 | 1.94 | 2,544 | 113,730 |
| 1989 | 10,362,257 | 128,356 | 127,747 | 609 | 12.4 | 12.3 | 0.1 | 0.6 | 1.87 | 1,459 | 111,683 |
| 1990 | 10,362,740 | 130,564 | 129,166 | 1,398 | 12.6 | 12.5 | 0.1 | 0 | 1.89 | 624 | 111,268 |
| 1991 | 10,308,682 | 129,354 | 124,290 | 5,064 | 12.5 | 12.1 | 0.5 | -5.2 | 1.86 | 2,876 | 106,042 |
| 1992 | 10,317,807 | 121,705 | 120,337 | 1,368 | 11.8 | 11.7 | 0.1 | 0.9 | 1.71 | 11,781 | 94,180 |
| 1993 | 10,330,607 | 121,025 | 118,185 | 2,840 | 11.7 | 11.4 | 0.3 | 1.2 | 1.67 | 5,476 | 70,634 |
| 1994 | 10,336,162 | 106,579 | 117,373 | -10,794 | 10.3 | 11.4 | -1.0 | 0.5 | 1.44 | 9,942 | 54,836 |
| 1995 | 10,330,759 | 96,097 | 117,913 | -21,816 | 9.3 | 11.4 | -2.1 | -0.5 | 1.28 | 9,999 | 49,531 |
| 1996 | 10,315,353 | 90,446 | 112,782 | -22,336 | 8.8 | 10.9 | -2.2 | -1.5 | 1.19 | 10,129 | 48,086 |
| 1997 | 10,303,642 | 90,657 | 112,744 | -22,087 | 8.8 | 10.9 | -2.1 | -1.1 | 1.17 | 12,075 | 45,022 |
| 1998 | 10,294,943 | 90,535 | 109,527 | -18,992 | 8.8 | 10.6 | -1.8 | -0.8 | 1.16 | 9,488 | 42,959 |
| 1999 | 10,282,784 | 89,471 | 109,768 | -20,297 | 8.7 | 10.7 | -2.0 | -1.2 | 1.13 | 8,774 | 39,382 |
| 2000 | 10,272,503 | 90,910 | 109,001 | -18,091 | 8.8 | 10.6 | -1.8 | -1.0 | 1.14 | 6,539 | 34,623 |
| 2001 | 10,224,192 | 90,715 | 107,755 | -17,040 | 8.9 | 10.5 | -1.7 | -4.7 | 1.14 | -8,551 | 32,528 |
| 2002 | 10,200,774 | 92,786 | 108,243 | -15,457 | 9.1 | 10.6 | -1.5 | -2.3 | 1.17 | 12,290 | 31,142 |
| 2003 | 10,201,651 | 93,685 | 111,288 | -17,603 | 9.2 | 10.9 | -1.7 | 0.1 | 1.18 | 25,789 | 29,298 |
| 2004 | 10,206,923 | 97,664 | 107,177 | -9,513 | 9.6 | 10.5 | -0.9 | 0.5 | 1.23 | 18,635 | 27,574 |
| 2005 | 10,234,092 | 102,211 | 107,938 | -5,727 | 10.0 | 10.5 | -0.6 | 2.7 | 1.28 | 36,229 | 26,453 |
| 2006 | 10,266,646 | 105,831 | 104,441 | 1,390 | 10.3 | 10.2 | 0.1 | 3.2 | 1.33 | 34,720 | 25,352 |
| 2007 | 10,322,689 | 114,632 | 104,636 | 9,996 | 11.1 | 10.1 | 1.0 | 5.4 | 1.44 | 83,945 | 25,414 |
| 2008 | 10,429,692 | 119,570 | 104,948 | 14,622 | 11.5 | 10.1 | 1.4 | 10.3 | 1.50 | 71,790 | 25,760 |
| 2009 | 10,491,492 | 118,348 | 107,421 | 10,927 | 11.3 | 10.2 | 1.0 | 5.9 | 1.49 | 28,344 | 24,636 |
| 2010 | 10,517,247 | 117,153 | 106,844 | 10,309 | 11.2 | 10.2 | 1.0 | 2.4 | 1.49 | 15,648 | 23,998 |
| 2011 | 10,496,672 | 108,673 | 106,848 | 1,825 | 10.4 | 10.2 | 0.2 | -2.0 | 1.43 | 16,889 | 24,055 |
| 2012 | 10,509,286 | 108,576 | 108,189 | 387 | 10.3 | 10.3 | 0.0 | 1.2 | 1.45 | 10,293 | 23,032 |
| 2013 | 10,510,719 | 106,751 | 109,160 | -2,409 | 10.2 | 10.4 | -0.2 | 0.1 | 1.46 | -1,297 | 22,714 |
| 2014 | 10,524,783 | 109,860 | 105,665 | 4,195 | 10.4 | 10.0 | 0.4 | 1.3 | 1.53 | 21,661 | 21,893 |
| 2015 | 10,542,942 | 110,764 | 111,173 | -409 | 10.5 | 10.5 | -0.0 | 1.7 | 1.57 | 15,977 | 20,403 |
| 2016 | 10,565,284 | 112,663 | 107,750 | 4,913 | 10.7 | 10.2 | 0.5 | 2.1 | 1.63 | 20,063 | 20,406 |
| 2017 | 10,589,526 | 114,405 | 111,443 | 2,962 | 10.8 | 10.5 | 0.3 | 2.3 | 1.69 | 28,273 | 19,415 |
| 2018 | 10,626,430 | 114,036 | 112,920 | 1,116 | 10.7 | 10.6 | 0.1 | 3.5 | 1.71 | 38,629 | 18,298 |
| 2019 | 10,669,324 | 112,231 | 112,362 | -131 | 10.5 | 10.5 | -0.0 | 4.0 | 1.71 | 44,270 | 17,751 |
| 2020 | 10,700,155 | 110,200 | 129,289 | -19,089 | 10.3 | 12.1 | -1.8 | 2.9 | 1.71 | 26,927 | 16,886 |
| 2021 | 10,500,850 | 111,793 | 139,891 | -28,098 | 10.6 | 13.3 | -2.7 | -19.0 | 1.83 | 49,969 | 15,492 |
| 2022 | 10,759,525 | 101,299 | 120,219 | -18,920 | 9.5 | 11.4 | -1.8 | 24.0 | 1.64 | 329,742 | 16,438 |
| 2023 | 10,878,042 | 91,149 | 112,795 | -21,646 | 8.4 | 10.4 | -2.0 | 11.0 | 94,672 |
Current vital statistics
| Period | Live births | Deaths | Natural increase |
|---|---|---|---|
| January – December 2022 | 101,299 | 120,219 | -18,920 |
| January – December 2023 | 91,149 | 112,795 | -21,646 |
| Difference |
- Deaths from January - February 2021 =
 30,031
 - Deaths from January - February 2022 =
 21,422
 - Deaths from January - February 2023 = 20,625
- Deaths from January - February 2024 = 20,147 [15]
Structure of the population
| Age Group | Male | Female | Total | % |
|---|---|---|---|---|
| Total | 5 168 799 | 5 363 971 | 10 532 770 | 100 |
| 0–4 | 296 944 | 282 591 | 579 535 | 5.50 |
| 5–9 | 249 218 | 235 846 | 485 064 | 4.61 |
| 10–14 | 233 025 | 220 518 | 453 543 | 4.31 |
| 15–19 | 298 949 | 283 701 | 582 650 | 5.53 |
| 20–24 | 355 493 | 336 516 | 692 009 | 6.57 |
| 25–29 | 386 426 | 360 070 | 746 496 | 7.09 |
| 30–34 | 461 410 | 434 976 | 896 386 | 8.51 |
| 35–39 | 456 642 | 432 290 | 888 932 | 8.44 |
| 40–44 | 361 605 | 343 287 | 704 892 | 6.69 |
| 45–49 | 354 342 | 342 339 | 696 681 | 6.61 |
| 50–54 | 336 194 | 336 351 | 672 545 | 6.39 |
| 55–59 | 367 638 | 386 703 | 754 341 | 7.16 |
| 60–64 | 352 692 | 391 178 | 743 870 | 7.06 |
| 65–69 | 249 700 | 302 420 | 552 120 | 5.24 |
| 70–74 | 163 508 | 220 319 | 383 827 | 3.64 |
| 75–79 | 122 317 | 191 050 | 313 367 | 2.98 |
| 80–84 | 79 882 | 152 084 | 231 966 | 2.20 |
| 85–89 | 34 877 | 86 898 | 121 775 | 1.16 |
| 90–94 | 6 453 | 19 431 | 25 884 | 0.25 |
| 95–99 | 1 277 | 4 727 | 6 004 | 0.06 |
| 100+ | 207 | 676 | 883 | <0.01 |
| Age group | Male | Female | Total | Percent |
| 0–14 | 779 187 | 738 955 | 1 518 142 | 14.41 |
| 15–64 | 3 731 391 | 3 647 411 | 7 378 802 | 70.06 |
| 65+ | 658 221 | 977 605 | 1 635 826 | 15.53 |
| Age Group | Male | Female | Total | % |
|---|---|---|---|---|
| Total | 5 275 103 | 5 426 674 | 10 701 777 | 100 |
| 0–4 | 290 444 | 276 818 | 567 262 | 5.30 |
| 5–9 | 285 498 | 271 459 | 556 957 | 5.20 |
| 10–14 | 304 995 | 290 527 | 595 522 | 5.56 |
| 15–19 | 252 007 | 238 443 | 490 450 | 4.58 |
| 20–24 | 245 786 | 232 124 | 477 910 | 4.47 |
| 25–29 | 320 181 | 300 744 | 620 925 | 5.80 |
| 30–34 | 370 523 | 348 408 | 718 931 | 6.72 |
| 35–39 | 389 652 | 363 658 | 753 310 | 7.04 |
| 40–44 | 460 462 | 432 859 | 893 321 | 8.35 |
| 45–49 | 452 969 | 429 617 | 882 586 | 8.25 |
| 50–54 | 352 166 | 338 917 | 691 083 | 6.46 |
| 55–59 | 336 205 | 333 528 | 669 733 | 6.26 |
| 60–64 | 304 764 | 320 701 | 625 465 | 5.84 |
| 65-69 | 313 014 | 359 404 | 672 418 | 6.28 |
| 70-74 | 274 177 | 347 000 | 621 177 | 5.80 |
| 75-79 | 170 104 | 247 097 | 417 201 | 3.90 |
| 80-84 | 90 188 | 153 949 | 244 137 | 2.28 |
| 85-89 | 44 759 | 93 731 | 138 490 | 1.29 |
| 90-94 | 14 784 | 39 027 | 53 811 | 0.50 |
| 95-99 | 2 177 | 8 066 | 10 243 | 0.10 |
| 100-104 | 221 | 530 | 751 | 0.01 |
| 105-109 | 27 | 67 | 94 | <0.01 |
| Age group | Male | Female | Total | Percent |
| 0–14 | 880 937 | 838 804 | 1 719 741 | 16.07 |
| 15–64 | 3 484 715 | 3 338 999 | 6 823 714 | 63.76 |
| 65+ | 909 451 | 1 248 871 | 2 158 322 | 20.17 |
Education
Literacy
definition: NA
- total population: 99%
- male: 99%
- female: 99% (2011 est.)
Employment and income
Unemployment, youth ages 15–24
- Total: 8%. Country comparison to the world: 155th
- Male: 7.2%
- Female: 9.2% (2020 est.)
Ethnic groups
The majority of the 10.5 million inhabitants of the Czech Republic are ethnically and linguistically Czech (95%). They are descendants of Slavic people from the Black Sea-Carpathian region who settled in Bohemia, Moravia and parts of present-day Austria in the 6th century AD. Other ethnic groups include Germans, Romani people, Poles, and Hungarians. Historical minorities like Germans and Poles are declining due to assimilation. There is also a growing community from Vietnam. Other ethnic communities like Greeks, Turks, Italians, and Yugoslavs are found in Prague. Since the dissolution of Czechoslovakia, Slovaks living in the Czech Republic have comprised roughly 3% of the population.
There are different groups of national and ethnic minorities in the Czech Republic. The only "old minority" is Poles in the Trans-Olza region, while the "new minorities" are scattered among the majority population (generally in the larger towns). While some of the minorities have the whole social structure of Czech society[clarification needed] (Poles, Slovaks, Greeks and Ukrainians), other represent only some of the social groups (i.e. Russian newcomers of middle class, and Romani people who generally represent the underclass).[17]
1880–1910
| Language | 1880 | 1890 | 1900 | 1910 |
|---|---|---|---|---|
| Czech | 62.5% | 62.4% | 62.4% | 62.9% |
| German | 35.8% | 35.6% | 35.1% | 34.6% |
| Polish | 1.0% | 1.2% | 1.6% | 1.6% |
| Other | 0.7% | 0.8% | 0.9% | 0.9% |
| Total population | 8,222,013 | 8,665,421 | 9,372,140 | 10,078,637 |
After World War I
| Ethnic group | census 1921 1 | census 1930 | census 1950 | census 1961 | census 1970 | census 1980 | census 1991 | census 2001 | census 2011[19] | census 2021 | ||||||||||
|---|---|---|---|---|---|---|---|---|---|---|---|---|---|---|---|---|---|---|---|---|
| Number | % | Number | % | Number | % | Number | % | Number | % | Number | % | Number | % | Number | % | Number | % | Number | % | |
| Czechs | 6,758,983 | 67.5 | 7,304,588 | 68.3 | 8,343,558 | 93.9 | 9,023,501 | 94.2 | 9,270,617 | 94.4 | 9,733,925 | 94.6 | 8,363,768 | 81.2 | 9,249,777 | 90.5 | 6,732,104 | 63.7 | 6,415,104 | 61.0 |
| Moravians | 1,362,313 | 13.2 | 380,474 | 3.7 | 522,474 | 4.9 | 556,641 | 5.3 | ||||||||||||
| Silesians | 44,446 | 0.4 | 10,878 | 0.1 | 12,231 | 0.1 | 31,301 | 0.3 | ||||||||||||
| Slovaks | 15,732 | 0.2 | 44,451 | 0.4 | 258,025 | 2.9 | 275,997 | 2.9 | 320,998 | 3.3 | 359,370 | 3.5 | 314,877 | 3.1 | 193,190 | 1.9 | 149,140 | 1.4 | 162,578 | 1.5 |
| Poles | 103,521 | 1.0 | 92,689 | 0.9 | 70,816 | 0.8 | 66,540 | 0.7 | 64,074 | 0.7 | 66,123 | 0.6 | 59,383 | 0.6 | 51,968 | 0.5 | 39,269 | 0.4 | 38,218 | 0.4 |
| Germans | 3,061,369 | 30.6 | 3,149,820 | 29.5 | 159,938 | 1.8 | 134,143 | 1.4 | 80,903 | 0.8 | 58,211 | 0.6 | 48,556 | 0.5 | 39,106 | 0.4 | 18,772 | 0.3 | 24,632 | 0.2 |
| Ukrainians | 13,343 | 0.1 | 22,657 | 0.2 | 19,384 | 0.2 | 19,549 | 0.2 | 9,794 | 0.1 | 10,271 | 0.1 | 8,220 | 0.1 | 22,112 | 0.2 | 53,603 | 0.5 | 92,892 | 0.9 |
| Rusyns | 1,926 | 0.0 | 1,106 | 0.0 | 739 | 0.0 | ||||||||||||||
| Russians | 6,619 | 0.1 | 5,051 | 0.0 | 5,062 | 0.0 | 12,369 | 0.1 | 18,021 | 0.2 | 34,506 | 0.3 | ||||||||
| Vietnamese | 421 | 0.0 | 17,462 | 0.2 | 29,825 | 0.3 | 38,723 | 0.4 | ||||||||||||
| Hungarians | 7,049 | 0.1 | 11,427 | 0.1 | 13,201 | 0.1 | 15,152 | 0.2 | 18,472 | 0.2 | 19,676 | 0.2 | 19,932 | 0.2 | 14,672 | 0.1 | 9,049 | 0.1 | ||
| Romani people[20] | 227 | 0.0 | 19,770 | 0.2 | 19,392 | 0.2 | 32,903 | 0.3 | 11,746 | 0.1 | 5,199 | 0.0 | 21,691 | 0.2 | ||||||
| Jews | 35,699 | 0.4 | 37,093 | 0.4 | 218 | 0.0 | 521 | 0.0 | ||||||||||||
| Yugoslavs | 4,749 | 0.0 | 3,957 | 0.0 | 3,386 | 0.0 | ||||||||||||||
| Romanians | 966 | 0.0 | 3,205 | 0.0 | 1,034 | 0.0 | 1,238 | 0.0 | 1,921 | 0.0 | ||||||||||
| Others/undeclared | 10,038 | 0.1 | 5,719 | 0.1 | 11,441 | 0.1 | 10,095 | 0.1 | 36,220 | 0.4 | 39,300 | 0.4 | 39,129 | 0.4 | 220,660 | 2.6 | 2,739,4881 | 26.0 | ||
| Total | 10,005,734 | 10,674,386 | 8,896,133 | 9,571,531 | 9,807,697 | 10,291,927 | 10,302,215 | 10,230,060 | 10,436,560 | 10,524,167 | ||||||||||
| 1 On the territory of the census date. | ||||||||||||||||||||
1 In 2011 a large part of the population did not claim any ethnicity, before the census it was widely mediatized that the question is not mandatory. The vast majority of those who did so are presumed to be ethnic Czechs, number of whom dropped by roughly the same amount that the number of undeclared people rose, circa 2.5 million.
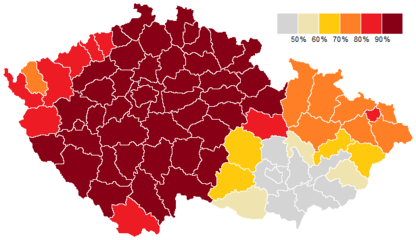 Czechs in 1991
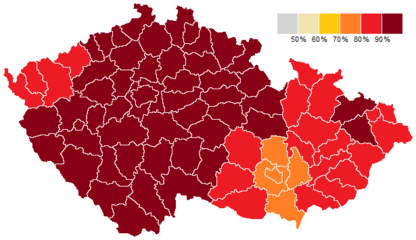 Czechs in 2001
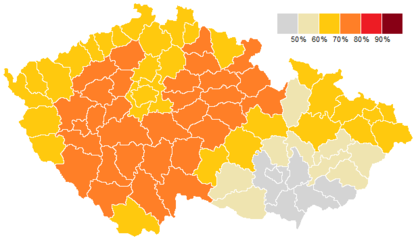 Czechs in 2011


The legal position of the minorities is defined foremost in the Act No. 273/2001 Coll. (The Rights of the Minorities Act) which implements the Charter of Fundamental Rights and Basic Freedoms, Framework Convention for the Protection of National Minorities and Recommendation of the Council of Europe No. 1201. There is a number of other enactments which to lesser extent deal with the minorities.
A special situation applies in the case of Moravians and Silesians, who are frequently allocated within the group of Czechs when it comes to the statistical data.
Officially recognized minorities
Minorities, which "traditionally and on a long term basis live within the territory of the Czech Republic" enjoy some privileges. As of 2022 there are 14 such officially recognized minorities, which are (alphabetically): Belarusians, Bulgarians, Croatians, Germans, Greeks, Hungarians, Poles, Romani people, Russians, Rusyns, Serbians, Slovaks, Ukrainians and Vietnamese.[21]
Citizens belonging to the officially recognized minorities enjoy the right to "use their language in communication with authorities and in courts of law". Article 25 of the Czech Charter of Fundamental Rights and Basic Freedoms provides the right of the national and ethnic minorities to education and communication with authorities in their own language. Act No. 500/2004 Coll. (The Administrative Rule) in its paragraph 16 (4) (Procedural Language) provides that a citizen of the Czech Republic who belongs to a national or an ethnic minority, which traditionally and on a long-term basis lives within the territory of the Czech Republic, has the right to address an administrative agency and proceed before it in the language of the minority. In the case that the administrative agency does not have an employee with knowledge of the language, the agency is bound to obtain a translator at the agency's own expense. According to Act No. 273/2001 (About The Rights of Members of Minorities) paragraph 9 (The right to use language of a national minority in dealing with authorities and in the courts of law) the same also applies to members of national minorities in the courts of law.
Bulgarians
The economic migration of Bulgarians to the Czech Republic began in the 1990s. 4,363 citizens claimed to have Bulgarian nationality in the 2001 census. They mostly live in the large cities and towns, such as Prague, Brno, Ostrava, Karlovy Vary, Kladno, Ústí nad Labem, Děčín, and Havířov. Nowadays the newcomers from Bulgaria aim for these areas in particular, where they can join an already established community. Many of these economic immigrants have dual citizenship of both the Czech Republic and Bulgaria. However most of the recent immigrants still only have Bulgarian citizenship.
The Bulgarian Cultural Organisation publishes the magazine Roden Glas, while a folklore organisation Kytka promotes traditional Bulgarian dances. Among other organisations are Pirin, Zaedno, Vazraždane and Hyshove.[22]
As an officially recognized minority the Bulgarian citizens of the Czech Republic enjoy the right to use their language in communication with authorities and in the courts of law. They also enjoy a number of other rights connected to the status of recognized minority, e.g. the right to education in their own language: the first Bulgarian school in the current Czech Republic was established in 1946 in Prague.
Germans

The German minority of the Czech Republic, historically the largest minority of the country, was almost entirely removed when 3 million were forcibly expelled in 1945–6 on the basis of the Potsdam agreement. The constitution guarantees rights for minority languages, however there are 13 municipalities with German minority constituting 10% of population, which qualifies for such provisions.[24] There is no bilingual education system in Western and Northern Bohemia, where the German minority is mostly concentrated. However, this is in large part due to the absence of German-speaking youth, a heritage of the post-war policy of the Communist government.
According to the 2001 census there remain 13 municipalities and settlements in the Czech Republic with more than 10% Germans.[24]
Many[citation needed] representatives of expellees' organizations support the erection of bilingual signs in all formerly German-speaking territory as a visible sign of the bilingual linguistic and cultural heritage of the region, but their efforts are not supported by some of the current inhabitants, as the vast majority of the current population is not of German descent.
The German-Czech Declaration of 21 January 1997 covered the two most critical issues—the role of some Sudeten Germans in the breakup of Czechoslovakia in 1938 and their expulsion after World War II.[25]
Greeks
Another influential minority are Greeks. Large numbers of Greeks arrived in Czechoslovakia during the end of the Greek Civil War. The first transports of Greek children arrived in 1948 and 1949. Later, more transports, also including adults, arrived.[26] They were partly leftists, communists and guerillas with their relatives, hence the willingness of Czechoslovak government to allow the immigration.[27] This was viewed rather as a temporary solution. After the defeat of DSE and other left-wing guerillas, the Greeks stayed in Czechoslovakia. In total more than 12,000 Greeks immigrated to Czechoslovakia between 1948 and 1950.[27] Today, there are about 7000 Greeks in the country (3219 according to 2001 census data),[27] mostly in the 3 biggest towns – Prague, Brno, Ostrava – and also in Bohumín, Havířov, Jeseník, Karviná, Krnov, Šumperk, Třinec, Vrbno pod Pradědem and Žamberk (apart from the last one these towns are in Silesia).[28]
Poles
The most concentrated linguistic minority in the Czech Republic are ethnic Poles, historically the plurality, today constituting about 10% of the population of Karviná and Frýdek-Místek districts. Poles have the right to use their language in official dealings; the public media (Czech TV and Czech Radio) regularly broadcast in Polish; and there are many Polish primary and secondary schools in the area. The Polish minority has been decreasing substantially since World War II as education in Polish was difficult to obtain, while Czech authorities did not permit bilingual signs to maintain Polish awareness among the population.
The erection of bilingual signs has technically been permitted since 2001, if a minority constitutes 10% of the population of a municipality. The requirement that a petition be signed by the members of minority was cancelled, thus simplifying the whole process.[29] Still, only a couple of villages with large Polish minorities have bilingual signs (Vendryně/Wędrynia for instance).
Romanis
Another minority is the Roma, who nonetheless have very little influence on Czech policy. Around 90% of the Roma that lived in the Czech Republic prior to World War II were exterminated by the Nazi Porajmos. The Roma there now are 80% post-war immigrants from Slovakia or Hungary, or the descendants thereof. In total, the Roma in the CR now number around 200,000.[30] There is Romani press in the CR, written in both Czech and Romani, but Romani radio is broadcast in Czech and there is no Romani television. Romani is also absent from legislative, judiciary, and other political texts but it has recently entered some university and elementary school courses. Life expectancy, literacy, median wage, school enrolment, and other socio-economic markers remain low while Roma compose the majority of prison and habitual offender populations despite accounting for only a fraction of a percent of Czech population.[31]
Immigration

According to the Czech Statistical Office as of 31 December 2020 there were 632,570 legal foreign residents in the Czech Republic (5.1% of the total population).[32] Residents from Ukraine are the largest group (165,356), followed by residents of Slovakia (124,544). There are also Asian immigrant communities in the Czech Republic. The largest is the Vietnamese one (62,842) followed by the Mongolians (10,135) and the Chinese (7,940). During the communist era the governments of Czechoslovakia and Vietnam had a deal concerning the education of Vietnamese people in Czechoslovakia. Vietnamese people came to Czechoslovakia for the first time in 1956 and then the number of new migrants grew until the fall of communism. First generation Vietnamese work mostly as small-scale businessmen in markets. Still, many Vietnamese are without Czech citizenship. One of the towns with the largest Vietnamese communities is Cheb. Other large immigrant groups come from Russia (41,692), Poland (20,733), Germany (20,861), Bulgaria (17,917) and Romania (18,396).
Recent trends
| Country | 2016 | 2017 | 2018 |
|---|---|---|---|
 Ukraine Ukraine | 5,778 | 10,340 | 16,747 |
 Slovakia Slovakia | 6,706 | 6,328 | 6,671 |
 Russia Russia | 2,404 | 2,891 | 3,388 |
 Vietnam Vietnam | 1,752 | 2,196 | 2,264 |
 Romania Romania | 1,648 | 1,829 | 2,184 |
 Bulgaria Bulgaria | 1,331 | 1,620 | 1,977 |
 Mongolia Mongolia | 709 | 1,165 | 1,498 |
 Hungary Hungary | 911 | 1,238 | 1,330 |
 Belarus Belarus | 421 | 657 | 1,145 |
 China China | 551 | 823 | 1,123 |
 United States United States | 1,063 | 1,073 | 1,101 |
 Serbia Serbia | 230 | 414 | 1,041 |
| Total | 37,503 | 45,957 | 58,148 |
Foreign-born population
| Nationality | Population (31 December 2023)[35] |
|---|---|
| Ukraine | 574,447 |
 Slovakia Slovakia | 119,182 |
| Vietnam | 67,783 |
| Russia | 40,990 |
| Romania | 20,469 |
| Bulgaria | 17,907 |
 Poland Poland | 17,837 |
 Germany Germany | 12,719 |
| Mongolia | 12,664 |
| Hungary | 11,117 |
| United States | 10,132 |
 Kazakhstan Kazakhstan | 9,798 |
 India India | 9,553 |
| China | 8,813 |
 United Kingdom United Kingdom | 7,905 |
| Belarus | 7,726 |
 Moldova Moldova | 7,662 |
 Philippines Philippines | 7,026 |
 Italy Italy | 6,125 |
| Serbia | 5,993 |
 Turkey Turkey | 5,340 |
 France France | 4,120 |
 Uzbekistan Uzbekistan | 3,448 |
 Croatia Croatia | 3,252 |
 South Korea South Korea | 2,915 |
 North Macedonia North Macedonia | 2,816 |
- See also
- Armenians in the Czech Republic
- Chinese people in the Czech Republic
- Croats in the Czech Republic
- Germans in the Czech Republic
- Greeks in the Czech Republic
- History of the Jews in the Czech Republic
- Koreans in the Czech Republic
- Macedonians in the Czech Republic
- Mongolians in the Czech Republic
- Polish minority in the Czech Republic
- Portuguese in the Czech Republic
- Romani people in the Czech Republic
- Slovaks in the Czech Republic
- Turks in the Czech Republic
- Ukrainians in the Czech Republic
- Vietnamese people in the Czech Republic
Languages

The Czech language (divided into three dialects in Bohemia, four dialects in Moravia, and two dialects in Czech Silesia) is the official language of the state. There is also the transitional Cieszyn Silesian dialect as well as the Polish language in Cieszyn Silesia, both spoken in Czech Silesia. Various Sudeten German dialects are currently practically extinct: present Czech Germans speak mainly Czech and/or Standard German. Czech Sign Language is the language of most of the deaf community.
For other languages spoken in the Czech Republic, see the above section on officially recognised minorities.
Religion

| 1991 | 2001 | 2011 | 2021 p | |||||
|---|---|---|---|---|---|---|---|---|
| number | % | number | % | number | % | number | % | |
| Roman Catholic Church | 4,021,385 | 39.0 | 2,740,780 | 26.8 | 1,082,463 | 10.4 | 741,019 | 7.0 |
| Evangelical Church of Czech Brethren | 203,996 | 2.0 | 117,212 | 1.1 | 51,858 | 0.5 | 32,577 | 0.3 |
| Czechoslovak Hussite Church | 178,036 | 1.7 | 99,103 | 1.0 | 39,229 | 0.4 | 23,610 | 0.2 |
| Believers identified with another specific religion | 120,317 | 1.7 | 330,993 | 3.2 | 290,034 | 2.8 | 577,079 | 5.5 |
| Believers not identified with any specific religion | 705,368 | 6.8 | 960,201 | 9.1 | ||||
| No religion | 4,112,864 | 39.9 | 6,039,991 | 59.0 | 3,612,804 | 34.2 | 5,024,416 | 47.7 |
| No response, unknown | 1,665,617 | 16.2 | 901,981 | 8.8 | 4,774,323 | 45.2 | 3,167,774 | 30.1 |
| Total population | 10,302,215 | 10,230,060 | 10,436,560 | 10,524,167 | ||||
The 2021 census did not contain list of religious organisations and they had to be written by the respondent (unlike in the previous ones). Therefore another 231 thousand people responded with catholicism or similar response, 71 thousand people identified simply with Christianity and 27 thousand people claimed to be protestants or evangelicals. Moreover, after doubling their followers the Orthodox Church of the Czech Lands and Slovakia was the 2nd strongest church in 2021 census with 40,681 faithful.
Almost half (45.2%) of the Czech population prefer not to respond to religious questions in the Census. Others claim to have no religion or that they are without religious affiliation (34.2%). In comparison, one in every five claims to have some personal belief (20.6%).
The largest denominations are Roman Catholicism, estimated at 10.3% of the population, Protestant (0.5%), Hussites (0.4%). Other organized religions, including non-organized believers, totalled about (9.4%) (as of Census 2011).
According to the Eurobarometer Poll 2005,[41] 19% of Czech citizens responded that "they believe there is a God", whereas 50% answered that "they believe there is some sort of spirit or life force" and 30% that "they do not believe there is any sort of spirit, god, or life force"; the percentage of believers is thus the lowest of EU countries after Estonia with 16%.[42]
See also
- Husák's Children – A generation of people born in Czechoslovakia during the baby boom which started in the early 1970s
Notes
References
External links
- Czech Statistical Office, state institution responsible to provide official data about Czech Republic
- Czechia – EU member country profile – European Union