The demography of England has since 1801 been measured by the decennial national census, and is marked by centuries of population growth and urbanization. Due to the lack of authoritative contemporary sources, estimates of the population of England for dates prior to the first census in 1801 vary considerably. The population of England at the 2021 census was about 56,489,800.[4]
| Demographics of England | |
|---|---|
 Population pyramid of England in 2021 | |
| Population | 56,489,800 |
| Density | 434/km2 (1,120/sq mi)[1] |
| Fertility rate | 1.61 (2021) |
| Age structure | |
| 0–14 years | 17.4% (2021)[2] |
| 15–64 years | 64.1% |
| 65 and over | 18.6% |
| Nationality | |
| Nationality | English (2021) |
| Major ethnic |
|
| Minor ethnic |
|
| Language | |
| Spoken | British English |

.png)
Population
The population of England in 2021 was estimated to be 56,489,800.[4][5] This is the most recent census.[4] In the previous census, in 2011, the population was 53,012,456.
Data for the 2021 census:
- Female: 28,833,712
- Male: 27,656,336
- Total population: 56,489,800 [6]
- Total Fertility Rate: 1.61 (2021)[7]
Historical population

| Year | Pop. | ±% |
|---|---|---|
| 5000BC | below 6000 | — |
| 3000BC | 100,000 | — |
| 1800BC | 300,000 | +200.0% |
| 100BC | 1,500,000 | +400.0% |
| Source: [8] | ||
| Year | Pop. | ±% |
|---|---|---|
| 1086 | 1,710,000 | — |
| 1190 | 3,100,000 | +81.3% |
| 1220 | 3,970,000 | +28.1% |
| 1250 | 4,230,000 | +6.5% |
| 1279 | 4,430,000 | +4.7% |
| 1290 | 4,750,000 | +7.2% |
| 1315 | 4,690,000 | −1.3% |
| 1325 | 4,120,000 | −12.2% |
| 1348 | 4,810,000 | +16.7% |
| 1351 | 2,600,000 | −45.9% |
| 1377 | 2,500,000 | −3.8% |
| 1400 | 2,080,000 | −16.8% |
| 1430 | 2,020,000 | −2.9% |
| 1450 | 1,900,000 | −5.9% |
| 1490 | 2,140,000 | +12.6% |
| 1522 | 2,350,000 | +9.8% |
| 1541 | 2,830,000 | +20.4% |
| 1560 | 3,200,000 | +13.1% |
| 1600 | 4,110,000 | +28.4% |
| 1650 | 5,310,000 | +29.2% |
| 1700 | 5,200,000 | −2.1% |
| Source: [9][10] | ||
| Year | Pop. | ±% |
|---|---|---|
| 1801 | 8,287,907 | — |
| 1811 | 9,405,342 | +13.5% |
| 1821 | 11,178,050 | +18.8% |
| 1831 | 12,976,329 | +16.1% |
| 1841 | 14,847,888 | +14.4% |
| 1851 | 16,738,495 | +12.7% |
| 1861 | 18,753,390 | +12.0% |
| 1871 | 21,361,235 | +13.9% |
| 1881 | 24,397,385 | +14.2% |
| 1891 | 27,231,229 | +11.6% |
| 1901 | 30,072,180 | +10.4% |
| 1911 | 33,561,235 | +11.6% |
| 1921 | 35,230,225 | +5.0% |
| 1931 | 37,359,045 | +6.0% |
| 1939 | 38,084,321 | +1.9% |
| 1951 | 41,164,356 | +8.1% |
| 1961 | 43,460,525 | +5.6% |
| 1971 | 46,411,700 | +6.8% |
| 1981 | 46,820,800 | +0.9% |
| 1991 | 47,875,000 | +2.3% |
| 2001 | 49,138,831 | +2.6% |
| 2011 | 53,012,456 | +7.9% |
| 2021 | 56,489,800 | +6.6% |
| Source: Year(s) 1801–2011[10][11][12][13] | ||
Vital statistics
[15] This is UK wide information.
| Average population | Live births | Deaths | Natural change | Crude birth rate (per 1000) | Crude death rate (per 1000) | Natural change (per 1000) | Fertility rates | |
|---|---|---|---|---|---|---|---|---|
| 1940 | 567,710 | 545,952 | 21,758 | 14.1 | 13.6 | 0.5 | ||
| 1941(c) | 539,205 | 499,343 | 39,862 | 13.9 | 12.9 | 1.0 | ||
| 1942 | 608,373 | 448,777 | 159,596 | 15.6 | 11.5 | 4.1 | ||
| 1943 | 641,064 | 469,916 | 171,148 | 16.2 | 11.9 | 4.3 | ||
| 1944 | 704,748 | 461,189 | 243,559 | 17.7 | 11.6 | 6.1 | ||
| 1945 | 638,422 | 456,216 | 182,206 | 15.9 | 11.4 | 4.5 | ||
| 1946 | 773,153 | 460,543 | 312,610 | 19.2 | 11.4 | 7.8 | ||
| 1947 | 829,863 | 484,324 | 345,539 | 20.5 | 12.0 | 8.5 | ||
| 1948 | 728,131 | 439,803 | 288,328 | 17.9 | 10.8 | 7.1 | ||
| 1949 | 686,181 | 478,627 | 207,554 | 16.8 | 11.7 | 5.1 | ||
| 1950 | 654,321 | 477,006 | 177,315 | 15.5 | 11.3 | 4.2 | ||
| 1951(c) | 41,164,356 | 636,259 | 513,375 | 122,884 | 15.5 | 12.5 | 3.0 | |
| 1952 | 632,347 | 466,479 | 165,858 | 15.3 | 11.3 | 4.0 | ||
| 1953 | 642,844 | 472,137 | 170,707 | 15.5 | 11.3 | 4.2 | ||
| 1954 | 633,395 | 469,074 | 164,321 | 15.2 | 11.3 | 3.9 | ||
| 1955 | 628,935 | 484,926 | 144,009 | 15.0 | 11.7 | 3.3 | ||
| 1956 | 659,420 | 488,893 | 170,527 | 15.7 | 11.7 | 4.0 | ||
| 1957 | 681,736 | 482,174 | 199,562 | 16.1 | 11.5 | 4.6 | ||
| 1958 | 698,255 | 494,201 | 204,054 | 16.4 | 11.7 | 4.7 | ||
| 1959 | 706,239 | 495,517 | 210,722 | 16.5 | 11.6 | 4.9 | ||
| 1960 | 740,858 | 493,553 | 247,305 | 17.1 | 11.5 | 5.6 | ||
| 1961(c) | 43,460,525 | 766,358 | 518,047 | 248,311 | 17.6 | 11.9 | 5.7 | |
| 1962 | 793,354 | 523,855 | 269,499 | 18.0 | 12.0 | 6.0 | ||
| 1963 | 807,017 | 538,105 | 268,912 | 18.2 | 12.2 | 6.0 | ||
| 1964 | 828,470 | 501,991 | 326,479 | 18.5 | 11.3 | 7.2 | ||
| 1965 | 816,433 | 516,317 | 300,116 | 18.1 | 11.5 | 6.6 | ||
| 1966 | 804,957 | 528,981 | 275,976 | 17.7 | 11.8 | 5.9 | ||
| 1967 | 788,458 | 509,356 | 279,102 | 17.2 | 11.2 | 6.0 | ||
| 1968 | 775,065 | 541,862 | 233,203 | 16.9 | 11.9 | 5.0 | ||
| 1969 | 754,456 | 543,425 | 211,031 | 16.4 | 11.9 | 4.5 | ||
| 1970 | 741,999 | 540,196 | 201,803 | 16.0 | 11.6 | 4.4 | ||
| 1971(c) | 46,411,700 | 740,099 | 532,445 | 207,654 | 15.9 | 11.5 | 4.4 | |
| 1972 | 46,572,000 | 685,485 | 554,251 | 131,234 | 14.7 | 11.9 | 2.8 | |
| 1973 | 46,686,000 | 638,356 | 549,876 | 88,480 | 13.7 | 11.8 | 1.9 | |
| 1974 | 46,682,000 | 603,153 | 547,980 | 55,173 | 12.9 | 11.7 | 1.2 | |
| 1975 | 46,674,000 | 568,900 | 545,444 | 23,456 | 12.2 | 11.7 | 0.5 | |
| 1976 | 46,659,000 | 550,383 | 560,317 | -9,934 | 11.8 | 12.0 | -0.2 | |
| 1977 | 46,639,000 | 536,953 | 538,652 | -1,699 | 11.5 | 11.5 | -0.0 | |
| 1978 | 46,638,000 | 562,589 | 547,685 | 14,904 | 12.1 | 11.7 | 0.4 | |
| 1979 | 46,698,000 | 601,316 | 554,840 | 46,476 | 12.9 | 11.9 | 1.0 | |
| 1980 | 46,787,000 | 618,371 | 544,349 | 74,022 | 13.2 | 11.6 | 1.6 | |
| 1981(c) | 46,820,800 | 598,163 | 541,018 | 57,145 | 12.8 | 11.6 | 1.2 | |
| 1982 | 46,777,000 | 589,711 | 544,984 | 44,727 | 12.6 | 11.7 | 0.9 | 1.76 |
| 1983 | 46,813,000 | 593,255 | 542,509 | 50,746 | 12.7 | 11.6 | 1.1 | 1.75 |
| 1984 | 46,912,000 | 600,573 | 531,314 | 69,259 | 12.8 | 11.3 | 1.5 | 1.75 |
| 1985 | 47,057,000 | 619,301 | 553,153 | 66,148 | 13.2 | 11.8 | 1.4 | 1.78 |
| 1986 | 47,187,000 | 623,609 | 544,545 | 79,064 | 13.2 | 11.5 | 1.7 | 1.76 |
| 1987 | 47,300,000 | 643,330 | 531,150 | 112,180 | 13.6 | 11.2 | 2.4 | 1.80 |
| 1988 | 47,412,000 | 654,353 | 535,553 | 118,800 | 13.8 | 11.3 | 2.5 | 1.82 |
| 1989 | 47,552,000 | 649,357 | 539,804 | 109,553 | 13.7 | 11.4 | 2.3 | 1.79 |
| 1990 | 47,699,000 | 666,920 | 528,920 | 138,000 | 14.0 | 11.1 | 3.9 | 1.83 |
| 1991(c) | 47,875,000 | 660,806 | 533,980 | 126,826 | 13.8 | 11.2 | 2.6 | 1.81 |
| 1992 | 47,998,000 | 651,784 | 522,660 | 129,124 | 13.6 | 10.9 | 2.7 | 1.79 |
| 1993 | 48,102,000 | 636,473 | 540,904 | 95,569 | 13.2 | 11.2 | 2.0 | 1.76 |
| 1994 | 48,228,000 | 628,956 | 516,297 | 112,659 | 13.0 | 10.7 | 2.3 | 1.75 |
| 1995 | 48,383,000 | 613,257 | 529,038 | 84,219 | 12.7 | 10.9 | 1.8 | 1.71 |
| 1996 | 48,519,000 | 614,184 | 526,650 | 87,534 | 12.7 | 10.9 | 1.8 | 1.73 |
| 1997 | 48,664,000 | 608,202 | 521,598 | 86,604 | 12.5 | 10.7 | 1.8 | 1.73 |
| 1998 | 48,820,000 | 602,111 | 518,089 | 84,022 | 12.3 | 10.6 | 1.7 | 1.72 |
| 1999 | 49,032,000 | 589,468 | 517,119 | 72,349 | 12.0 | 10.5 | 1.5 | 1.69 |
| 2000 | 49,233,000 | 572,826 | 503,026 | 69,800 | 11.6 | 10.2 | 1.4 | 1.65 |
| 2001(c) | 49,449,000 | 563,744 | 497,878 | 65,866 | 11.4 | 10.1 | 1.3 | 1.63 |
| 2002 | 49,679,000 | 565,709 | 500,792 | 64,917 | 11.4 | 10.1 | 1.3 | 1.64 |
| 2003 | 49,925,000 | 589,851 | 504,127 | 85,724 | 11.8 | 10.1 | 1.7 | 1.72 |
| 2004 | 50,194,000 | 607,184 | 480,717 | 126,467 | 12.1 | 9.6 | 2.5 | 1.77 |
| 2005 | 50,606,000 | 613,028 | 479,678 | 133,350 | 12.1 | 9.5 | 2.6 | 1.77 |
| 2006 | 50,965,000 | 635,748 | 470,326 | 165,422 | 12.5 | 9.2 | 3.3 | 1.83 |
| 2007 | 51,381,000 | 655,357 | 470,721 | 184,636 | 12.8 | 9.2 | 3.6 | 1.88 |
| 2008 | 51,815,000 | 672,809 | 475,763 | 197,046 | 13.0 | 9.2 | 3.8 | 1.92 |
| 2009 | 52,196,000 | 671,058 | 459,241 | 211,817 | 12.9 | 8.8 | 4.1 | 1.91 |
| 2010 | 52,642,000 | 687,007 | 461,017 | 225,990 | 13.1 | 8.8 | 4.3 | 1.94 |
| 2011(c) | 53,107,000 | 688,120 | 452,862 | 235,258 | 13.0 | 8.5 | 4.5 | 1.93 |
| 2012 | 53,493,000 | 694,241 | 466,779 | 227,462 | 13.0 | 8.7 | 4.3 | 1.94 |
| 2013 | 53,865,000 | 664,517 | 473,552 | 190,965 | 12.3 | 8.8 | 3.5 | 1.85 |
| 2014 | 54,316,000 | 661,496 | 468,875 | 192,621 | 12.2 | 8.6 | 3.6 | 1.83 |
| 2015 | 54,786,000 | 664,399 | 495,309 | 169,090 | 12.1 | 9.0 | 3.1 | 1.82 |
| 2016 | 55,268,000 | 663,157 | 490,454 | 172,703 | 12.0 | 8.9 | 3.1 | 1.81 |
| 2017 | 55,619,000 | 646,794 | 498,882 | 147,912 | 11.6 | 9.0 | 2.6 | 1.76 |
| 2018 | 55,977,000 | 625,651 | 505,859 | 119,792 | 11.2 | 9.0 | 2.2 | 1.70 |
| 2019 | 56,287,000 | 610,505 | 488,952 | 121,553 | 10.8 | 8.7 | 2.1 | 1.66 |
| 2020 | 56,550,000 | 585,195 | 569,700 | 15,495 | 10.3 | 10.1 | 0.3 | 1.59 |
| 2021(c) | 56,489,800 | 595,948 | 549,207 | 46,741 | 10.5 | 9.7 | 0.8 | 1.56 |
| 2022 | 57,106,398 | 577,046 | 540,333 | 36,713 | 10.2 | 9.5 | 0.7 | 1.49 |
| 2023 | 544,032 |
(c) = Census results.
In 2022, the percentage of live births where either one or both parents were born outside of the UK was 36.7%. 31.1% of all live births in England were to mothers born outside of the UK (9.8% born in the EU, 21.3% born outside of the EU).[16]
Current vital statistics
| Period | Live births | Deaths | Natural increase |
|---|---|---|---|
| January - March 2022 | 160,486 | ||
| January - March 2023 | 145,046 | ||
| Difference |
Historical per cent distribution of the total population by age
| Ages | 1901 | 1931 | 1951 | 1961 |
|---|---|---|---|---|
| 0–14 years | 32 | 24 | 22 | 23 |
| 15–64 years | 63 | 69 | 67 | 65 |
| 65 years and over | 5 | 7 | 11 | 12 |
| Total (%) | 100 | 100 | 100 | 100 |
Country of birth
Country of birth given by respondents in the corresponding UK censuses were as follows:

| Country of birth | 1971[19] | 1981[20] | 1991[21] | 2001[22] | 2011[23] | 2021[24] | ||||||
|---|---|---|---|---|---|---|---|---|---|---|---|---|
| Number | % | Number | % | Number | % | Number | % | Number | % | Number | % | |
 United Kingdom United Kingdom | 41,951,042 | 91.3% | 42,620,882 | 93.1% | 43,506,411 | 92.5% | 44,588,008 | 90.74% | 45,675,317 | 86.16% | 46,687,017 | 82.6% |
 England England | 40,374,714 | 87.9% | 41,084,399 | 89.8% | 42,003,211 | 89.3% | 42,968,596 | 87.44% | 44,246,592 | 83.46% | 45,388,724 | 80.3% |
 Scotland Scotland | 716,499 | 731,412 | 743,856 | 794,577 | 1.62% | 708,872 | 1.34% | 626,443 | 1.1% | |||
 Wales Wales | 632,548 | 573,014 | 545,381 | 609,711 | 1.24% | 506,619 | 0.96% | 478,697 | ||||
| Northern Ireland | 227,281 | – | – | 211,133 | 215,124 | 0.44% | 206,735 | 0.39% | 190,541 | |||
| United Kingdom (not otherwise specified) | – | – | 232,057 | 2,830 | 6,499 | 0.01% | 2,612 | |||||
| Europe (non-UK) | 1,217,245 | 2.7% | 1,142,182 | 2.4% | 1,221,759 | 2.6% | 1,154,707 | 2.3% | 2,375,441 | 4.5% | 4,042,538 | 7.1% |
 Ireland Ireland | 647,429 | 567,021 | 555,805 | 459,662 | 0.94% | 395,182 | 0.75% | 314,674 | 0.6% | |||
| Channel Islands & Isle of Man | – | – | – | – | 26,804 | |||||||
| Total born in all EU Member Countries (excluding Ireland) | 569,816[note 1] | 1.2% | 340,113 | 0% | 452,092 | 1% | 695,045 | 1.41% | 1,980,259 | 3.73% | 3,236,799 | 5.7% |
| EU Member Countries (joined pre 2001) or EEC Members | – | – | 340,113 | 452,092 | 1% | – | – | 894,908 | 1.69% | 1,263,707 | 2.2% | |
 Germany Germany | – | – | – | – | 193,346 | |||||||
 France France | – | – | – | – | 49,947 | |||||||
 Italy Italy | – | – | – | – | 83,724 | |||||||
| Other | – | – | – | – | 125,075 | |||||||
| Other EU Member Countries (joined post-2001) | – | – | – | – | – | – | – | – | 1,085,351 | 2.04% | 1,973,092 | 3.5% |
 Poland Poland | – | – | – | – | 68,049 | 0.1% | ||||||
 Romania Romania | – | – | – | – | 3,762 | – | ||||||
| Other non-EU Europe | – | – | 235,048 | 0.5% | 115,247 | 0.2% | – | – | – | – | 491,065 | 0.9% |
 Soviet Union Soviet Union | – | – | – | – | 25,235 | |||||||
| Other | – | – | – | – | 90,012 | |||||||
| Africa | 148,473 | 0.3% | 278,678 | 0.6% | 456,396 | 1% | – | – | – | – | 1,558,199 | 2.8% |
| Middle East and Asia | 522,263 | 1.1% | 727,838 | 1.6% | 1,108,529 | 2.4% | – | – | – | – | 3,241,701 | 5.7% |
 India India | 301,862 | 378,721 | 395,563 | |||||||||
 Pakistan Pakistan | 131,826 | 179,712 | 221,776 | |||||||||
 Bangladesh Bangladesh | 46,873 | 101,829 | ||||||||||
| Sri Lanka (also known as Ceylon) | 15,366 | – | – | – | – | |||||||
| Far East | 73,209 | 122,532 | – | – | ||||||||
 Turkey Turkey | – | – | – | – | 26,016 | |||||||
| Other | – | – | – | – | 363,345 | |||||||
| Americas and Caribbean | 292,966 | 0.6% | 291,679 | 0.6% | 481,299 | 1% | – | – | – | – | 790,002 | 1.4% |
 Canada Canada | – | – | – | – | 53,195 | |||||||
 United States United States | – | – | – | – | 128,337 | |||||||
 Jamaica Jamaica | – | – | – | – | 141,352 | |||||||
| Other | – | – | – | – | 158,415 | |||||||
| Antarctica and Oceania | – | – | – | – | 104,141 | 0.2% | 170,023 | 0.3% | ||||
 Australia Australia | – | – | – | – | 66,279 | – | – | – | – | – | – | |
 New Zealand New Zealand | – | – | – | – | 37,862 | |||||||
| Other: Old Commonwealth[note 2] | 119,683 | 0.3% | 133,220 | 0.3% | – | – | – | – | – | – | – | – |
| Other: New Commonwealth[note 3] | 109,971 | 0.2% | 155,389 | 0.3% | 147,602 | 0.3% | – | – | – | – | – | – |
| Other Countries (non Europe or UK for 2001 and 2011) | 482,351 | 1% | 421,895 | 0.9% | 3,051 | – | 3,396,116 | 6.91% | 4,961,698 | 9.36% | 83 | – |
| Total | 45,917,667 | 100% | 45,771,763 | 100% | 47,055,204 | 100% | 49,138,831 | 100.00% | 53,012,456 | 100.00% | 56,490,051 | 100% |
Below are the estimates of the largest foreign-born groups in England according to ONS estimates.
| Country of birth | 2013 | 2014[25] | 2015 | 2018[26] |
|---|---|---|---|---|
| India | 698,000 | 748,000 | 751,000 | 832,000 |
| Poland | 561,000 | 677,000 | 713,000 | 832,000 |
| Pakistan | 479,000 | 499,000 | 478,000 | 535,000 |
| Republic of Ireland | 315,000 | 317,000 | 318,000 | 369,000 |
| Germany | 263,000 | 267,000 | 253,000 | 309,000 |

Age
The data below is based on the 2011 census.[27] In 2001, the mean age of England's population was 38.60, and the median age was 37.00. In 2022, the median age was 40.5.[28]
| Ages attained (years) | Population | % of total population | % per year of age band |
|---|---|---|---|
| 0–4 | 3,318,449 | 6.26 | 1.25 |
| 5–9 | 2,972,632 | 5.61 | 1.12 |
| 10–14 | 3,080,929 | 5.81 | 1.16 |
| 15–19 | 3,340,265 | 6.30 | 1.26 |
| 20–24 | 3,595,321 | 6.78 | 1.36 |
| 25–29 | 3,650,881 | 6.89 | 1.38 |
| 30–34 | 3,509,221 | 6.62 | 1.32 |
| 35–39 | 3,549,116 | 6.69 | 1.34 |
| 40–44 | 3,885,934 | 7.33 | 1.47 |
| 45–49 | 3,879,815 | 7.32 | 1.46 |
| 50–54 | 3,400,095 | 6.41 | 1.28 |
| 55–59 | 2,996,992 | 5.65 | 1.13 |
| 60–64 | 3,172,277 | 5.98 | 1.20 |
| 65–69 | 2,508,154 | 4.73 | 0.95 |
| 70–74 | 2,044,129 | 3.86 | 0.77 |
| 75–79 | 1,669,345 | 3.15 | 0.63 |
| 80–84 | 1,258,773 | 2.37 | 0.47 |
| 85–89 | 776,311 | 1.46 | 0.29 |
| 90+ | 403,817 | 0.76 | – |
- Population pyramids of the regions of England
 South West
 South East
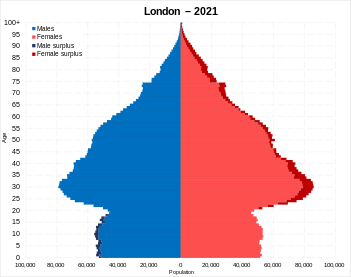 Greater London
 East of England
 East Midlands
 West Midlands
 Yorkshire and the Humber
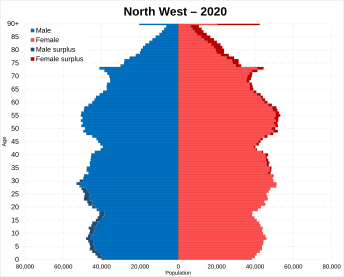 North West
 North East


Ethnicity


| Ethnic group (reported as 'Area of origin') | 1951[note 4] | 1961[note 4] | 1966 | mid-1968 | ||||||
|---|---|---|---|---|---|---|---|---|---|---|
| Estimates based solely off of immigrant population[note 4] | Total estimated (including estimates of those born in the UK)[note 5] | |||||||||
| Population | % | Population | % | Population | % | Population | % | Population | % | |
| White: Total | 43,683,500 | 99.83% | 45,769,000 | 99.28% | 46,540,500 | 98.73% | 46,211,500 | 98.04% | – | – |
| Non-White: Total | 74,500 | 0.17% | 336,000 | 0.72% | 595,000 | 1.27% | 924,000 | 1.96% | 1,123,000 | – |
| India | 30,800 | 81,400 | 163,600 | 223,000 | – | – | ||||
| Pakistan | 5,000 | 24,900 | 67,700 | 199,700 | – | – | ||||
| Ceylon (Sri Lanka) | 5,800 | 9,000 | 12,900 | 16,100 | – | – | ||||
| West Indies | 15,300 | 171,800 | 267,900 | – | – | – | – | |||
| Jamaica | – | – | – | – | – | – | 278,000 | – | – | |
| Other Caribbean | – | – | – | – | – | – | 180,300 | – | – | |
| British West Africa (Gambia, Ghana, Nigeria and Sierra Leone) | 5,600 | 19,800 | 36,000 | 50,700 | – | – | ||||
| Far East (Hong Kong, Malaya, Singapore) | 12,000 | 29,600 | 47,000 | 60,000 | – | – | ||||
| Total population | 43,758,000 | 100% | 46,105,000 | 100% | 47,135,500 | 100% | 47,135,500 | 100% | – | – |
| Ethnic group | Year | |||||||||
|---|---|---|---|---|---|---|---|---|---|---|
| 1981 estimations[30] | 1991[31][note 6] | 2001[32] | 2011[33] | 2021[34] | ||||||
| Population | % | Population | % | Population | % | Population | % | Population | % | |
| White: Total | – | 95.4% | 44,144,339 | 93.8% | 44,679,361 | 91% | 45,281,142 | 85.4% | 45,783,401 | 81% |
| White: British | – | – | – | – | 42,747,136 | 87.0% | 42,279,236 | 79.8% | 41,540,791 | 73.5% |
| White: Irish | – | – | – | – | 624,115 | 1.3% | 517,001 | 1.0% | 494,251 | 0.9% |
| White: Irish Traveller/White Gypsy | – | – | – | – | – | – | 54,895 | 0.1% | 64,218 | 0.1% |
| White: Roma | – | – | – | – | – | – | – | – | 99,138 | 0.2% |
| White: Other | – | – | – | – | 1,308,110 | 2.7% | 2,430,010 | 4.6% | 3,585,003 | 6.3% |
| Asian or Asian British: Total | – | 2.65% | 1,762,262 | 3.7% | 2,468,970 | 5% | 4,143,403 | 7.8% | 5,426,392 | 9.7% |
| Asian or Asian British: Indian | – | 1.32% | 823,821 | 1.8% | 1,028,546 | 2.1% | 1,395,702 | 2.6% | 1,843,248 | 3.3% |
| Asian or Asian British: Pakistani | – | 0.7% | 449,646 | 1.0% | 706,539 | 1.4% | 1,112,282 | 2.1% | 1,570,285 | 2.8% |
| Asian or Asian British: Bangladeshi | – | 0.18% | 157,881 | 0.3% | 275,394 | 0.6% | 436,514 | 0.8% | 629,567 | 1.1% |
| Asian or Asian British: Chinese[note 7] | – | 0.22% | 141,661 | 0.3% | 220,681 | 0.5% | 379,502 | 0.7% | 431,165 | 0.8% |
| Asian or Asian British: Asian Other | – | 0.23% | 189,253 | 0.4% | 237,810 | 0.5% | 819,403 | 1.6% | 952,127 | 1.7% |
| Black or Black British: Total | – | 1.5% | 874,882 | 1.9% | 1,132,508 | 2.3% | 1,846,614 | 3.5% | 2,381,724 | 4.2% |
| Black or Black British: Caribbean | – | 0.91% | 495,682 | 1.1% | 561,246 | 1.1% | 591,016 | 1.1% | 619,419 | 1.1% |
| Black or Black British: African | – | 0.3% | 206,918 | 0.4% | 475,938 | 1.0% | 977,741 | 1.8% | 1,468,474 | 2.6% |
| Black or Black British: Other | – | 0.3% | 172,282 | 0.4% | 95,324 | 0.2% | 277,857 | 0.5% | 293,831 | 0.5% |
| British Mixed: Total | – | – | – | – | 643,373 | 1.3% | 1,192,879 | 2.3% | 1,669,378 | 2.9% |
| Mixed: White and Caribbean | – | – | – | – | 231,424 | 0.5% | 415,616 | 0.8% | 499,310 | 0.9% |
| Mixed: White and African | – | – | – | – | 76,498 | 0.2% | 161,550 | 0.3% | 241,528 | 0.4% |
| Mixed: White and Asian | – | – | – | – | 184,014 | 0.4% | 332,708 | 0.6% | 474,190 | 0.8% |
| Mixed: Other Mixed | – | – | – | – | 151,437 | 0.3% | 283,005 | 0.3% | 454,350 | 0.8% |
| Other: Total | – | 0.44% | 273,721 | 0.6% | 214,619 | 0.4% | 548,418 | 1.0% | 1,229,153 | 2.2% |
| Other: Arab | – | – | – | – | – | – | 220,985 | 0.4% | 320,203 | 0.6% |
| Other: Any other ethnic group | – | 0.44% | 273,721 | 0.6% | 214,619 | 0.4% | 327,433 | 0.6% | 908,950 | 1.6% |
| Non-White: Total | – | 4.6% | 2,910,865 | 6.2% | 4,459,470 | 9% | 7,731,314 | 14.6% | 10,706,647 | 19% |
| Total | – | 100% | 47,055,204 | 100% | 49,138,831 | 100% | 53,012,456 | 100% | 56,490,048 | 100% |

Notes for table above
Population distribution
- Population distribution of ethnic groups in 2011
 Other White (4.6%)
 Asian/Asian British: Indian (2.6%)
 Asian/Asian British: Pakistani (2.1%)
 Asian/Asian British: Bangladeshi (0.8%)
 Black/Black British: Total (3.5%)
 Other: Arab (0.4%)


- Proportion of births in regions of each broad multi-ethnic group
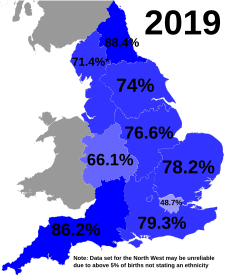 White
White Asian
Asian Black
Black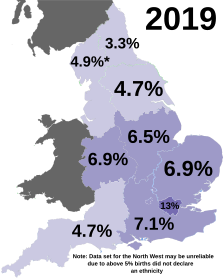 Mixed
Mixed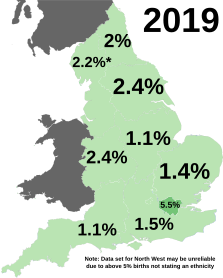 All other ethnic groups
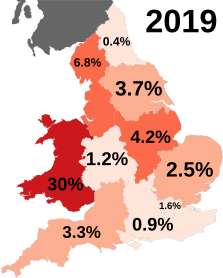 Births which did not state an ethnicity


Ethnicity of school pupils
The ethnicity of school pupils in England has been changing since the figures started to be collected in 2002, White British students proportionally have been in decline compared to other groups who have risen.
| Ethnic group | School year[35][36] | |||||||||||||||
|---|---|---|---|---|---|---|---|---|---|---|---|---|---|---|---|---|
| 2004 | 2008 | 2010 | 2014 | 2015/16 | 2017/18 | 2019/20 | 2021/2022 | |||||||||
| Number | % | Number | % | Number | % | Number | % | Number | % | Number | % | Number | % | Number | % | |
| White: Total | 5,584,800 | 82.9% | 5,389,340 | 81.3% | 5,243,870 | 79.9% | 5,222,070 | 76.9% | 5,258,582 | 75.6% | 6,027,781 | 74% | 6,048,980 | 72.8% | 6,011,045 | 71.4% |
| White: British | 5,408,700 | 80.3% | 5,136,610 | 77.4% | 4,963,110 | 75.6% | 4,859,730 | 71.6% | 4,822,332 | 69.3% | 5,454,108 | 66.9 | 5,432,991 | 65.4 | 5,379,748 | 63.9% |
| White: Irish | 26,100 | 23,620 | 0.4% | 22,190 | 0.3% | 21,640 | 0.3% | 21,127 | 0.3 | 23,110 | 0.3 | 22,443 | 0.3 | 21,495 | 0.3 | |
| White: Roma | 6,500 | 0.1% | 3,940 | 0.1% | 4,000 | 0.1% | 4,625 | 0.1% | 22,092 | 0.3 | 26,653 | 0.3 | 28,091 | 0.3 | 27,359 | 0.3 |
| White: Irish Traveller | 0.1% | 8,770 | 0.1% | 10,990 | 0.2% | 19,030 | 0.3% | 4,975 | 0.1 | 6,008 | 0.1 | 6,578 | 0.1 | 6,903 | 0.1 | |
| White: Other | 139,600 | 2.1% | 216,410 | 3.3% | 243,580 | 3.7% | 317,055 | 4.7% | 388,056 | 5.6 | 517,902 | 6.4 | 558,877 | 6.7 | 575,540 | 6.8 |
| Asian / Asian British: Total | 476,900 | 6.7% | 536,420 | 8.1% | 575,670 | 8.8% | 676,920 | 10.0% | 755,817 | 10.8% | 937,983 | 11.4% | 985,795 | 11.9% | 1,040,541 | 12.3% |
| Asian / Asian British: Indian | 154,400 | 2.3% | 161,150 | 2.4% | 163,780 | 2.5% | 180,995 | 2.7% | 196,351 | 2.8 | 247,280 | 3.0 | 268,318 | 3.2 | 289,179 | 3.4 |
| Asian / Asian British: Pakistani | 180,600 | 2.7% | 214,210 | 3.2% | 231,380 | 3.5% | 273,465 | 4.0% | 293,089 | 4.2 | 360,554 | 4.4 | 372,699 | 4.5 | 380,781 | 4.5 |
| Asian / Asian British: Bangladeshi | 72,000 | 1.1% | 87,320 | 1.3% | 95,420 | 1.5% | 110,735 | 1.6% | 117,004 | 1.7 | 143,379 | 1.8 | 148,290 | 1.8 | 151,613 | 1.8 |
| Asian / Asian British: Chinese | 23,700 | 0.4% | 24,780 | 0.4% | 24,690 | 0.4% | 26,725 | 0.4% | 28,915 | 0.4 | 36,196 | 0.4 | 37,732 | 0.5 | 48,396 | 0.6 |
| Asian / Asian British: Other Asians | 46,200 | 0.7% | 73,770 | 1.1% | 85,080 | 1.3% | 111,720 | 1.6% | 120,458 | 1.7 | 150,574 | 1.8 | 158,756 | 1.9 | 170,572 | 2.0 |
| Black / Black British: Total | 244,900 | 3.6% | 292,860 | 4.4% | 312,260 | 4.8% | 366,130 | 5.4% | 389,585 | 5.5% | 464,367 | 5.7% | 474,570 | 5.7% | 486,517 | 5.8% |
| Black: Caribbean | 96,100 | 1.4% | 92,090 | 1.4% | 91,400 | 1.4% | 89,350 | 1.3% | 85,830 | 1.2 | 91,429 | 1.1 | 86,543 | 1.0 | 82,402 | 1.0 |
| Black: African | 120,900 | 1.8% | 167,990 | 2.5% | 184,790 | 2.8% | 232,065 | 3.4% | 253,781 | 3.6 | 311,012 | 3.8 | 323,874 | 3.9 | 338,614 | 4.0 |
| Black: Other Blacks | 27,900 | 0.4% | 32,770 | 0.5% | 36,070 | 0.5% | 44,710 | 0.7% | 49,974 | 0.7 | 61,926 | 0.8 | 64,153 | 0.8 | 65,501 | 0.8 |
| Mixed / British Mixed | 181,500 | 2.7% | 229,650 | 3.5% | 256,980 | 3.9% | 325,140 | 4.8% | 363,730 | 5.3% | 473,305 | 5.8% | 515,061 | 6.1% | 558,184 | 6.6% |
| Mixed: White and Caribbean | 64,600 | 1.0% | 77,350 | 1.2% | 82,410 | 1.3% | 95,785 | 1.4% | 101,278 | 1.5 | 123,873 | 1.5 | 128,774 | 1.5 | 133,504 | 1.6 |
| Mixed: White and African | 17,000 | 0.3% | 24,110 | 0.4% | 27,860 | 0.4% | 40,245 | 0.6% | 47,472 | 0.7 | 63,518 | 0.8 | 70,403 | 0.8 | 76,262 | 0.9 |
| Mixed: White and Asian Other | 36,300 | 0.5% | 47,510 | 0.7% | 54,610 | 0.8% | 73,555 | 1.1% | 84,133 | 1.2 | 111,811 | 1.4 | 123,153 | 1.5 | 134,821 | 1.6 |
| Mixed: Other Mixed | 63,500 | 0.9% | 80,680 | 1.2% | 92,110 | 1.4% | 115,560 | 1.7% | 130,847 | 1.9 | 174,103 | 2.1 | 192,731 | 2.3 | 213,597 | 2.5 |
| Other: Total | 57,900 | 78,560 | 1.2% | 86,880 | 1.3% | 106,115 | 1.6% | 119,647 | 1.7% | 154,575 | 1.9% | 168,758 | 2.0% | 185,355 | 2.2% | |
| Unclassified | 190,700 | 2.8% | 81,300 | 1.2% | 64,610 | 1.0% | 67,935 | 1.0% | 67,126 | 1.0% | 94,312 | 1.2% | 119,388 | 1.4% | 136,371 | 1.6% |
| Total: | 6,736,700 | 100% | 6,632,900 | 100% | 6,564,940 | 100% | 6,791,030 | 100% | 6,954,487 | 100% | 8,152,323 | 100% | 8,312,552 | 100% | 8,418,013 | 100% |
- Ethnicity of school pupils in the school year of 2021/2022
 White: 71.4%
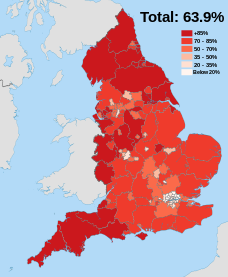 White British: 63.9%


Languages
The most common main languages spoken in England according to the 2011 census are shown below.[37]
| Rank | Language | Usual residents aged 3+ | Proportion |
|---|---|---|---|
| 1 | English | 46,936,780 | 92.02% |
| 2 | Polish | 529,173 | 1.04% |
| 3 | Punjabi | 271,580 | 0.53% |
| 4 | Urdu | 266,330 | 0.52% |
| 5 | Bengali (with Sylheti and Chatgaya) | 216,196 | 0.42% |
| 6 | Gujarati | 212,217 | 0.42% |
| 7 | Arabic | 152,490 | 0.30% |
| 8 | French | 145,026 | 0.28% |
| 9 | Portuguese | 131,002 | 0.26% |
| 10 | Spanish | 118,554 | 0.23% |
| 11 | Tamil | 99,773 | 0.20% |
| 12 | Turkish | 98,083 | 0.19% |
| 13 | Italian | 90,547 | 0.18% |
| 14 | Somali | 84,387 | 0.17% |
| 15 | Lithuanian | 84,327 | 0.17% |
| 16 | German | 75,190 | 0.15% |
| 17 | Persian/Farsi | 75,179 | 0.15% |
| 18 | Tagalog/Filipino | 67,593 | 0.13% |
| 19 | Romanian | 66,496 | 0.13% |
| 20 | Russian | 66,271 | 0.13% |
| – | Welsh | 8,248 | 0.02% |
| – | Cornish | 554 | 0.00% |
| – | Other | 1,209,614 | 2.37% |
| Population | 51,005,610 | 100.00% |
Religion

Religion in England (2021 census)
Respondents to the 2001, 2011 and 2021 censuses gave their religions as follows:
| Religion | 2001[38] | 2011[39] | 2021[40] | |||
|---|---|---|---|---|---|---|
| Number | % | Number | % | Number | % | |
| Christian | 35,251,244 | 71.74% | 31,479,876 | 59.38% | 26,167,899 | 46.3 |
| Muslim | 1,524,887 | 3.10% | 2,660,116 | 5.02% | 3,801,186 | 6.7 |
| Hindu | 546,982 | 1.11% | 806,199 | 1.52% | 1,032,533 | 1.8 |
| Sikh | 327,343 | 0.67% | 420,196 | 0.79% | 520,092 | 0.9 |
| Jewish | 257,671 | 0.52% | 261,282 | 0.49% | 269,283 | 0.5 |
| Buddhist | 139,046 | 0.28% | 238,626 | 0.45% | 262,433 | 0.5 |
| Other religion | 143,811 | 0.29% | 227,825 | 0.43% | 332,410 | 0.6 |
| No religion | 7,171,332 | 14.59% | 13,114,232 | 24.74% | 20,715,664 | 36.7 |
| Religion not stated | 3,776,515 | 7.69% | 3,804,104 | 7.18% | 3,400,548 | 6.0 |
| Total population | 49,138,831 | 100.00% | 53,012,456 | 100.00% | 56,490,048 | 100.0 |
See also
- Demographics of the United Kingdom
- Demographics of Scotland
- Demographics of Wales
- Demographics of Northern Ireland
- Demographics of London
- Demographics of Birmingham
- Demographics of Greater Manchester
- United Kingdom Census 2011
- National Statistics Socio-economic Classification
- Census 2001 Ethnic Codes
- List of English districts by population
- List of urban areas in England by population
- List of towns and cities in England by historical population
- List of major settlements by population in English counties