Mixed is an ethnic group category that was first introduced by the United Kingdom's Office for National Statistics for the 2001 Census. Colloquially, it refers to British citizens or residents whose parents are of two or more races or ethnic backgrounds. The Mixed or Multiple ethnic group in England and Wales numbered 1.7 million in the 2021 census, 2.9% of the population.[4]
 Distribution by local authority in the 2011 census | |
| Total population | |
|---|---|
| United Kingdom 1,250,229 – 2.0% (2011)[1] England: 1,669,375 – 3.0% (2021)[2] Wales: 48,602 – 1.6% (2021)[2] England and Wales by Mixed Ethnicities (2021) Scotland: 19,815 – 0.4% (2011)
Northern Ireland: 14,382 – 0.8% (2021)[3] | |
| Regions with significant populations | |
| Greater London, Manchester, Birmingham |
Statistics

A number of academics have pointed out that the ethnicity classification employed in the census and other official statistics in the UK since 1991 involve confusion between the concepts of ethnicity and race.[5][6] Aspinall notes that sustained academic attention has been focused on "how the censuses measure ethnicity, especially the use of dimensions that many claim have little to do with ethnicity, such as skin colour, race, and nationality".[7]
The year 2001 was the first census which asked about mixed race identity. In that census, 677,177 classified themselves as of mixed ethnicity, making up 1.2 percent of the country's population.[8] The 2011 Census gave the figure as 2.2% for England and Wales.[9]
Office for National Statistics estimates suggest that 956,700 mixed-ethnicity people were resident in England (as opposed to the whole of the country) as of mid-2009, compared to 654,000 at mid-2001.[10] As of May 2011, this figure surpassed 1 million.[11] It was estimated in 2007 that, by 2020, 1.24 million people in the UK would be of mixed race.[12]Research conducted by the BBC, however, suggests that the mixed race population could already be twice the official estimate figure - up to 2 million.[13] According to The Economist in October 2020, the 2011 census figure "is probably an undercount, since not all children of mixed marriages will have ticked one of the mixed categories, and the number is likely to have grown since the census".[14]
3.5 percent of all births in England and Wales in 2005 were mixed-ethnicity babies, with 0.9 percent being 'Mixed White and Black Caribbean', 0.5 percent 'Mixed White and Black African', 0.8 percent 'Mixed White and Asian', and 1.3 percent any other mixed background.[15]
Subgroups
Year of arrival (2021 census)[16]
In England and Wales, the 2001 census included four sub-categories of mixed ethnic combinations: "Mixed White and Black Caribbean", "Mixed White and Black African", "Mixed White and Asian" and "Any other Mixed background", with the latter allowing people to write in their ethnicity. Analysis of census results shows that, in England and Wales only, 237,000 people stated their ethnicity as Mixed White and Black Caribbean, 189,000 as Mixed White and Asian, 156,000 as Other Mixed, and 79,000 Mixed White and Black African.[17]
The estimates for mid-2009 for England only suggest that there are 301,300 people in the Mixed White and Black Caribbean category, 127,500 Mixed White and Black African, 292,400 Mixed White and Asian, and 235,500 Other Mixed.[10] The White and Black African group grew fastest in percentage terms from 2001 to 2009, followed by White and Asian, Other Mixed and then White and Black Caribbean.[10]
The 2011 Census for England and Wales suggested that compared with 2001, the proportion of the population describing themselves as "Mixed White and Black Caribbean" rose from 0.5% to 0.8%, "Mixed White and Asian" from 0.4% to 0.6%, "Mixed White and Black African" from 0.2% to 0.3% and "Other Mixed" 0.3% to 0.5%.[18]
The census forms in Scotland and Northern Ireland did not include sub-groups, but rather single categories: "Any Mixed Background" in Scotland and simply "Mixed" in Northern Ireland.[19]
- Population pyramids of each sub-category of the broader Mixed group in 2021
 Mixed White and Black Caribbean
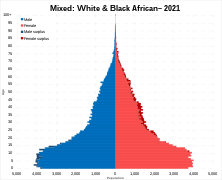 Mixed White and Black African
 Mixed White and Asian
 Mixed Other


Detailed breakdown
| Ethnic group within the Mixed group (in England and Wales) | 2021[20] | ||
|---|---|---|---|
| Population | % of total pop | % of group makeup | |
| Mixed or Multiple ethnic groups: White and Black Caribbean | 513,042 | 0.9 | 29.9% |
| Mixed or Multiple ethnic groups: White and Asian (unspecified) | 488,225 | 0.8 | 28.4% |
| Mixed or Multiple ethnic groups: White and Black African | 249,596 | 0.4 | 14.5% |
| Mixed or Multiple ethnic groups: Other Mixed | 107,957 | 0.2 | 6.3% |
| Mixed or Multiple ethnic groups: Any other ethnic group | 54,986 | 0.1 | 3.2% |
| Mixed or Multiple ethnic groups: Hispanic or Latin American | 28,064 | 0.0 | 1.6% |
| Mixed or Multiple ethnic groups: European Mixed, European unspecified, other European | 26,572 | 0.0 | 1.5% |
| Mixed or Multiple ethnic groups: Black and White (unspecified) | 18,164 | 0.0 | 1.1% |
| Mixed or Multiple ethnic groups: White and Arab | 16,359 | 0.0 | 1.0% |
| Mixed or Multiple ethnic groups: Black and Asian | 14,355 | 0.0 | 0.8% |
| Mixed or Multiple ethnic groups: White and North African or Middle Eastern | 12,904 | 0.0 | 0.8% |
| Mixed or Multiple ethnic groups: English/Welsh/Scottish/Northern Irish/British | 11,880 | 0.0 | 0.7% |
| Mixed or Multiple ethnic groups: Other White, White unspecified | 11,092 | 0.0 | 0.6% |
| Mixed or Multiple ethnic groups: Arab | 7,777 | 0.0 | 0.5% |
| Mixed or Multiple ethnic groups: Chinese and White | 7,642 | 0.0 | 0.4% |
| Mixed or Multiple ethnic groups: Caribbean | 7,579 | 0.0 | 0.4% |
| Mixed or Multiple ethnic groups: Caribbean Asian | 7,516 | 0.0 | 0.4% |
| Mixed or Multiple ethnic groups: Brazilian | 6,569 | 0.0 | 0.4% |
| Mixed or Multiple ethnic groups: Mixed White | 6,389 | 0.0 | 0.4% |
| Mixed or Multiple ethnic groups: South American | 5,989 | 0.0 | 0.3% |
| Mixed or Multiple ethnic groups: Mauritian/Seychellois/Maldivian/Sao Tomean/St Helenian | 5,741 | 0.0 | 0.3% |
| Mixed or Multiple ethnic groups: Iranian | 5,364 | 0.0 | 0.3% |
| Mixed or Multiple ethnic groups: Turkish | 5,149 | 0.0 | 0.3% |
| Mixed or Multiple ethnic groups: Mixed Black | 4,995 | 0.0 | 0.3% |
| Mixed or Multiple ethnic groups: Polynesian/Micronesian/Melanesian | 4,900 | 0.0 | 0.3% |
| Mixed or Multiple ethnic groups: Mixed Irish | 4,432 | 0.0 | 0.3% |
| Mixed or Multiple ethnic groups: African Asian | 4,071 | 0.0 | 0.2% |
| Mixed or Multiple ethnic groups: African unspecified | 3,925 | 0.0 | 0.2% |
| Mixed or Multiple ethnic groups: White and South Asian | 3,886 | 0.0 | 0.2% |
| Mixed or Multiple ethnic groups: English | 3,803 | 0.0 | 0.2% |
| Mixed or Multiple ethnic groups: Other Middle East | 3,647 | 0.0 | 0.2% |
| Mixed or Multiple ethnic groups: Indian or British Indian | 3,515 | 0.0 | 0.2% |
| Mixed or Multiple ethnic groups: European and Black African | 3,450 | 0.0 | 0.2% |
| Mixed or Multiple ethnic groups: White and East Asian | 3,111 | 0.0 | 0.2% |
| Mixed or Multiple ethnic groups: White Caribbean | 3,077 | 0.0 | 0.2% |
| Mixed or Multiple ethnic groups: European and North African or Middle Eastern | 3,003 | 0.0 | 0.2% |
| Mixed or Multiple ethnic groups: South Asian and European | 2,965 | 0.0 | 0.2% |
| Mixed or Multiple ethnic groups: Chinese | 2,871 | 0.0 | 0.2% |
| Mixed or Multiple ethnic groups: Other Asian, Asian unspecified | 2,849 | 0.0 | 0.2% |
| Mixed or Multiple ethnic groups: Asian (unspecified) and European | 2,805 | 0.0 | 0.2% |
| Mixed or Multiple ethnic groups: Mexican | 2,655 | 0.0 | 0.2% |
| Mixed or Multiple ethnic groups: Jewish | 2,595 | 0.0 | 0.2% |
| Mixed or Multiple ethnic groups: Portuguese | 2,508 | 0.0 | 0.1% |
| Mixed or Multiple ethnic groups: Anglo Indian | 2,473 | 0.0 | 0.1% |
| Mixed or Multiple ethnic groups: European and Black Caribbean | 2,266 | 0.0 | 0.1% |
| Mixed or Multiple ethnic groups: Italian | 2,248 | 0.0 | 0.1% |
| Mixed or Multiple ethnic groups: Black and European | 2,185 | 0.0 | 0.1% |
| Mixed or Multiple ethnic groups: Black British | 2,050 | 0.0 | 0.1% |
| Mixed or Multiple ethnic groups: White African | 2,017 | 0.0 | 0.1% |
| Mixed or Multiple ethnic groups: Mixed South Asian | 1,999 | 0.0 | 0.1% |
| Mixed or Multiple ethnic groups: Turkish Cypriot | 1,985 | 0.0 | 0.1% |
| Mixed or Multiple ethnic groups: Greek Cypriot | 1,968 | 0.0 | 0.1% |
| Mixed or Multiple ethnic groups: African/Arab | 1,924 | 0.0 | 0.1% |
| Mixed or Multiple ethnic groups: Chinese and other Asian | 1,907 | 0.0 | 0.1% |
| Mixed or Multiple ethnic groups: Moroccan | 1,879 | 0.0 | 0.1% |
| Mixed or Multiple ethnic groups: Spanish | 1,793 | 0.0 | 0.1% |
| Mixed or Multiple ethnic groups: Pakistani or British Pakistani | 1,691 | 0.0 | 0.1% |
| Mixed or Multiple ethnic groups: South African | 1,620 | 0.0 | 0.1% |