This page describes techniques for generating a bar chart in a Wikipedia page, by coding a set of numbers in a <timeline>...</timeline> tag format. It can display charts in various formats. The whole image is scaled by a command, e.g. "ImageSize=width:180 height:90", and using the keyword "bar" triggers the bar chart features. However, the {{Bar chart}} can easily format a horizontal bar chart (scrolling down a page), with one or two or four columns of bars in a chart.
Here, with the <timeline>...</timeline>, the a vertical bars is formatted by the command "TimeAxis=orientation:vertical" (before specifying the data for the bars). The width of bars is set by "PlotData=width:20". The color of any bar can be set by appending the keyword "color:" (such as "color:lightgrey") at the end of each bar's numeric data.
For other optional parameters see § Bar chart commands and attributes, or full list at Help:Timeline.
Example of a population bar chart
The following bar chart is generated, live, using a timeline-tag structure which contains population numbers for each year in the bar chart (markup shown further below).
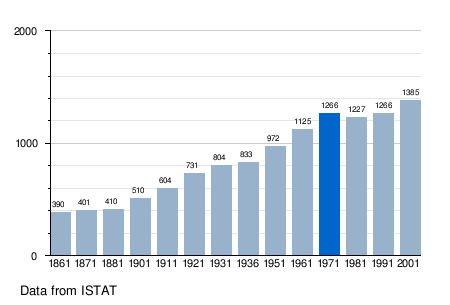
The above bar chart, showing population bars for each year, can be generated by using the markup text listed below. The example text (below) can be copied and shortened, or expanded, to handle other years or numbers in a bar chart format. The image size is set as "ImageSize = width:450 height:305" for a box of 450x305px. Bar charts can be made simpler by omitting some of the various data options, such as dropping the keyword "at:" ("at:390") which places labels at certain locations on a bar.
<timeline>Colors= id:lightgrey value:gray(0.9) id:darkgrey value:gray(0.8) id:sfondo value:rgb(1,1,1) id:barra value:rgb(0.6,0.7,0.8)ImageSize = width:450 height:305PlotArea = left:50 bottom:50 top:30 right:30DateFormat = x.yPeriod = from:0 till:2000TimeAxis = orientation:verticalAlignBars = justifyScaleMajor = gridcolor:darkgrey increment:1000 start:0ScaleMinor = gridcolor:lightgrey increment:200 start:0BackgroundColors = canvas:sfondoBarData= bar:1861 text:1861 bar:1871 text:1871 bar:1881 text:1881 bar:1901 text:1901 bar:1911 text:1911 bar:1921 text:1921 bar:1931 text:1931 bar:1936 text:1936 bar:1951 text:1951 bar:1961 text:1961 bar:1971 text:1971 bar:1981 text:1981 bar:1991 text:1991 bar:2001 text:2001PlotData= color:barra width:20 align:left bar:1861 from: 0 till:390 bar:1871 from: 0 till:401 bar:1881 from: 0 till:410 bar:1901 from: 0 till:510 bar:1911 from: 0 till:604 bar:1921 from: 0 till:731 bar:1931 from: 0 till:804 bar:1936 from: 0 till:833 bar:1951 from: 0 till:972 bar:1961 from: 0 till:1125 bar:1971 from: 0 till:1266 color:blue bar:1981 from: 0 till:1227 bar:1991 from: 0 till:1266 bar:2001 from: 0 till:1385PlotData= bar:1861 at:390 fontsize:XS text: 390 shift:(-8,5) bar:1871 at:401 fontsize:XS text: 401 shift:(-8,5) bar:1881 at:410 fontsize:XS text: 410 shift:(-8,5) bar:1901 at:510 fontsize:XS text: 510 shift:(-8,5) bar:1911 at:604 fontsize:XS text: 604 shift:(-8,5) bar:1921 at:731 fontsize:XS text: 731 shift:(-8,5) bar:1931 at:804 fontsize:XS text: 804 shift:(-8,5) bar:1936 at:833 fontsize:XS text: 833 shift:(-8,5) bar:1951 at:972 fontsize:XS text: 972 shift:(-8,5) bar:1961 at:1125 fontsize:XS text: 1125 shift:(-8,5) bar:1971 at:1266 fontsize:XS text: 1266 shift:(-8,5) bar:1981 at:1227 fontsize:XS text: 1227 shift:(-8,5) bar:1991 at:1266 fontsize:XS text: 1266 shift:(-8,5) bar:2001 at:1385 fontsize:XS text: 1385 shift:(-8,5)TextData= fontsize:S pos:(20,10) text:Data from ISTAT</timeline>
The above text will generate the bar chart-image shown above, with 14 bars in an image box, sized 450x305 pixels, with the left-corner note "Data from ISTAT".
Bar chart commands and attributes
Each bar chart command is followed by an equal-sign ("="), while attributes are followed by a colon (":") as in the command "Period = from:0 till:2000" which sets the vertical (y-axis) range from 0 to 2000.
The timeline commands to format the graph layout are:
- ImageSize = width:450 height:305
- The numbers 450 and 305 are pixel sizes of the image box.
- PlotArea = left:50 bottom:50 top:30 right:30
- The PlotArea defines margins around the bar chart inside the image.
- DateFormat = x.y
- This sets the date format, if needed.
- Period = from:0 till:2000
- The Period is the range of numbers along the vertical axis (y-axis numbers). Setting attribute "till" larger by 500 (as "till:2500") would compress the bars, as 20% shorter within the image box.
- TimeAxis = orientation:vertical
- The attribute value as "vertical" displays the bars as upright.
- AlignBars = justify
- Using command "AlignBars=justify" will auto-widen the bars to fit.
- ScaleMajor = gridcolor:darkgrey increment:1000 start:0
- Command "ScaleMajor" sets the major y-axis ruler lines across the graph.
- ScaleMinor = gridcolor:lightgrey increment:200 start:0
- Command "ScaleMinor" sets the minor y-axis rulers across the graph.
- BackgroundColors = canvas:sfondo
- The overall color is set to id "sfondo" (defined above), as "value:rgb(1,1,1)" which is white hue, with the RGB (Red/Green/Blue) numbers as "1,1,1".
The timeline commands to format the text labels are:
- bar:1861 at:390 fontsize:XS text: 390 shift:(-8,5)
- Here "bar:1861" names the bar to label, at height 390, using fontsize:XS (for extra-small, or "S" as small, or M,L,XL font), with literal text as "390" slightly shifted in position by "shift:(-8,5)".
- TextData=
- fontsize:S pos:(20,10) text:Data from ISTAT
- Command "TextData" sets a note line, here at left-corner X-Y position "pos:(20,10)" with the literal text note "Data from ISTAT".
The above descriptions are for the common commands, plus their colon-attributes with values from the example.
For more information, see Help:Timeline, with other examples, showing traditional timeline formats, beyond the bar chart style shown above.