Increasing methane emissions are a major contributor to the rising concentration of greenhouse gases in Earth's atmosphere, and are responsible for up to one-third of near-term global heating.[1][2] During 2019, about 60% (360 million tons) of methane released globally was from human activities, while natural sources contributed about 40% (230 million tons).[3][4] Reducing methane emissions by capturing and utilizing the gas can produce simultaneous environmental and economic benefits.[1][5]
Sources of methane emissions due to human activity (year 2020 estimates) [1]
Since the Industrial Revolution, concentrations of methane in the atmosphere have more than doubled, and about 20 percent of the warming the planet has experienced can be attributed to the gas.[6] About one-third (33%) of anthropogenic emissions are from gas release during the extraction and delivery of fossil fuels; mostly due to gas venting and gas leaks from both active fossil fuel infrastructure and orphan wells.[7] Russia is the world's top methane emitter from oil and gas.[8][9]
Animal agriculture is a similarly large source (30%); primarily because of enteric fermentation by ruminant livestock such as cattle and sheep. According to the Global Methane Assessment published in 2021, methane emissions from livestock (including cattle) are the largest sources of agricultural emissions worldwide[10] A single cow can make up to 99 kg of methane gas per year.[11] Ruminant livestock can produce 250 to 500 L of methane per day.[12]
Human consumer waste flows, especially those passing through landfills and wastewater treatment, have grown to become a third major category (18%). Plant agriculture, including both food and biomass production, constitutes a fourth group (15%), with rice production being the largest single contributor.[1][13]
The world's wetlands contribute about three-quarters (75%) of the enduring natural sources of methane.[3][4] Seepages from near-surface hydrocarbon and clathrate hydrate deposits, volcanic releases, wildfires, and termite emissions account for much of the remainder.[13] Contributions from the surviving wild populations of ruminant mammals are vastly overwhelmed by those of cattle, humans, and other livestock animals.[14]
The Economist recommended setting methane emissions targets as a reduction in methane emissions would allow for more time to tackle the more challenging carbon emissions".[15][16]
Atmospheric concentration and warming influence

The atmospheric methane (CH4) concentration is increasing and exceeded 1860 parts per billion in 2019, equal to two-and-a-half times the pre-industrial level.[19] The methane itself causes direct radiative forcing that is second only to that of carbon dioxide (CO2).[20] Due to interactions with oxygen compounds stimulated by sunlight, CH4 can also increase the atmospheric presence of shorter-lived ozone and water vapour, themselves potent warming gases: atmospheric researchers call this amplification of methane's near-term warming influence indirect radiative forcing.[21] When such interactions occur, longer-lived and less-potent CO2 is also produced. Including both the direct and indirect forcings, the increase in atmospheric methane is responsible for about one-third of near-term global heating.[1][2]
Though methane causes far more heat to be trapped than the same mass of carbon dioxide, less than half of the emitted CH4 remains in the atmosphere after a decade. On average, carbon dioxide warms for much longer, assuming no change in rates of carbon sequestration.[22][23] The global warming potential (GWP) is a way of comparing the warming due to other gases to that from carbon dioxide, over a given time period. Methane's GWP20 of 85 means that a ton of CH4 emitted into the atmosphere creates approximately 85 times the atmospheric warming as a ton of CO2 over a period of 20 years.[23] On a 100-year timescale, methane's GWP100 is in the range of 28–34.
Methane emissions are important as reducing them can buy time to tackle carbon emissions.[24][25]
Overview of emission sources
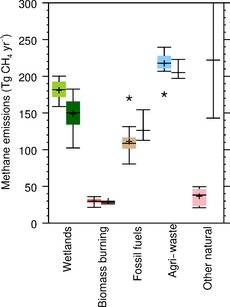
Biogenic methane is actively produced by microorganisms in a process called methanogenesis. Under certain conditions, the process mix responsible for a sample of methane may be deduced from the ratio of the isotopes of carbon, and through analysis methods similar to carbon dating.[26][27]
Anthropogenic
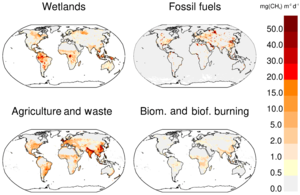
As of 2020[update], emission volumes from some sources remain more uncertain than others; due in part to localized emission spikes not captured by the limited global measurement capability. The time required for a methane emission to become well-mixed throughout earth's troposphere is about 1–2 years.[28]
Satellite data indicate over 80% of the growth of methane emissions during 2010–2019 are tropical terrestrial emissions.[29][30]
There is accumulating research and data showing that oil and gas industry methane emissions – or from fossil fuel extraction, distribution and use – are much larger than thought.[31][32][33][34][35]
| Category | Major Sources | IEA Annual Emission 2023[36] (Million Tons) |
|---|---|---|
| Fossil fuels | Gas distribution | 29 |
| Oil wells | 49* | |
| Coal mines | 40 | |
| Biofuels | Anaerobic digestion | 10 |
| Industrial agriculture | Enteric fermentation | 142 |
| Rice paddies | ||
| Manure management | ||
| Biomass | Biomass burning | 10 |
| Consumer waste | Solid waste Landfill gas | 71 |
| Wastewater | ||
| Total anthropogenic | 351 | |
| * An additional 100 million tons (140 billion cubic meters) of gas is flared each year from oil wells.[37] Additional References: [1][38][39][40][41] | ||
Natural

Natural sources have always been a part of the methane cycle. Wetland emissions have been declining due to draining for agricultural and building areas.
| Category | Major Sources | IEA Annual Emission 2023[36] (Million Tons) |
|---|---|---|
| Wetlands | Wetland methane | 194 |
| Other natural | Geologic seepages Volcanic gas | 39 |
| Arctic methane emissions | ||
| Ocean sediments | ||
| Wildfires | ||
| Termites | ||
| Total natural | 233 | |
| Additional References: [1][38][39] | ||
Methanogenesis
Most ecological emissions of methane relate directly to methanogens generating methane in warm, moist soils as well as in the digestive tracts of certain animals. Methanogens are methane producing microorganisms. In order to produce energy, they use an anaerobic process called methanogenesis. This process is used in lieu of aerobic, or with oxygen, processes because methanogens are unable to metabolise in the presence of even small concentrations of oxygen. When acetate is broken down in methanogenesis, the result is the release of methane into the surrounding environment.
Methanogenesis, the scientific term for methane production, occurs primarily in anaerobic conditions because of the lack of availability of other oxidants. In these conditions, microscopic organisms called archaea use acetate and hydrogen to break down essential resources[vague] in a process called fermentation.
Acetoclastic methanogenesis – certain archaea cleave acetate produced during anaerobic fermentation to yield methane and carbon dioxide.
- H3C-COOH → CH4 + CO2
Hydrogenotrophic methanogenesis – archaea oxidize hydrogen with carbon dioxide to yield methane and water.
- 4H2 + CO2 → CH4 + 2H2O
While acetoclastic methanogenesis and hydrogenotrophic methanogenesis are the two major source reactions for atmospheric methane, other minor biological methane source reactions also occur. For example, it has been discovered that leaf surface wax exposed to UV radiation in the presence of oxygen is an aerobic source of methane.[42]
Natural methane cycles
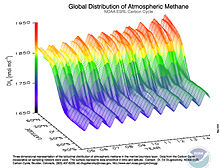
Emissions of methane into the atmosphere are directly related to temperature and moisture. Thus, the natural environmental changes that occur during seasonal change act as a major control of methane emission. Additionally, even changes in temperature during the day can affect the amount of methane that is produced and consumed.[citation needed]
Its concentration is higher in the Northern Hemisphere since most sources (both natural and human) are located on land and the Northern Hemisphere has more land mass.[43] The concentrations vary seasonally, with, for example, a minimum in the northern tropics during April−May mainly due to removal by the hydroxyl radical.[44]
For example, plants that produce methane can emit as much as two to four times more methane during the day than during the night.[45] This is directly related to the fact that plants tend to rely on solar energy to enact chemical processes.
Additionally, methane emissions are affected by the level of water sources. Seasonal flooding during the spring and summer naturally increases the amount of methane released into the air.[citation needed]
Wetlands
Greenhouse gas emissions from wetlands of concern consist primarily of methane and nitrous oxide emissions. Wetlands are the largest natural source of atmospheric methane in the world, and are therefore a major area of concern with respect to climate change.[46][47][48] Wetlands account for approximately 20–30% of atmospheric methane through emissions from soils and plants, and contribute an approximate average of 161 Tg of methane to the atmosphere per year.[49]
Wetlands are characterized by water-logged soils and distinctive communities of plant and animal species that have adapted to the constant presence of water. This high level of water saturation creates conditions conducive to methane production. Most methanogenesis, or methane production, occurs in oxygen-poor environments. Because the microbes that live in warm, moist environments consume oxygen more rapidly than it can diffuse in from the atmosphere, wetlands are the ideal anaerobic environments for fermentation as well as methanogen activity. However, levels of methanogenesis fluctuates due to the availability of oxygen, soil temperature, and the composition of the soil. A warmer, more anaerobic environment with soil rich in organic matter would allow for more efficient methanogenesis.[50]In wetlands, where the rate of methane production is high, plants help methane travel into the atmosphere—acting like inverted lightning rods as they direct the gas up through the soil and into the air. They are also suspected to produce methane themselves, but because the plants would have to use aerobic conditions to produce methane, the process itself is still unidentified, according to a 2014 Biogeochemistry article.[51]
A 1994 article on methane emissions from northern wetlands said that since the 1800s, atmospheric methane concentrations increased annually at a rate of about 0.9%.[45]
Human-caused methane emissions
The AR6 of the IPCC said, "It is unequivocal that the increases in atmospheric carbon dioxide (CO2), methane (CH4), and nitrous oxide (N2O) since the pre-industrial period are overwhelmingly caused by human activities."[52][53][54] Atmospheric methane accounted for 20% of the total radiative forcing (RF) from all of the long-lived and globally mixed greenhouse gases.
According to the 2021 assessment by the Climate and Clean Air Coalition (CCAC) and the United Nations Environment Programme (UNEP) over 50% of global methane emissions are caused by human activities in fossil fuels (35%), waste (20%), and agriculture (40%). The oil and gas industry accounts for 23%, and coal mining for 12%. Twenty percent of global anthropogenic emissions stem from landfills and wastewater. Manure and enteric fermentation represent 32%, and rice cultivation represents 8%.[55]
The most clearly identified rise in atmospheric methane as a result of human activity occurred in the 1700s during the industrial revolution. During the 20th century—mainly because of the use of fossil fuels—concentration of methane in the atmosphere increased, then stabilized briefly in the 1990s,[56] only to begin to increase again in 2007. After 2014, the increase accelerated and by 2017, reached 1,850 (parts per billion) ppb.[57][58]
Increases in methane levels due to modern human activities arise from a number of specific sources including industrial activity; from extraction of oil and natural gas from underground reserves;[59] transportation via pipeline of oil and natural gas; and melting permafrost in Arctic regions, due to global warming which is caused by human use of fossil fuels.
The primary component of natural gas is methane, which is emitted to the atmosphere in every stage of natural gas "production, processing, storage, transmission, and distribution".[60]
Emissions due to oil and gas extraction
A 2005 Wuppertal Institute for Climate, Environment and Energy article identified pipelines that transport natural gas as a source of methane emissions. The article cited the example of Trans-Siberian natural gas pipeline system to western and Central Europe from the Yamburg and Urengoy exist gas fields in Russia with a methane concentration of 97%.[61] In accordance with the IPCC and other natural gas emissions control groups, measurements had to be taken throughout the pipeline to measure methane emissions from technological discharges and leaks at the pipeline fittings and vents. Although the majority of the natural gas leaks were carbon dioxide, a significant amount of methane was also being consistently released from the pipeline as a result of leaks and breakdowns. In 2001, natural gas emissions from the pipeline and natural gas transportation system accounted for 1% of the natural gas produced.[61] Between 2001 and 2005, this was reduced to 0.7%, the 2001 value was significantly less than that of 1996.[61]
A 2012 Climatic Change article and 2014 publication by a team of scientists led by Robert W. Howarth said that there was strong evidence that "shale gas has a larger GHG footprint than conventional gas, considered over any time scale. The GHG footprint of shale gas also exceeds that of oil or coal when considered at decadal time scales."[62][63] Howarth called for policy changes to regulate methane emissions resulting from hydraulic fracturing and shale gas development.[64]
A 2013 study by a team of researchers led by Scot M. Miller, said that U.S. greenhouse gas reduction policies in 2013 were based on what appeared to be significant underestimates of anthropogenic methane emissions.[65] The article said, that "greenhouse gas emissions from agriculture and fossil fuel extraction and processing"—oil and/or natural gas—were "likely a factor of two or greater than cited in existing studies."[65] By 2001, following a detailed study anthropogenic sources on climate change, IPCC researchers found that there was "stronger evidence that most of the observed warming observed over the last 50 years [was] attributable to human activities."[66][67] Since the Industrial Revolution humans have had a major impact on concentrations of atmospheric methane, increasing atmospheric concentrations roughly 250%.[68] According to the 2021 IPCC report, 30 - 50% of the current rise in temperatures is caused by emissions of methane,[69] and reducing methane is a fast way of climate change mitigation.[70] An alliance of 107 countries, including Brazil, the EU and the US, have joined the pact known as the Global Methane Pledge, committing to a collective goal of reducing global methane emissions by at least 30% from 2020 levels by 2030.[71][72]
Animals and livestock
Ruminant animals, particularly cows and sheep, contain bacteria in their gastrointestinal systems that help to break down plant material. Some of these microorganisms use the acetate from the plant material to produce methane, and because these bacteria live in the stomachs and intestines of ruminants, whenever the animal "burps" or defecates, it emits methane as well. Based upon a 2012 study in the Snowy Mountains region, the amount of methane emitted by one cow is equivalent to the amount of methane that around 3.4 hectares of methanotrophic bacteria can consume.[73]: 103 research in the Snowy Mountains region of Australia showed 8 tonnes of methane oxidized by methanotrophic bacteria per year on a 1,000 hectare farm. 200 cows on the same farm emitted 5.4 tonnes of methane per year. Hence, one cow emitted 27 kg of methane per year, while the bacteria oxidized 8 kg per hectare. The emissions of one cow were oxidized by 27/8 ≈ 3.4 hectare.
Termites also contain methanogenic microorganisms in their gut. However, some of these microorganisms are so unique that they live nowhere else in the world except in the third gut of termites. These microorganisms also break down biotic components to produce ethanol, as well as methane byproduct. However, unlike ruminants who lose 20% of the energy from the plants they eat, termites only lose 2% of their energy in the process.[74] Thus comparatively, termites do not have to eat as much food as ruminants to obtain the same amount of energy, and give off proportionally less methane.
In 2001, NASA researchers confirmed the vital role of enteric fermentation in livestock on global warming.[75] A 2006 UN FAO report reported that livestock generate more greenhouse gases as measured in CO2 equivalents than the entire transportation sector. Livestock accounts for 9% of anthropogenic CO2, 65%t of anthropogenic nitrous oxide and 37% of anthropogenic methane.[76] Since then, animal science and biotechnology researchers have focused research on methanogens in the rumen of livestock and mitigation of methane emissions.[77]
Nicholas Stern, the author of the 2006 Stern Review on climate change has stated "people will need to turn vegetarian if the world is to conquer climate change".[78] In 2003, the National Academy of Sciences's president, Ralph Cicerone—an atmospheric scientist—raised concerns about the increase in the number of methane-producing dairy and beef cattle was a "serious topic" as methane was the "second-most-important greenhouse gas in the atmosphere".[79]
Approximately 5% of the methane is released via the flatus, whereas the other 95% is released via eructation. Vaccines are under development to reduce the amount introduced through eructation.[80] Asparagopsis seaweed as a livestock feed additive has reduced methane emissions by more than 80%.[81]
Waste
Landfills
Due to the large collections of organic matter and availability of anaerobic conditions, landfills are the third largest source of atmospheric methane in the United States, accounting for roughly 18.2% of methane emissions globally in 2014.[82] When waste is first added to a landfill, oxygen is abundant and thus undergoes aerobic decomposition; during which time very little methane is produced. However, generally within a year oxygen levels are depleted and anaerobic conditions dominate the landfill allowing methanogens to takeover the decomposition process. These methanogens emit methane into the atmosphere and even after the landfill is closed, the mass amount of decaying matter allows the methanogens to continue producing methane for years.[83]
Waste water treatment
Waste water treatment facilities act to remove organic matter, solids, pathogens, and chemical hazards as a result of human contamination. Methane emission in waste treatment facilities occurs as a result of anaerobic treatments of organic compounds and anaerobic biodegradation of sludge.[84]
Others
Aquatic ecosystems
Natural and anthropogenic methane emissions from aquatic ecosystems are estimated to contribute about half of total global emissions.[85] Urbanization and eutrophication are expected to lead to increased methane emissions from aquatic ecosystems.[85]
Ecological conversion
Conversion of forests and natural environments into agricultural plots increases the amount of nitrogen in the soil, which inhibits methane oxidation, weakening the ability of the methanotrophic bacteria in the soil to act as sinks.[86] Additionally, by changing the level of the water table, humans can directly affect the soil's ability to act as a source or sink. The relationship between water table levels and methane emission is explained in the wetlands section of natural sources.
Rice agriculture
Rice agriculture is a significant source of methane. With warm weather and water-logged soil, rice paddies act like wetlands, but are generated by humans for the purpose of food production. Due to the swamp-like environment of rice fields, these paddies emitted about 30 of the 400 million metric tons of anthropogenic methane in 2022.[87]
Biomass burning
Incomplete burning of both living and dead organic matter results in the emission of methane. While natural wildfires can contribute to methane emissions, the bulk majority of biomass burning occurs as a result of humans – including everything from accidental burnings by civilians to deliberate burnings used to clear out land to biomass burnings occurring as a result of destroying waste.[88]
Oil and natural gas supply chain
Methane is a primary component of natural gas, and thus during the production, processing, storage, transmission, and distribution of natural gas, a significant amount of methane is lost into the atmosphere.[84]
According to the EPA Inventory of U.S Greenhouse Gas Emissions and Sinks: 1990–2015 report, 2015 methane emissions from natural gas and petroleum systems totaled 8.1 Tg per year in the United States. Individually, the EPA estimates that the natural gas system emitted 6.5 Tg per year of methane while petroleum systems emitted 1.6 Tg per year of methane.[89] Methane emissions occur in all sectors of the natural gas industry, from drilling and production, through gathering and processing and transmission, to distribution. These emissions occur through normal operation, routine maintenance, fugitive leaks, system upsets, and venting of equipment. In the oil industry, some underground crude contains natural gas that is entrained in the oil at high reservoir pressures. When oil is removed from the reservoir, associated gas is produced.
However, a review of methane emissions studies reveals that the EPA Inventory of Greenhouse Gas Emissions and Sinks: 1990–2015 report likely significantly underestimated 2015 methane emissions from the oil and natural gas supply chain. The review concluded that in 2015 the oil and natural gas supply chain emitted 13 Tg per year of methane, which is about 60% more than the EPA report for the same time period. The authors write that the most likely cause for the discrepancy is an under sampling by the EPA of so-called "abnormal operating conditions", during which large quantities of methane can be emitted.[90]
| Supply chain segment | EPA Inventory of US Greenhouse Gas Emissions and Sinks: 1990–2015 report[89] | Alvarez et al. 2018[90] |
|---|---|---|
| Oil and natural gas production | 3.5 | 7.6 |
| Natural gas gathering | 2.3 | 2.6 |
| Natural gas transmission and storage | 1.4 | 1.8 |
| Natural gas processing | 0.44 | 0.72 |
| Natural gas local distribution | 0.44 | 0.44 |
| Oil refining and transportation | 0.034 | 0.034 |
| Total (95% confidence interval) | 8.1 (6.7–10.2) | 13 (11.3–15.1) |
Coal mining
In 2014 NASA researchers reported the discovery of a 2,500 square miles (6,500 km2) methane cloud floating over the Four Corners region of the south-west United States. The discovery was based on data from the European Space Agency's Scanning Imaging Absorption Spectrometer for Atmospheric Chartography instrument from 2002 to 2012.[91]
The report concluded that "the source is likely from established gas, coal, and coalbed methane mining and processing." The region emitted 590,000 metric tons of methane every year between 2002 and 2012—almost 3.5 times the widely used estimates in the European Union's Emissions Database for Global Atmospheric Research.[91] In 2019, the International Energy Agency (IEA) estimated that the methane emissions leaking from the world's coalmines are warming the global climate at the same rate as the shipping and aviation industries combined.[92]
IAs of April 2024, a report by the energy think tank Ember has brought attention to potential underreporting in Germany's coal mine methane (CMM) emissions. The report suggests that the actual emissions could be significantly higher than the figures officially reported by Germany. In 2022, Germany, which mined 131 million tonnes of lignite coal, amounting to 44% of the European Union's (EU) production, reported only 1.39 thousand tonnes of CMM emissions. This figure is in stark contrast to independent studies, which imply that the real emissions could be 28 to 220 times the reported amount, adding up to an estimated 300,000 tonnes of methane annually. Ember's own analysis estimates Germany’s annual CMM emissions to be approximately 256,000 tonnes, a number which is supported by satellite data showing methane concentrations as high as 34 parts per billion (ppb) over certain mining areas. The report underscores the need for Germany to update its emission reporting practices, especially in light of the upcoming EU Methane Regulation.[93]
Permafrost thawing
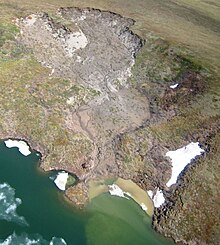
Permafrost contains almost twice as much carbon as the atmosphere,[94] with ~20 Gt of permafrost-associated methane trapped in methane clathrates.[95] Permafrost thaw results in the formation of thermokarst lakes in ice-rich yedoma deposits.[96] Methane frozen in permafrost is slowly released as permafrost melts.[97] Radiocarbon dating of trace methane in lake bubbles and soil organic carbon concluded that 0.2 to 2.5 Pg of permafrost carbon has been released as methane and carbon dioxide over the last 60 years.[98] The 2020 heat wave may have released significant methane from carbonate deposits in Siberian permafrost.[99]
Methane emissions by the 'permafrost carbon feedback' -- amplification of surface warming due to enhanced radiative forcing by carbon release from permafrost—could contribute an estimated 205 Gt of carbon emissions, leading up to 0.5 °C (0.9 °F) of additional warming by the end of the 21st century.[100] However, recent research based on the carbon isotopic composition of atmospheric methane trapped in bubbles in Antarctic ice suggests that methane emissions from permafrost and methane hydrates were minor during the last deglaciation, suggesting that future permafrost methane emissions may be lower than previously estimated.[101]
Methane gas from methane clathrates

At high pressures, such as are found on the bottom of the ocean, methane forms a solid clathrate with water, known as methane hydrate. An unknown, but possibly very large quantity of methane is trapped in this form in ocean sediments.
Theories suggest that should global warming cause them to heat up sufficiently, all of this methane gas could again be released into the atmosphere. Since methane gas is twenty-five times stronger (for a given weight, averaged over 100 years) than CO
2 as a greenhouse gas; this would immensely magnify the greenhouse effect.
The 2021 IPCC Sixth Assessment Report (AR6) Working Group 1 report said that it was "very unlikely that gas clathrates (mostly methane) in deeper terrestrial permafrost and subsea clathrates will lead to a detectable departure from the emissions trajectory during this century".[52]: 5
Methane slip from gas engines
The use of natural gas and biogas in internal combustion engines for such applications as electricity production, cogeneration and heavy vehicles or marine vessels such as LNG carriers using the boil off gas for propulsion, emits a certain percentage of unburned hydrocarbons of which 85% is methane. The climate issues of using gas to fuel internal combustion engines may offset or even cancel out the advantages of less CO2 and particle emissions is described in this 2016 EU Issue Paper on methane slip from marine engines: "Emissions of unburnt methane (known as the 'methane slip') were around 7 g per kg LNG at higher engine loads, rising to 23–36 g at lower loads. This increase could be due to slow combustion at lower temperatures, which allows small quantities of gas to avoid the combustion process". Road vehicles run more on low load than marine engines causing relatively higher methane slip.
Release of stored arctic methane due to global warming
Global warming due to fossil fuel emissions has caused Arctic methane release, i.e. the release of methane from seas and soils in permafrost regions of the Arctic. Although in the long term, this is a natural process, methane release is being exacerbated and accelerated by global warming. This results in negative effects, as methane is itself a powerful greenhouse gas.
The Arctic region is one of the many natural sources of the greenhouse gas methane.[102] Global warming accelerates its release, due to both release of methane from existing stores, and from methanogenesis in rotting biomass.[103] Large quantities of methane are stored in the Arctic in natural gas deposits, permafrost, and as undersea clathrates. Permafrost and clathrates degrade on warming,[104] thus large releases of methane from these sources may arise as a result of global warming.[105][106][107] Other sources of methane include submarine taliks, river transport, ice complex retreat, submarine permafrost and decaying gas hydrate deposits.[108]
Global methane emissions monitoring

The Tropospheric Monitoring Instrument aboard the European Space Agency's Sentinel-5P spacecraft launched in October 2017 provides the most detailed methane emissions monitoring which is publicly available. It has a resolution of about 50 square kilometres.[109]
MethaneSAT is under development by the Environmental Defense Fund in partnership with researchers at Harvard University, to monitor methane emissions with an improved resolution of 1 kilometer. MethaneSAT is designed to monitor 50 major oil and gas facilities, and could also be used for monitoring of landfills and agriculture. It receives funding from Audacious Project (a collaboration of TED and the Gates Foundation), and is projected to launch as soon as 2024.[110]
In 2023, 12 satellites were deployed by GHGSat for monitoring methane emissions.[111]
Uncertainties in methane emissions, including so-called "super-emitter" fossil extractions[112] and unexplained atmospheric fluctuations,[113] highlight the need for improved monitoring at both regional and global scale. Satellites have recently begun to come online with capability to measure methane and other more powerful greenhouse gases with improving resolution.[114][115][116]
The Tropomi[117] instrument on Sentinel-5 launched in 2017 by the European Space Agency can measure methane, sulphur dioxide, nitrogen dioxide, carbon monoxide, aerosol, and ozone concentrations in earth's troposphere at resolutions of several kilometers.[112][118][119] In 2022, a study using data from the instrument monitoring large methane emissions worldwide was published; 1,200 large methane plumes were detected over oil and gas extraction sites.[120] NASA's EMIT instrument also identified super-emitters.[121] A 50% increase was observed in large methane emissions events detected by satellites in 2023 compared to 2022.[122]
Japan's GOSAT-2 platform launched in 2018 provides similar capability.[123]
The Claire satellite launched in 2016 by the Canadian firm GHGSat uses data from Tropomi to home in on sources of methane emissions as small as 15 m2.[114]
Other satellites are planned that will increase the precision and frequency of methane measurements, as well as provide a greater ability to attribute emissions to terrestrial sources. These include MethaneSAT, expected to be launched in 2022, and CarbonMapper.
Global maps combining satellite data to help identify and monitor major methane emission sources are being built.[124][125][126]
The International Methane Emissions Observatory was created by the UN.
Quantifying the global methane budget
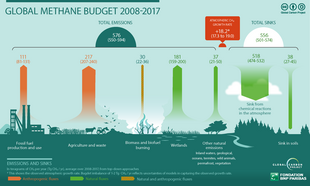
In order to mitigate climate change, scientists have been focusing on quantifying the global methane CH4 budget as the concentration of methane continues to increase—it is now second after carbon dioxide in terms of climate forcing.[127] Further understanding of atmospheric methane is necessary in "assessing realistic pathways" towards climate change mitigation.[127] Various research groups give the following values for methane emissions:
| Reference: | Fung et al. (1991)[128] | Hein et al. (1997)[128] | Lelieveld et al. (1998)[128] | Houweling et al. (1999)[128] | Bousquet et al. (2006)[129] | Saunois et al. (2016)[130] | Saunois et al. (2020)[131] |
|---|---|---|---|---|---|---|---|
| Base year: | 1980s | – | 1992 | – | – | 2003–2012 | 2008-2017 |
| Natural sources | |||||||
| Wetlands | 115 | 237 | 225[nb 1] | 145 | 147±15 | 167 (127–202) | 181 (159-200) |
| Termites | 20 | – | 20 | 20 | 23±4 | 64 (21–132) | 37 (21–50) |
| Ocean | 10 | – | 15 | 15 | 19±6 | ||
| Hydrates | 5 | – | 10 | – | – | ||
| Anthropogenic sources | |||||||
| Energy | 75 | 97 | 110 | 89 | 110±13 | 105 (77–133) | 111 (81-131) |
| Landfills | 40 | 35 | 40 | 73 | 55±11[nb 2] | 188 (115-243) | 217 (207-240) |
| Ruminants (livestock) | 80 | 90[nb 3] | 115 | 93 | |||
| Waste treatment | – | [nb 3] | 25 | – | [nb 2] | ||
| Rice agriculture | 100 | 88 | [nb 1] | – | 31±5 | ||
| Biomass burning | 55 | 40 | 40 | – | 50±8 | 34 (15–53) | 30 (22-36) |
| Other | – | – | – | 20 | 90±14[nb 4] | ||
| Sinks | |||||||
| Soils | 10 | 30 | 40 | 21±3 | 33 (28–38) | 38 (27-45) | |
| Tropospheric OH | 450 | 489 | 510 | 448±1 | 515 | 518 (474–532) | |
| Stratospheric loss | 46 | 40 | 37±1 | ||||
| Source versus sink imbalance | |||||||
| Total source | 500 | 587 | 600 | 525±8 | 558 (540–568) | 576 (550-594) | |
| Total sink | 460 | 535 | 580 | 506 | 548 | 556 (501–574) | |
National reduction policies

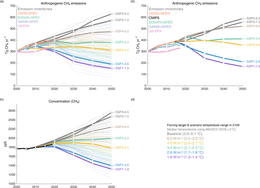
China implemented regulations requiring coal plants to either capture methane emissions or convert methane into CO2 in 2010. According to a Nature Communications paper published in January 2019, methane emissions instead increased 50 percent between 2000 and 2015.[132][133]
In March 2020, Exxon called for stricter methane regulations, which would include detection and repair of methane leaks, minimization of venting and releases of unburned methane, and reporting requirements for companies.[134] However, in August 2020, the U.S. Environmental Protection Agency rescinded a prior tightening of methane emission rules for the U.S. oil and gas industry.[135][136]

Approaches to reduce emissions
Natural gas industries
About 40% of methane emissions from the fossil fuel industry could be "eliminated at no net cost for firms", according to the International Energy Agency (IEA) by using existing technologies.[15] Forty percent represents 9% of all human methane emissions.[15]
To reduce emissions from the natural gas industries, the EPA developed the Natural Gas STAR Program, also known as Gas STAR.[84]
The Coalbed Methane Outreach Program (CMOP) helps and encourages the mining industry to find ways to use or sell methane that would otherwise be released from the coal mine into the atmosphere.[84]
In 2023, the European Union agreed to legislation that will require fossil fuel companies to monitor and report methane leaks and to repair them within a short time period. The law also compels remediation of methane venting and methane flaring. The United States and China stated that they will include methane reduction targets in their next climate plans but have not enacted rules that would compel monitoring, reporting or repair of methane leaks.[138]
Livestock
In order to counteract the amount of methane that ruminants give off, a type of drug called monensin (marketed as rumensin) has been developed. This drug is classified as an ionophore, which is an antibiotic that is naturally produced by a harmless bacteria strain. This drug not only improves feed efficiency but also reduces the amount of methane gas emitted from the animal and its manure.[139]
In addition to medicine, specific manure management techniques have been developed to counteract emissions from livestock manure. Educational resources have begun to be provided for small farms. Management techniques include daily pickup and storage of manure in a completely closed off storage facility that will prevent runoff from making it into bodies of water. The manure can then be kept in storage until it is either reused for fertilizer or taken away and stored in an offsite compost. Nutrient levels of various animal manures are provided for optimal use as compost for gardens and agriculture.[140]
Crops and soils
In order to reduce effects on methane oxidation in soil, several steps can be taken. Controlling the usage of nitrogen enhancing fertilizer and reducing the amount of nitrogen pollution into the air can both lower inhibition of methane oxidation. Additionally, using drier growing conditions for crops such as rice and selecting strains of crops that produce more food per unit area can reduce the amount of land with ideal conditions for methanogenesis. Careful selection of areas of land conversion (for example, plowing down forests to create agricultural fields) can also reduce the destruction of major areas of methane oxidation.[citation needed]
Landfills
To counteract methane emissions from landfills, on March 12, 1996, the EPA (Environmental Protection Agency) added the "Landfill Rule" to the Clean Air Act. This rule requires large landfills that have ever accepted municipal solid waste, have been used as of November 8, 1987, can hold at least 2.5 million metric tons of waste with a volume greater than 2.5 million cubic meters, and/or have nonmethane organic compound (NMOC) emissions of at least 50 metric tons per year to collect and combust emitted landfill gas.[141] This set of requirements excludes 96% of the landfills in the USA. While the direct result of this is landfills reducing emission of non-methane compounds that form smog, the indirect result is reduction of methane emissions as well.
In an attempt to absorb the methane that is already being produced from landfills, experiments in which nutrients were added to the soil to allow methanotrophs to thrive have been conducted. These nutrient supplemented landfills have been shown to act as a small scale methane sink, allowing the abundance of methanotrophs to sponge the methane from the air to use as energy, effectively reducing the landfill's emissions.[142]
See also
Notes
References
External links
- "Main sources of methane emissions". What's Your Impact. 2014-03-14. Retrieved 2018-03-06.
- "Greenhouse Gas Emissions - Methane Emissions". EIA. 2011-03-31. Retrieved 2018-03-06.