Durango is a state in Northwest Mexico that is divided into 39 municipalities.[1] According to the 2020 Mexican census, Durango is the 25th most populous state with 1,832,650 inhabitants, but the 4th largest by land area spanning 123,575.36 square kilometres (47,712.71 sq mi).[1][2] Durango has a population density of 14.8/km2 (38.4/sq mi), making it Mexico's second-lowest dense state, after Baja California Sur.[1][2]
.svg)
Municipalities in Durango are administratively autonomous of the state according to the 115th article of the 1917 Constitution of Mexico.[3] Every three years, citizens elect a municipal president (Spanish: presidente municipal) by a plurality voting system who heads a concurrently elected municipal council (ayuntamiento) responsible for providing all the public services for their constituents. The municipal council consists of a variable number of trustees and councillors (regidores y síndicos).[4] Municipalities are responsible for public services (such as water and sewerage), street lighting, public safety, traffic, and the maintenance of public parks, gardens and cemeteries.[5] They may also assist the state and federal governments in education, emergency fire and medical services, environmental protection and maintenance of monuments and historical landmarks. Since 1984, they have had the power to collect property taxes and user fees, although more funds are obtained from the state and federal governments than from their own income.[5]
The largest municipality by population is the state capital Durango, with 688,697 residents or approximately 35.7% of the state population.[1] The smallest municipality by population is San Pedro del Gallo with 1,633 residents.[1] The largest municipality by land area is also Durango which spans 9,306.43 km2 (3,593.23 sq mi), and the smallest is Vicente Guerrero which spans 370.56 km2 (143.08 sq mi).[2] Most municipalities were incorporated upon the division of the state of Durango into municipal units by the Constitución Política del Estado Libre de Durango on September 1, 1825, shortly after the state was admitted to the Union of Mexico.[6] The most recent municipality to incorporate is Nuevo Ideal, on January 1, 1989.[6]
Municipalities
- Largest municipalities in Durango by population
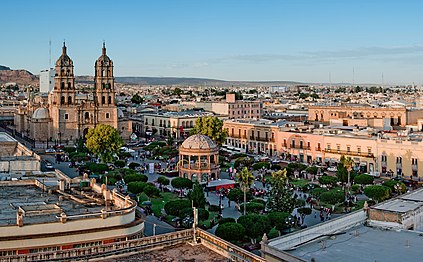 Durango, capital and largest municipality in the state.
 Gómez Palacio, second largest municipality.
 Lerdo, third largest municipality.


| Name | Municipal seat | Population (2020)[1] | Population (2010)[7] | Change | Land area[2] | Population density (2020) | Incorporation date[6] | |
|---|---|---|---|---|---|---|---|---|
| km2 | sq mi | |||||||
| Canatlán | Ciudad Canatlán | 31,454 | 31,401 | +0.2% | 3,499.56 | 1,351.19 | 9.0/km2 (23.3/sq mi) | September 1, 1825 |
| Canelas | Canelas | 4,321 | 4,122 | +4.8% | 894.41 | 345.33 | 4.8/km2 (12.5/sq mi) | September 1, 1825 |
| Coneto de Comonfort | Coneto de Comonfort | 4,084 | 4,530 | −9.8% | 1,076.71 | 415.72 | 3.8/km2 (9.8/sq mi) | September 1, 1825 |
| Cuencamé | Cuencamé de Ceniceros | 34,955 | 33,664 | +3.8% | 5,360.82 | 2,069.82 | 6.5/km2 (16.9/sq mi) | September 1, 1825 |
| Durango† | Victoria de Durango | 688,697 | 582,267 | +18.3% | 9,306.43 | 3,593.23 | 74.0/km2 (191.7/sq mi) | September 1, 1825 |
| El Oro | Santa María del Oro | 10,384 | 11,320 | −8.3% | 3,537.05 | 1,365.66 | 2.9/km2 (7.6/sq mi) | September 1, 1825 |
| General Simón Bolívar[a] | General Simón Bolívar | 10,038 | 10,629 | −5.6% | 2,193.97 | 847.10 | 4.6/km2 (11.8/sq mi) | March 14, 1867 |
| Gómez Palacio | Gómez Palacio | 372,750 | 327,985 | +13.6% | 844.07 | 325.90 | 441.6/km2 (1,143.8/sq mi) | December 20, 1905 |
| Guadalupe Victoria | Ciudad Guadalupe Victoria | 36,695 | 34,052 | +7.8% | 1,320.00 | 509.65 | 27.8/km2 (72.0/sq mi) | April 1, 1936 |
| Guanaceví | Guanaceví | 9,869 | 10,149 | −2.8% | 5,448.23 | 2,103.57 | 1.8/km2 (4.7/sq mi) | September 1, 1825 |
| Hidalgo[b] | Villa Hidalgo | 3,843 | 4,265 | −9.9% | 4,698.54 | 1,814.12 | 0.8/km2 (2.1/sq mi) | September 1, 1825 |
| Indé | Indé | 4,748 | 5,280 | −10.1% | 2,510.02 | 969.12 | 1.9/km2 (4.9/sq mi) | September 1, 1825 |
| Lerdo | Ciudad Lerdo | 163,313 | 141,043 | +15.8% | 2,152.00 | 830.89 | 75.9/km2 (196.6/sq mi) | September 1, 1825 |
| Mapimí | Mapimí | 26,932 | 25,137 | +7.1% | 7,744.60 | 2,990.21 | 3.5/km2 (9.0/sq mi) | September 1, 1825 |
| Mezquital | Mezquital | 48,583 | 33,396 | +45.5% | 8,393.79 | 3,240.86 | 5.8/km2 (15.0/sq mi) | September 1, 1825 |
| Nazas | Nazas | 12,894 | 12,411 | +3.9% | 2,392.35 | 923.69 | 5.4/km2 (14.0/sq mi) | September 1, 1825 |
| Nombre de Dios | Nombre de Dios | 19,060 | 18,488 | +3.1% | 1,188.60 | 458.92 | 16.0/km2 (41.5/sq mi) | September 1, 1825 |
| Nuevo Ideal | Nuevo Ideal | 27,981 | 26,092 | +7.2% | 1,855.56 | 716.44 | 15.1/km2 (39.1/sq mi) | January 1, 1989 |
| Ocampo[c] | Villa Ocampo | 8,003 | 9,626 | −16.9% | 3,650.61 | 1,409.51 | 2.2/km2 (5.7/sq mi) | September 1, 1825 |
| Otáez | Otáez | 4,924 | 5,208 | −5.5% | 1,713.58 | 661.62 | 2.9/km2 (7.4/sq mi) | November 8, 1853 |
| Pánuco de Coronado | Francisco I. Madero | 12,656 | 11,927 | +6.1% | 1,028.42 | 397.08 | 12.3/km2 (31.9/sq mi) | November 21, 1847 |
| Peñón Blanco | Peñón Blanco | 11,118 | 10,473 | +6.2% | 1,687.19 | 651.43 | 6.6/km2 (17.1/sq mi) | September 1, 1825 |
| Poanas | Villa Unión | 25,623 | 24,918 | +2.8% | 1,130.02 | 436.30 | 22.7/km2 (58.7/sq mi) | November 21, 1847 |
| Pueblo Nuevo | El Salto | 51,269 | 49,162 | +4.3% | 6,960.77 | 2,687.57 | 7.4/km2 (19.1/sq mi) | September 1, 1825 |
| Rodeo | Rodeo | 12,818 | 12,788 | +0.2% | 1,435.87 | 554.39 | 8.9/km2 (23.1/sq mi) | February 1, 1859 |
| San Bernardo | San Bernardo | 2,837 | 3,433 | −17.4% | 2,311.52 | 892.48 | 1.2/km2 (3.2/sq mi) | September 1, 1825 |
| San Dimas | Tayoltita | 17,333 | 19,691 | −12.0% | 5,495.44 | 2,121.80 | 3.2/km2 (8.2/sq mi) | September 1, 1825 |
| San Juan de Guadalupe | San Juan de Guadalupe | 5,251 | 5,947 | −11.7% | 2,414.87 | 932.39 | 2.2/km2 (5.6/sq mi) | November 14, 1847 |
| San Juan del Río | San Juan del Río | 12,013 | 11,855 | +1.3% | 1,402.41 | 541.47 | 8.6/km2 (22.2/sq mi) | September 1, 1825 |
| San Luis del Cordero | San Luis del Cordero | 2,103 | 2,181 | −3.6% | 605.98 | 233.97 | 3.5/km2 (9.0/sq mi) | April 11, 1867 |
| San Pedro del Gallo | San Pedro del Gallo | 1,633 | 1,709 | −4.4% | 1,800.49 | 695.17 | 0.9/km2 (2.3/sq mi) | September 1, 1825 |
| Santa Clara | Santa Clara | 6,727 | 7,003 | −3.9% | 987.43 | 381.25 | 6.8/km2 (17.6/sq mi) | March 14, 1867 |
| Santiago Papasquiaro | Santiago Papasquiaro | 49,207 | 44,966 | +9.4% | 6,416.25 | 2,477.33 | 7.7/km2 (19.9/sq mi) | September 1, 1825 |
| Súchil | Súchil | 6,917 | 6,761 | +2.3% | 1,471.77 | 568.25 | 4.7/km2 (12.2/sq mi) | November 21, 1847 |
| Tamazula | Tamazula de Victoria | 26,300 | 26,368 | −0.3% | 5,812.84 | 2,244.35 | 4.5/km2 (11.7/sq mi) | September 1, 1825 |
| Tepehuanes | Santa Catarina de Tepehuanes | 11,378 | 10,745 | +5.9% | 6,081.34 | 2,348.02 | 1.9/km2 (4.8/sq mi) | September 1, 1825 |
| Tlahualilo | Tlahualilo de Zaragoza | 21,143 | 22,244 | −4.9% | 4,750.33 | 1,834.11 | 4.5/km2 (11.5/sq mi) | November 22, 1936 |
| Topia | Topia | 9,320 | 8,581 | +8.6% | 1,630.96 | 629.72 | 5.7/km2 (14.8/sq mi) | September 1, 1825 |
| Vicente Guerrero | Vicente Guerrero | 23,476 | 21,117 | +11.2% | 370.56 | 143.08 | 63.4/km2 (164.1/sq mi) | January 1, 1953 |
| Durango | — | 1,832,650 | 1,632,934 | +12.2% | 123,575.36 | 47,712.71 | 14.8/km2 (38.4/sq mi) | — |
| Mexico | — | 126,014,024 | 112,336,538 | +12.2% | 1,972,550 | 761,606 | 63.9/km2 (165.5/sq mi) | — |