These are galleries removed from the article.
First batch
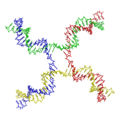
Examples of DNA molecular models
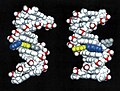
Animated molecular models allow one to visually explore the three-dimensional (3D) structure of DNA. The first DNA model is a space-filling, or CPK, model of the DNA double-helix whereas the third is an animated wire, or skeletal type, molecular model of DNA. The last two DNA molecular models in this series depict quadruplex DNA that may be involved in certain cancers[1][2]. The last figure on this panel is a molecular model of hydrogen bonds between water molecules in ice that are similar to those found in DNA.


Images for DNA structure determination from X-ray patterns
The following images illustrate both the principles and the main steps involved in generating structural information from X-ray diffraction studies of oriented DNA fibers with the help of molecular models of DNA that are combined with crystallographic and mathematical analysis of the X-ray patterns. From left to right the gallery of images shows:
- First row:
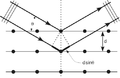
- 1. Constructive X-ray interference, or diffraction, following Bragg's Law of X-ray "reflection by the crystal planes";
- 2. A comparison of A-DNA (crystalline) and highly hydrated B-DNA (paracrystalline) X-ray diffraction, and respectively, X-ray scattering patterns (courtesy of Dr. Herbert R. Wilson, FRS- see refs. list);
- 3. Purified DNA precipitated in a water jug;
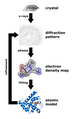
- 4. The major steps involved in DNA structure determination by X-ray crystallography showing the important role played by molecular models of DNA structure in this iterative, structure--determination process;
- Second row:
- 5. Photo of a modern X-ray diffractometer employed for recording X-ray patterns of DNA with major components: X-ray source, goniometer, sample holder, X-ray detector and/or plate holder;
- 6. Illustrated animation of an X-ray goniometer;
- 7. X-ray detector at the SLAC synchrotron facility;
- 8. Neutron scattering facility at ISIS in UK;
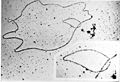
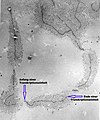
- Third and fourth rows: Molecular models of DNA structure at various scales; figure #11 is an actual electron micrograph of a DNA fiber bundle, presumably of a single bacterial chromosome loop.


Gallery: DNA molecular modeling applications
The following gallery of images illustrates various uses of DNA molecular modeling in Genomics and Biotechnology research applications from DNA repair to PCR and DNA nanostructures; each slide contains its own explanation and/or details. The first slide presents an overview of DNA applications, including DNA molecular models, with emphasis on Genomics and Biotechnology.
- First row images present a DNA biochip and DNA nanostructures designed for DNA computing and other dynamic applications of DNA nanotechnology; last image in this row is of DNA arrays that display a representation of the Sierpinski gasket on their surfaces.
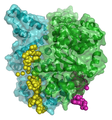
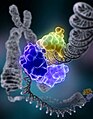
- Second row: the first two images show computer molecular models of RNA polymerase, followed by that of an E. coli, bacterial DNA primase template suggesting very complex dynamics at the interfaces between the enzymes and the DNA template; the fourth image illustrates in a computed molecular model the mutagenic, chemical interaction of a potent carcinogen molecule with DNA, and the last image shows the different interactions of specific fluorescence labels with DNA in human and orangoutan chromosomes.


Gallery of AFM images


- File:AFM view of sodium chloride.gif


Gallery: CARS (Raman spectroscopy), fluorescence confocal microscopy, and hyperspectral imaging


Mass spectrometry—Maldi informatics

Second batch
Gallery 1: Illustration of the molecular modeling and X-ray data collection steps involved in the determination of DNA molecular structures
- File:Fig.1. Purified DNA precipitated in a water jug.

- File:Fig.2. The major steps involved in DNA structure determination by X-ray crystallography showing the important role played by molecular models of DNA structure in this iterative process.
- File:Fig.3. Diagram illustrating the Bragg Law of X-ray diffraction. Constructive X-ray interference, or diffraction, following Bragg's Law of X-ray "''reflection by the crystal planes''"
- File:Fig.4A. Photo of a modern X-Ray Diffractometer used to record X-ray patterns.

- File:Fig.4B. Animation of a Kappa goniometer operation in the X-Ray Diffractometer.
- File:Fig.5. A- and B- DNA X-ray patterns obtained from oriented and hydrated DNA fibers (courtesy of Dr. Herbert R. Wilson, FRS- see refs. list) with the instrument shown in Fig.4

- File:Fig.6. An oversimplified sketch of the double-helix structure of A-DNA.

- File:Fig.7. A model of DNA replication based on the double-helix concept.

- File:Fig.8A. The A-DNA double-helix molecular model of Crick and Watson (consistent with X-ray data in Fig.5) for which they received a Nobel prize together with M.H.F. Wilkins.

- File:Fig.8B. Animated, space-filling moelcular model of the A-DNA double helix

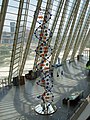
- File:Fig.8C. A large-scale Crick-Watson DNA Model shown in the Museum of Príncipe Felipe.
- File:Fig.9. Electron micrograph (magnified image) of a DNA fiber bundle, presumably of a single bacterial chromosome loop.
- File:Fig.10. Side view of molecular models of A- , B-, Z- DNA.

- File:Fig.11. Oversimplified model of the A-DNA double-helix.

- File:Figs.12A and 12B. Advanced instruments (spectrometers) and facilities for collecting X-ray and neutron structural data for DNA.

Gallery 2: DNA molecular modeling applications in Genomics and Biotehnology
- File:Fig.1. Pictorial Overview of DNA molecular modeling applications in Genomics and Biotehnology

- File:Fig.2. Molecular modeling of RNA Polymerase.

- File:Fig.3. Molecular modeling of a bacterial DNA Primase Template.
- File:Fig.4. Molecular modeling of DNA interactions with the carcinogen molecule MGMT.

- File:Fig.5. 3D Molecular model of DNA damaged by carcinogenic 2-aminofluorene(AF).
- File:Fig.6. Molecular modeling of DNA repair
- File:Fig.7. Animated skeletal model of A-DNA.

- File:Fig.8. Electron micrograph of a bacterial DNA plasmid (chromosome fragment).

- File:Fig.9. Simplified model of Circular DNA supercoiling.

- File:Fig.10. Simplified models of chromatin.

- File:Fig.11. Simplified model of chromosome structure.

- File:Fig.12. Comparison of fluorescence labelled orangutan and human chromosomes

- File:Fig.13. Cellular DNA during prophase
- File:File.14. Merging chromosomes

- File:Fig.15. A simplified representation of Translation and Transcription in a Living Cell.

- File:Fig.16. Electron micrograph of the ribosomal transcription process.
- File:Fig.17. Technology for Chromosome Conformation Capture.

- File:Fig.18. The involvement of mitochondrial DNA in several human diseases.

- File:Fig.19. The steps in the Polymerase Chain Reaction (PCR) technique for DNA amplification

- File:Fig.20. A PCR gel.

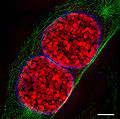
- File:Fig.21. An image of a Human cancer cell dividing, taken with an epifluorescence microscope; the cell was fixed after staining with DAPI for DNA in blue, with GFP-INCENP in green, and cell tubulin in red.

- File:Fig.22. SFP discovery principle for gene probing

- File:Fig.23. c-DNA Array Chip for gene probing.

- File:Fig.24. Fluorescence microscopy of DNA Expression in the Human Wild-Type and P239S Mutant Palladin.

- File:Fig.25. Gene Co-dominance in a Rhododendron flower.

- File:Fig.26 Fluorescence microscopy images of sun flares pathology in a blood cell showing the affected areas in red.

- File:Fig.27. DNA Biochip for DNA computing.

- File:Fig.28. An atomic force microscope (AFM) image of a self-assembled DNA nanogrid. Individual DNA tiles self-assemble into a highly ordered DNA 2D-nanogrid that might be utilized for computing.
-
