In the United States, presidential job approval ratings were first conducted by George Gallup (estimated to be 1937) to gauge public support for the president of the United States during their term. An approval rating is a percentage determined by polling which indicates the percentage of respondents to an opinion poll who approve of a particular person or program. Typically, an approval rating is given to a politician based on responses to a poll in which a sample of people are asked whether they approve or disapprove of that particular political figure. A question might ask: "Do you approve or disapprove of the way that the current president is handling their job as president?".[1]
Like most surveys that measure opinions, individual poll results may be inaccurate. Many unscientific approval rating systems exist that show inaccurate statistics. Examples that self select, such as online questions are of this type; however, the aggregate approval rating is generally accepted by statisticians as a statistically valid indicator of the comparative changes in the popular United States mood regarding a president.
George W. Bush registered a 90% job approval rating (the highest in Gallup's tracking) shortly after the September 11, 2001, terrorist attacks.[2] Harry Truman registered a 22% job approval rating (the lowest in Gallup's tracking) in a Feb. 9-14, 1952, Gallup poll.[3]
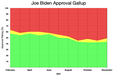
President Joe Biden's approval ratings
| Source of poll aggregation | Polls included | Dates administered | Dates updated | Approval | Disapproval | Unsure/no opinion[a] | Net |
|---|---|---|---|---|---|---|---|
| FiveThirtyEight[4] | All polls | until January 10, 2023 | January 11, 2023 | 43.0% | 52.0% | 5.0% | -9.0% |
| RealClearPolitics[5] | All polls | until January 10, 2023 | January 11, 2023 | 44.6% | 50.6% | 4.2% | -6.0% |
majority approve plurality approve plurality disapprove majority disapprove
| Polling group | Date | Sample size[b] | Margin of error | Approval | Disapproval | Unsure/no opinion | Net |
|---|---|---|---|---|---|---|---|
| ABC News\Washington Post[6] | April 28–May 3, 2023 | 1,006 (A) | ±0.5% | 36% | 56% | 8% | −20 |
| NORC[7] | March 16–20, 2023 | 1,081 (A) | ±2.739% | 38% | 61% | 1% | −23 |
| Léger[8] | February 4–6, 2022 | 1,005 (A) | ±3.09% | 42% | 55% | 3% | −13 |
| Rasmussen Reports/Pulse Opinion Research (R)[9] | February 9, 2022 | 1,500 (RV) | ±3.0% | 40% | 58% | 2% | –18 |
| Morning Consult[10] | February 3–9, 2022 | 45,000 (A) | ±2.03% | 41% | 51% | 8% | −9 [c] |
| Ipsos[11] | February 7–8, 2022 | 1,005 (A) | ±3.8% | 43% | 51% | 6% | -8 |
| YouGov (for The Economist)[12] | February 19–22, 2022 | 1,500 (A) | ±2.9% | 41% | 49% | 10% | -11 |
| Suffolk University (for USA Today)[13] | December 27–30, 2021 | 1,000 (RV) | ±3.1% | 40% | 54% | 2% | −14 |
| RMG Research (for Scott Rasmussen) (R)[14] | January 18–19, 2022 | 1,200 (RV) | ±2.8% | 42% | 52% | 7%[d] | -10 |
| HarrisX (for The Hill)[15] | February 23–24, 2021 | 1,815 (RV) | [e] | 38% | 54% | 8% | -15 |
Historical comparison
| Order | President | Highest approval | Lowest approval | High – Low | Highest disapproval | Lowest disapproval | Highest margin | Lowest margin | Final poll | Approval average[16] | Polls per year |
|---|---|---|---|---|---|---|---|---|---|---|---|
| 46[19] | Joe Biden | 57 (2021-02-02, 2021-04-21)[20] | 37 (2023-04-25, 2023-10-23, 2023-11-21) | 20 | 59 (2022-07-26, 2023-04-25, 2023-10-23, 2023-11-21, 2023-12-20, 2024-02-20) | 37 (2021-02-02) | 20 (2021-02-02) | −22 (2023-04-25, 2023-10-23, 2023-11-21) | N/A | N/A | N/A |
| 45[21] | Donald Trump | 49 (2020-01-29, 2020-02-16, 2020-03-22, 2020-04-28, 2020-05-13) | 34 (2021-01-15) | 15 | 62 (2021-01-15) | 45 (2017-01-22, 2020-03-22)[22] | 4 (2020-03-22) | −28 (2021-01-15) | 34 (2021-01-15) | 41 | 40 |
| 44[23] | Barack Obama | 69 (2009-01-24) | 38 (2014-09-05) | 31 | 57 (2014-10-10) | 12 (2009-01-23) | 56 (2009-01-23, 2009-01-24) | −18 (2014-10-10) | 59 (2017-01-19) | 48 | 48.4 |
| 43[24] | George W. Bush | 90 (2001-09-21) | 25 (2008-10-05, 2008-10-12, 2008-11-02) | 65 | 71 (2008-10-10) | 6 (2001-09-22) | 83 (2001-09-22) | −46 (2008-10-12) | 34 (2009-01-11) | 49 | 33.7 |
| 42[25] | Bill Clinton | 73 (1998-12-19) | 37 (1993-06-06) | 36 | 54 (1994-09-07) | 20 (1993-01-26) | 48 (2000-12-19) | −14 (1994-09-07) | 66 (2001-01-14) | 55 | 28.5 |
| 41[26] | George H. W. Bush | 89 (1991-02-28) | 29 (1992-08-02) | 60 | 60 (1992-07-31) | 6 (1989-01-26) | 82 (1991-03-03) | −30 (1992-08-02, 1992-10-13) | 56 (1993-01-11) | 61 | 39.5 |
| 40[27] | Ronald Reagan | 68 (1986-05-19) | 35 (1983-01-31) | 33 | 56 (1983-01-31) | 13 (1981-02-02) | 49 (1981-04-06) | −21(1983-01-31) | 63 (1988-12-29) | 53 | 37.0 |
| 39[28] | Jimmy Carter | 75 (1977-03-21) | 28 (1979-07-02) | 47 | 59 (1979-07-02) | 8 (1977-02-07, 1977-03-02) | 66 (1977-03-15) | −31 (1979-07-02) | 34 (1980-12-08) | 46 | 22.7 |
| 38[29] | Gerald Ford | 71 (1974-08-19) | 37 (1975-03-31) | 34 | 48 (1975-03-31) | 3 (1974-08-19) | 67 (1974-08-13) | −11 (1975-03-31) | 53 (1976-12-13) | 47 | 14.7 |
| 37[30] | Richard Nixon | 67 (1969-11-17, 1973-01-29) | 24 (1974-07-15, 1974-07-26, 1974-08-05) | 43 | 66 (1974-08-05) | 5 (1969-01-28) | 57 (1969-03-17) | −42 (1974-08-05) | 24 (1974-08-05) | 49 | 17.7 |
| 36[31] | Lyndon B. Johnson | 79 (1964-03-05) | 35 (1968-08-12) | 44 | 52 (1968-08-12) | 2 (1963-12-10) | 75 (1963-12-10) | −18 (1968-08-12) | 49 (1969-01-06) | 55 | 15.3 |
| 35[32] | John F. Kennedy | 82 (1961-05-03, 1961-06-06) | 56 (1963-09-17) | 26 | 30 (1963-11-13) | 5 (1961-04-11) | 77 (1961-05-03) | 27 (1963-09-17) | 58 (1963-11-13) | 70 | 13.7 |
| 34[33] | Dwight Eisenhower | 79 (1956-12-19) | 48 (1958-04-01) | 31 | 36 (1958-04-01) | 7 (1953-02-05) | 66 (1953-04-02, 1956-12-19) | 12 (1958-04-01) | 59 (1960-12-13) | 65 | 14.4 |
| 33[34] | Harry Truman | 87 (1945-06-05) | 22 (1951-11-16, 1952-02-14) | 65 | 67 (1952-01-06) | 3 (1945-06-05) | 85 (1945-08-22) | −43 (1952-01-04) | 32 (1952-12-16) | 45 | 8.4 |
| 32[35] | Franklin D. Roosevelt | 83 (1942-01-23) | 48 (1939-08-18) | 35 | 46 (1938-05-22, 1938-05-29, 1938-11-07) | 73 (1942-01-23) | 65 (1943-12-15) | 63 | 8 |
Approval at the beginning of the presidency
| Order | President | Initial Approval | Initial Disapproval |
|---|---|---|---|
| 46 | Biden | 57 (2021-02-02) | 37 (2021-02-02) |
| 45 | Trump | 45 (2017-01-22) | 45 (2017-01-22) |
| 44 | Obama | 68 (2009-01-23) | 12 (2009-01-23) |
| 43 | G. W. Bush | 57 (2001-02-05) | 25 (2001-02-05) |
| 42 | Clinton | 58 (1993-01-24) | 20 (1993-01-24) |
| 41 | G. H. W. Bush | 51 (1989-01-26) | 6 (1989-01-26) |
| 40 | Reagan | 51 (1981-02-02) | 13 (1981-02-02) |
| 39 | Carter | 66 (1977-01-07) | 8 (1977-01-07) |
| 38 | Ford | 71 (1974-08-19) | 3 (1974-08-19) |
| 37 | Nixon | 59 (1969-01-28) | 5 (1969-01-28) |
| 36 | Johnson | 78 (1963-12-10) | 2 (1963-12-10) |
| 35 | Kennedy | 72 (1961-02-15) | 6 (1961-02-15) |
| 34 | Eisenhower | 68 (1953-02-05) | 7 (1953-02-05) |
| 33 | Truman | 87 (1945-06-05) | 3 (1945-06-05) |
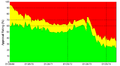
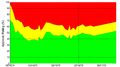
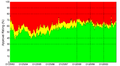
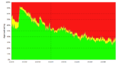
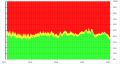
Graphs
- Gallup Poll graphs of approval ratings for former presidents of the United States


See also
Notes
References
External links
- "Historical Presidential Job Performance Ratings". Roper Center.
- "Trump approval ratings" Archived August 12, 2017, at archive.today. FiveThirtyEight.
- "Midterm Presidential Approval Ratings" Archived May 19, 2020, at the Wayback Machine. Data360.
- "President Job Approval Ratings". PresidentPollsUSA.
- "Historical Presidential Approval Ratings 1945–2009". The Wall Street Journal.
- "President Obama's Ongoing Job Approval". (CongressRatings)