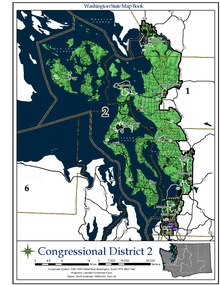
Washington's 2nd congressional district includes all of Island , San Juan , Skagit , and Whatcom counties, as well as coastal western Snohomish County . It stretches from Bellingham and the Canada–US border in the north down to the Skagit /Snohomish county line, with a narrow strip along the coast running down to Lynnwood and the King /Snohomish county line in the south. Since 2001, it has been represented by Democrat Rick Larsen .
Washington's 2nd congressional district Interactive map of district boundaries since January 3, 2023
Representative Population (2022) 782,277 Median household $82,997[1] Ethnicity Cook PVI D+9[2]
Originally created in 1909, when Washington was broken up into districts, the second district was represented by future U.S. Senator Henry M. "Scoop" Jackson between 1941 and 1953. It was a reliably Democratic district for most of the latter half of the 20th century, until the Republican Revolution of 1994, when retiring Rep. Al Swift was replaced by Jack Metcalf . Larsen has represented the district since Metcalf's retirement in 2001. He faced a close re-election in 2002, but was handily re-elected in 2004, and didn't face serious opposition until 2010. In the 2008 election , Larsen easily defeated Republican challenger Rick Bart. In the 2010 election , Larsen narrowly avoided defeat against Republican challenger John Koster .
The district has leaned Democratic in presidential elections since the 1988 election . Al Gore and John Kerry narrowly carried the district in 2000 and 2004 with 48% and 51% of the vote, respectively. In 2008 , Barack Obama won the district by a wide margin, carrying 55.60% of the vote while John McCain received 42%.
Recent presidential election results List of members representing the district Member(District home) Party Years Cong Electoral history District location District established March 4, 1909 Francis W. Cushman (Tacoma )[3] Republican March 4, 1909 – 61st Redistricted from the at-large district re-elected in 1908 . Vacant July 6, 1909 – William W. McCredie (Vancouver )[3] Republican November 2, 1909 – Elected to finish Cushman's term .Stanton Warburton (Tacoma )[3] Republican March 4, 1911 – 62nd Elected in 1910 .Albert Johnson (Hoquiam )[3] Republican March 4, 1913 – 63rd Elected in 1912 .3rd district Lindley H. Hadley (Bellingham )[3] Republican March 4, 1915 – 64th 65th 66th 67th 68th 69th 70th 71st 72nd Elected in 1914 .Re-elected in 1916 .Re-elected in 1918 .Re-elected in 1920 .Re-elected in 1922 .Re-elected in 1924 .Re-elected in 1926 .Re-elected in 1928 .Re-elected in 1930 .Monrad Wallgren (Everett )[3] Democratic March 4, 1933 – 73rd 74th 75th 76th Elected in 1932 .Re-elected in 1934 .Re-elected in 1936 .Re-elected in 1938 .run for U.S. senator and resigned when elected.Vacant December 19, 1940 – 76th Henry M. Jackson (Everett )[3] Democratic January 3, 1941 – 77th 78th 79th 80th 81st 82nd Elected in 1940 .Re-elected in 1942 .Re-elected in 1944 .Re-elected in 1946 .Re-elected in 1948 .Re-elected in 1950 .run for U.S. senator .Jack Westland (Everett )[3] Republican January 3, 1953 – 83rd 84th 85th 86th 87th 88th Elected in 1952 .Re-elected in 1954 .Re-elected in 1956 .Re-elected in 1958 .Re-elected in 1960 .Re-elected in 1962 .Lloyd Meeds (Lake Stevens )[3] Democratic January 3, 1965 – 89th 90th 91st 92nd 93rd 94th 95th Elected in 1964 .Re-elected in 1966 .Re-elected in 1968 .Re-elected in 1970 .Re-elected in 1972 .Re-elected in 1974 .Re-elected in 1976 .Al Swift (Bellingham )[3] Democratic January 3, 1979 – 96th 97th 98th 99th 100th 101st 102nd 103rd Elected in 1978 .Re-elected in 1980 .Re-elected in 1982 .Re-elected in 1984 .Re-elected in 1986 .Re-elected in 1988 .Re-elected in 1990 .Re-elected in 1992 .Jack Metcalf (Langley )[4] Republican January 3, 1995 – 104th 105th 106th Elected in 1994 .Re-elected in 1996 .Re-elected in 1998 .Rick Larsen (Everett )[3] Democratic January 3, 2001 – 107th 108th 109th 110th 111th 112th 113th 114th 115th 116th 117th 118th Elected in 2000 .Re-elected in 2002 .Re-elected in 2004 .Re-elected in 2006 .Re-elected in 2008 .Re-elected in 2010 .Re-elected in 2012 .Re-elected in 2014 .Re-elected in 2016 .Re-elected in 2018 .Re-elected in 2020 .Re-elected in 2022 .2003–2013 2013–2023 2023–present
Recent election results 2010 2012 2014 2016 2018 2020 2022 Historical district boundaries See also References External links .svg)

.jpg)
.jpg)
.jpg)


_(new_version).svg)