The 2012 United States presidential election was the 57th quadrennial presidential election, held on Tuesday, November 6, 2012. Incumbent Democratic President Barack Obama and his running mate, incumbent Vice President Joe Biden, were re-elected to a second term.[3] They defeated the Republican ticket of former Governor Mitt Romney of Massachusetts and Representative Paul Ryan of Wisconsin.
| |||||||||||||||||||||||||||||
538 members of the Electoral College 270 electoral votes needed to win | |||||||||||||||||||||||||||||
|---|---|---|---|---|---|---|---|---|---|---|---|---|---|---|---|---|---|---|---|---|---|---|---|---|---|---|---|---|---|
| Opinion polls | |||||||||||||||||||||||||||||
| Turnout | 58.6%[1] | ||||||||||||||||||||||||||||
| |||||||||||||||||||||||||||||
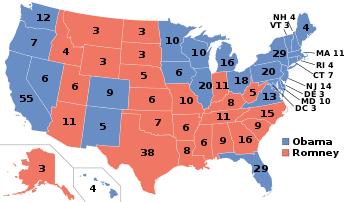 Presidential election results map. Blue denotes states won by Obama/Biden and red denotes those won by Romney/Ryan. Numbers indicate electoral votes cast by each state and the District of Columbia. | |||||||||||||||||||||||||||||
| |||||||||||||||||||||||||||||

As the incumbent president, Obama secured the Democratic nomination without serious opposition. The Republicans experienced a competitive primary. Romney was consistently competitive in the polls and won the support of many party leaders, but he faced challenges from a number of more conservative contenders. Romney secured his party's nomination in May, defeating former senator Rick Santorum, former Speaker of the House Newt Gingrich, and Texas congressman Ron Paul, among other candidates.
The campaigns focused heavily on domestic issues, and debate centered largely around sound responses to the Great Recession. Other issues included long-term federal budget issues, the future of social insurance programs, and the Affordable Care Act, Obama's marquee legislative program. Foreign policy was also discussed, including the end of the Iraq War in 2011, military spending, the Iranian nuclear program, and appropriate counteractions to terrorism. Romney attacked Obama's domestic policies as ineffective and financially insolvent while Obama's campaign sought to characterize Romney as a plutocratic businessman who was out of touch with the average American.[4][5] The campaign was marked by a sharp rise in fundraising, including from nominally independent Super PACs.
Obama defeated Romney, winning a majority of both the Electoral College and the popular vote. Obama won 332 electoral votes and 51.1% of the popular vote compared to Romney's 206 electoral votes and 47.2%.[2] The results of the electoral vote were certified by Congress on January 4, 2013.[6] Obama was the first president since Ronald Reagan in 1984 to win a majority of the national popular vote more than once, and the first Democrat to do so since Franklin D. Roosevelt in 1944. Obama also became only the sixth Democratic president in history to win a second term (Andrew Jackson, Grover Cleveland, Woodrow Wilson, Franklin D. Roosevelt, and Bill Clinton), and the third sitting president in a row (after Clinton and George W. Bush) to win a second term.
Obama did not hold onto Indiana, North Carolina, or Nebraska's 2nd congressional district, but crucially won all 18 "blue wall" states and defeated Romney in other swing states the Republicans had won in 2000 and 2004, most notably Colorado, Florida, Ohio, and Virginia. Ultimately, of the nine swing states identified by The Washington Post in the 2012 election, Obama won eight, losing only North Carolina.[7] This is the most recent presidential election in which the Democratic candidate won the states of Iowa, Ohio, and Florida, along with Maine's 2nd congressional district, the most recent presidential election in which the incumbent president won reelection, and the most recent in which neither major party's ticket included a woman. This was the last election in which a presidential candidate received above 70% of the vote in any state, with Hawaii for Obama and Utah for Romney. This is also the last election in which Trump was not the Republican nominee.
All four major candidates for president and vice president went on to hold significant public office after this election. Obama served his second term as president, while Biden also served his second term as vice president and initially retired from politics but was later elected president in 2020, defeating Obama's successor, then-incumbent Donald Trump. This is the most recent election in which two major party nominees would go on to become president. Romney moved to Utah in 2014 and was elected to the Senate there in 2018, succeeding Orrin Hatch. Ryan served three more terms in the House and eventually became Speaker from 2015 until his retirement from politics in 2019.
State changes to voter registration and electoral rules
In 2011, several state legislatures passed new voting laws, especially pertaining to voter identification, with the stated purpose of combating voter fraud; the laws were attacked, however, by the Democratic Party as attempts to suppress voting among its supporters and to improve the Republican Party's presidential prospects. Florida, Georgia, Ohio,[8] Tennessee, and West Virginia's state legislatures approved measures to shorten early voting periods. Florida and Iowa barred all felons from voting. Kansas, South Carolina,[9] Tennessee, Texas,[10] and Wisconsin[11] state legislatures passed laws requiring voters to have government-issued IDs before they could cast their ballots. This meant, typically, that people without driver's licenses or passports had to gain new forms of ID. Former president Bill Clinton denounced them, saying, "There has never been in my lifetime, since we got rid of the poll tax and all the Jim Crow burdens on voting, the determined effort to limit the franchise that we see today".[12] He was referring to Jim Crow laws passed in southern states near the turn of the twentieth century that disenfranchised most blacks from voting and excluded them from the political process for more than six decades. Clinton said the moves would effectively disenfranchise core voter blocs that trend liberal, including college students, black people, and Latinos.[13][14] The Obama campaign fought against the Ohio law, pushing for a petition and statewide referendum to repeal it in time for the 2012 election.[15]
In addition, the Pennsylvania legislature proposed a plan to change its representation in the electoral college from the traditional winner-take-all model to a district-by-district model.[16] As the governorship and both houses of its legislature were Republican-controlled, the move was viewed by some as an attempt to reduce Democratic chances.[17][18][19] Ultimately they did not do it, leaving their winner take all format intact as of 2020.
Nominations
Democratic Party nomination
Primaries
With an incumbent president running for re-election against token opposition, the race for the Democratic nomination was largely uneventful. The nomination process consisted of primaries and caucuses, held by the 50 states, as well as Guam, Puerto Rico, Washington, D.C., U.S. Virgin Islands, American Samoa, and Democrats Abroad. Additionally, high-ranking party members known as superdelegates each received one vote in the convention. A few of the primary challengers surpassed the president's vote total in individual counties in several of the seven contested primaries, though none made a significant impact in the delegate count. Running unopposed everywhere else, Obama cemented his status as the Democratic presumptive nominee on April 3, 2012, by securing the minimum number of pledged delegates needed to obtain the nomination.[20][21]
Candidate
 | |||||||||||||||||||||||||||||
| Barack Obama | Joe Biden | ||||||||||||||||||||||||||||
|---|---|---|---|---|---|---|---|---|---|---|---|---|---|---|---|---|---|---|---|---|---|---|---|---|---|---|---|---|---|
| for President | for Vice President | ||||||||||||||||||||||||||||
 |  | ||||||||||||||||||||||||||||
| 44th President of the United States (2009–2017) | 47th Vice President of the United States (2009–2017) | ||||||||||||||||||||||||||||
| Campaign | |||||||||||||||||||||||||||||
Republican Party nomination
Primaries
Candidates with considerable name recognition who entered the race for the Republican presidential nomination in the early stages of the primary campaign included U.S. Representative and former Libertarian nominee Ron Paul, former Minnesota Governor Tim Pawlenty, who co-chaired John McCain's campaign in 2008, former Massachusetts Governor Mitt Romney, the runner-up for the nomination in the 2008 cycle, and former Speaker of the House Newt Gingrich.
The first debate took place on May 5, 2011, in Greenville, South Carolina, with businessman Herman Cain, former New Mexico Governor Gary Johnson, Ron Paul, Tim Pawlenty, and former Pennsylvania Senator Rick Santorum participating. Another debate took place a month later, with Newt Gingrich, Mitt Romney, former Utah Governor Jon Huntsman, and Minnesota Congresswoman Michele Bachmann participating, and Gary Johnson excluded. A total of thirteen debates were held before the Iowa caucuses.
The first major event of the campaign was the Ames Straw Poll, which took place in Iowa on August 13, 2011. Michele Bachmann won the straw poll (this ultimately proved to be the acme of her campaign).[22] Pawlenty withdrew from the race after a poor showing in the straw poll, as did Thaddeus McCotter, the only candidate among those who qualified for the ballot who was refused entrance into the debate.[23]
It became clear at around this point in the nomination process that while Romney was considered to be the likely nominee by the Republican establishment, a large segment of the conservative primary electorate found him to be too moderate for their political views. As a result, a number of potential "anti-Romney" candidates were put forward,[24][25] including future President Donald Trump,[26] former Alaska Governor and 2008 vice-presidential nominee Sarah Palin,[27] New Jersey Governor Chris Christie,[28] and Texas Governor Rick Perry,[29] the last of whom decided to run in August 2011. Perry did poorly in the debates, however, and Herman Cain and then Newt Gingrich came to the fore in October and November.
Due to a number of scandals, Cain withdrew just before the end of the year, after having ballot placement in several states.[30] Around the same time, Johnson, who had been able to get into only one other debate, withdrew to seek the Libertarian Party nomination.[31]
For the first time in modern Republican Party history, three different candidates won the first three state contests in January (the Iowa caucuses, the New Hampshire primary, and the South Carolina primary).[32] Although Romney had been expected to win in at least Iowa and New Hampshire, Rick Santorum won the non-binding poll at caucus sites in Iowa by 34 votes, as near as could be determined from the incomplete tally, earning him a declaration as winner by state party leaders, although vote totals were missing from eight precincts.[33][34] The election of county delegates at the caucuses would eventually lead to Ron Paul earning 22 of the 28 Iowa delegates to the Republican National Convention.[35] Newt Gingrich won South Carolina by a surprisingly large margin,[36] and Romney won only in New Hampshire.
A number of candidates dropped out at this point in the nomination process. Bachmann withdrew after finishing sixth in the Iowa caucuses,[37] Huntsman withdrew after coming in third in New Hampshire, and Perry withdrew when polls showed him drawing low numbers in South Carolina.[38]

Santorum, who had previously run an essentially one-state campaign in Iowa, was able to organize a national campaign after his surprising victory there. He unexpectedly carried three states in a row on February 7 and overtook Romney in nationwide opinion polls, becoming the only candidate in the race to effectively challenge the notion that Romney was the inevitable nominee.[39] However, Romney won all of the other contests between South Carolina and the Super Tuesday primaries, and regained his first-place status in nationwide opinion polls by the end of February.
The Super Tuesday primaries took place on March 6. Romney carried six states, Santorum carried three, and Gingrich won only in his home state of Georgia.[40] Throughout the rest of March, 266 delegates were allocated in 12 events, including the territorial contests and the first local conventions that allocated delegates (Wyoming's county conventions). Santorum won Kansas and three Southern primaries, but he was unable to make any substantial gain on Romney, who became a formidable frontrunner after securing more than half of the delegates allocated in March.
On April 10, Santorum suspended his campaign due to a variety of reasons, such as a low delegate count, unfavorable polls in his home state of Pennsylvania, and his daughter's health, leaving Mitt Romney as the undisputed front-runner for the presidential nomination and allowing Gingrich to claim that he was "the last conservative standing" in the campaign for the nomination.[41] After disappointing results in the April 24 primaries (finishing second in one state, third in three, and fourth in one), Gingrich dropped out on May 2 in a move that was seen as an effective end to the contest for the nomination.[42] After Gingrich's spokesman announced his upcoming withdrawal, the Republican National Committee declared Romney the party's presumptive nominee.[43] Ron Paul officially remained in the race, but he stopped campaigning on May 14 to focus on state conventions.
On May 29, after winning the Texas primary, Romney had received a sufficient number of delegates to clinch the party's nomination with the inclusion of unpledged delegates. After winning the June 5 primaries in California and several other states, Romney had received more than enough pledged delegates to clinch the nomination without counting unpledged delegates, making the June 26 Utah Primary, the last contest of the cycle, purely symbolic. CNN's final delegate estimate, released on July 27, 2012, put Romney at 1,462 pledged delegates and 62 unpledged delegates, for a total estimate of 1,524 delegates. No other candidate had unpledged delegates. The delegate estimates for the other candidates were Santorum at 261 delegates, Paul at 154, Gingrich at 142, Bachmann at 1, Huntsman at 1, and all others at 0.[44]
On August 28, 2012, delegates at the Republican National Convention officially named Romney the party's presidential nominee.[45] Romney formally accepted the delegates' nomination on August 30, 2012.[46]
Candidate
 | |||||||||||||||||||||||||||||
| Mitt Romney | Paul Ryan | ||||||||||||||||||||||||||||
|---|---|---|---|---|---|---|---|---|---|---|---|---|---|---|---|---|---|---|---|---|---|---|---|---|---|---|---|---|---|
| for President | for Vice President | ||||||||||||||||||||||||||||
.jpg) |  | ||||||||||||||||||||||||||||
| 70th Governor of Massachusetts (2003–2007) | U.S. Representative from Wisconsin (1999–2019) | ||||||||||||||||||||||||||||
| Campaign | |||||||||||||||||||||||||||||
| [47][48] | |||||||||||||||||||||||||||||
Withdrawn candidates


Third party and other nominations
Four other parties nominated candidates that had ballot access or write-in access to at least 270 electoral votes, the minimum number of votes needed in the 2012 election to win the presidency through a majority of the electoral college.
Libertarian Party
- Gary Johnson, former governor of New Mexico.[73] Vice-presidential nominee: Jim Gray, retired state court judge, from California.[74]
Green Party
- Jill Stein, medical doctor from Massachusetts.[75][76] Vice-presidential nominee: Cheri Honkala, social organizer, from Pennsylvania.[77]
Constitution Party
- Virgil Goode, former representative from Virginia.[78] Vice-presidential nominee: Jim Clymer from Pennsylvania.[79]
Justice Party
- Rocky Anderson, former mayor of Salt Lake City and founding member of the Justice Party, from Utah. Vice-presidential nominee: Luis J. Rodriguez from California.[80][81]
Candidates gallery

.jpg)
.jpg)

Campaigns
Ballot access
| Presidential ticket | Party | Ballot access[82] | Votes | Percentage | ||
|---|---|---|---|---|---|---|
| States | Electors | % of voters | ||||
| Obama / Biden | Democratic | 50 + DC | 538 | 100% | 65,915,795 | 51.1% |
| Romney / Ryan | Republican | 50 + DC | 538 | 100% | 60,933,504 | 47.2% |
| Johnson / Gray | Libertarian | 48 + DC | 515 | 95.1% | 1,275,971 | 1.0% |
| Stein / Honkala | Green | 36 + DC | 436 | 83.1% | 469,627 | 0.4% |
| Goode / Clymer | Constitution | 26 | 257 | 49.9% | 122,388 | 0.1% |
| Anderson / Rodriguez | Justice | 15 | 145 | 28.1% | 43,018 | nil |
| Lindsay / Osorio | Socialism & Liberation | 13 | 115 | 28.6% | 7,791 | nil |
Candidates in bold were on ballots representing 270 electoral votes.
All other candidates were on the ballots of fewer than 10 states, 100 electors, and less than 20% of voters nationwide.
Financing and advertising
The United States presidential election of 2012 broke new records in financing, fundraising, and negative campaigning. Through grassroots campaign contributions, online donations, and Super PACs, Obama and Romney raised a combined total of more than $2 billion.[83] Super PACs constituted nearly one-fourth of the total financing, with most coming from pro-Romney PACs.[84] Obama raised $690 million through online channels, beating his record of $500 million in 2008.[85] Most of the advertising in the 2012 presidential campaign was decidedly negative—80% of Obama's ads and 84% of Romney's ads were negative.[86] The tax-exempt non-profit Americans for Prosperity, a so-called "outside group", that is, a political advocacy group that is not a political action committee or super-PAC, ran a television advertising campaign opposing Obama described by The Washington Post as "early and relentless".[87][88] Americans for Prosperity spent $8.4 million in swing states on television advertisements denouncing the American Recovery and Reinvestment Act of 2009 loan guarantee to Solyndra, a manufacturer of solar panels that went bankrupt,[89] an advertising campaign described by The Wall Street Journal in November 2011 as "perhaps the biggest attack on Mr. Obama so far".[90][91]
Party conventions


- April 18–21, 2012: 2012 Constitution Party National Convention held in Nashville, Tennessee;[92] Virgil Goode won the nomination.
- May 3–6, 2012: 2012 Libertarian National Convention held in Las Vegas, Nevada;[93] Gary Johnson won the nomination.[94]
- July 13–15, 2012: 2012 Green National Convention held in Baltimore, Maryland;[95] Jill Stein won the nomination.[75]
- August 27–30, 2012: 2012 Republican National Convention held in Tampa, Florida;[96] Mitt Romney won the nomination.
- September 3–6, 2012: 2012 Democratic National Convention held in Charlotte, North Carolina;[97] Barack Obama won the nomination.
Presidential debates
The Commission on Presidential Debates held four debates during the last weeks of the campaign: three presidential and one vice-presidential. The major issues debated were the economy and jobs, the federal budget deficit, taxation and spending, the future of Social Security, Medicare, and Medicaid, healthcare reform, education, social issues, immigration, and foreign policy.
| No. | Date | Host | City | Moderator | Participants | Viewership (million) |
|---|---|---|---|---|---|---|
| P1 | Wednesday, October 3, 2012 | University of Denver | Denver, Colorado | Jim Lehrer | 67.2[100] | |
| VP | Thursday, October 11, 2012 | Centre College | Danville, Kentucky | Martha Raddatz | 51.4[100] | |
| P2 | Tuesday, October 16, 2012 | Hofstra University | Hempstead, New York | Candy Crowley | 65.6[100] | |
| P3 | Monday, October 22, 2012 | Lynn University | Boca Raton, Florida | Bob Schieffer | 59.2[100] |

An independent presidential debate featuring minor party candidates took place on Tuesday, October 23 at the Hilton Hotel in Chicago, Illinois.[101][102] The debate was moderated by Larry King[103] and organized by the Free & Equal Elections Foundation.[102] The participants were Gary Johnson (Libertarian), Jill Stein (Green), Virgil Goode (Constitution), and Rocky Anderson (Justice).[102][103] A second debate between Stein and Johnson took place on Sunday, November 4, and was moderated by Ralph Nader.[104]
Notable expressions, phrases, and statements
- Severely conservative – In a speech he made at the Conservative Political Action Conference in February 2012, Romney claimed that he had been a "severely conservative Republican governor". Romney's description of his record as "severely conservative" was widely criticized by political commentators as both rhetorically clumsy and factually inaccurate.[105][106][107] Later, the phrase "severely conservative" was frequently brought up by Democrats to make fun of Romney's willingness to associate himself with the far-right of the Republican Party as well as his apparent lack of sincerity while doing so.[108] Conservative radio host Rush Limbaugh, who played the clip on his radio show, said: "I have never heard anybody say, 'I'm severely conservative.' "[109]
- You didn't build that – A portion of a statement that Obama made in a July 2012 campaign speech in Roanoke, Virginia. Obama said that businesses depend on government-provided infrastructure to succeed, but critics of his remarks argued that he was underplaying the work of entrepreneurs and giving the government credit for individuals' success. The Romney campaign immediately used the statement in an effort to contrast Romney's economic policies with Obama's and to appeal to small business owners/employees. A major theme of the 2012 Republican National Convention was "We Built It".
- 47 percent – An expression Romney used at a private campaign fundraising event, which was secretly recorded and publicly released. At the private event, Romney said that 47 percent of the people would vote for Barack Obama no matter what Romney said or did because those people "...are dependent upon government... I'll never convince them they should take personal responsibility and care for their lives." Ironically, Romney received almost exactly 47% of the vote.
- The 1980s are now calling to ask for their foreign policy back – A portion of a statement that Obama made in an October 2012 debate. In the debate, Obama was deriding an earlier Romney statement in the campaign that Russia is "without question, our No. 1 geopolitical foe."[110]
- Binders full of women – A phrase that Romney used in the second presidential debate to refer to the long list of female candidates that he considered when choosing his cabinet members as Governor of Massachusetts.
- Horses and bayonets – After Romney said in the third presidential debate that the U.S. Navy was smaller than at any time since 1917, Obama replied, "We have fewer ships than we did in 1916. Well, governor, we also have fewer horses and bayonets, because the nature of our military's changed."[111]
- Shovel-ready jobs – a phrase used to describe some stimulus projects promoted by the administration. During the debate on September 23, 2011, Gary Johnson quipped, "My next-door neighbor's two dogs have created more shovel-ready jobs than this president."[112]
- Romnesia – A term coined by a blogger in April 2011 and used by Obama late in the campaign to describe Romney's alleged inability to take responsibility for his past statements.[113][114]
- $10,000 bet – During a Republican debate, Romney facetiously bet Texas governor Rick Perry $10,000 that he (Perry) was wrong about Romney's position on the individual mandate under the Affordable Healthcare Act. The statement was vilified by Democrats as exemplary of Romney being out of touch with working-class and middle-class Americans.
- Romneyshambles – a word used by the British press after Romney criticized British preparations for the 2012 Summer Olympics. The word is a play on omnishambles, and it became a popular hashtag on Twitter. It was subsequently chosen as one of Collins English Dictionary's words of the year.[115][116]
- Malarkey – a word used by Joe Biden in his debate with Paul Ryan to mean bullshit. Biden later used the word in his own campaign in 2020.[117]
Results
Electoral results
On the day of the election, spread betting firm Spreadex were offering an Obama Electoral College Votes spread of 296–300 to Romney's 239–243.[118] In reality Obama's victory over Romney was far greater, winning 332 electoral votes to Romney's 206. Romney lost all but one of nine battleground states, and received 47 percent of the nationwide popular vote to Obama's 51 percent.[119][120]
Of the 3,154 counties/districts/independent cities making returns, Romney won the most popular votes in 2,447 (77.58%) while Obama carried 707 (22.42%).
Popular vote totals are from the Federal Election Commission report.[2]
| Presidential candidate | Party | Home state | Popular vote | Electoral vote | Running mate | |||
|---|---|---|---|---|---|---|---|---|
| Count | Percentage | Vice-presidential candidate | Home state | Electoral vote | ||||
| Barack Obama (incumbent) | Democratic | Illinois | 65,915,795 | 51.06% | 332 | Joe Biden (incumbent) | Delaware | 332 |
| Mitt Romney | Republican | Massachusetts | 60,933,504 | 47.20% | 206 | Paul Ryan | Wisconsin | 206 |
| Gary Johnson | Libertarian | New Mexico | 1,275,971 | 0.99% | 0 | Jim Gray | California | 0 |
| Jill Stein | Green | Massachusetts | 469,627 | 0.36% | 0 | Cheri Honkala | Minnesota | 0 |
| Virgil Goode | Constitution | Virginia | 122,389 | 0.11% | 0 | James N. Clymer | Pennsylvania | 0 |
| Roseanne Barr | Peace and Freedom | Utah | 67,326 | 0.05% | 0 | Cindy Sheehan | California | 0 |
| Rocky Anderson | Justice | Utah | 43,018 | 0.03% | 0 | Luis J. Rodriguez | Texas | 0 |
| Tom Hoefling | America's | Nebraska | 40,628 | 0.03% | 0 | J.D. Ellis | Tennessee | 0 |
| Other | 217,152 | 0.17% | — | Other | — | |||
| Total | 129,085,410 | 100% | 538 | 538 | ||||
| Needed to win | 270 | 270 | ||||||

Results by state
The table below displays the official vote tallies by each state's Electoral College voting method. The source for the results of all states, except those that amended their official results, is the official Federal Election Commission report.[2] The column labeled "Margin" shows Obama's margin of victory over Romney (the margin is negative for every state that Romney won).
| States/districts won by Obama/Biden | |
| States/districts won by Romney/Ryan | |
| † | At-large results (for states that split electoral votes) |
| State/District | Barack Obama Democratic | Mitt Romney Republican | Gary Johnson Libertarian | Jill Stein Green | Others | Margin | Total | ||||||||||||
|---|---|---|---|---|---|---|---|---|---|---|---|---|---|---|---|---|---|---|---|
| # | % | EV | # | % | EV | # | % | EV | # | % | EV | # | % | EV | # | % | # | ||
 Alabama Alabama | 795,696 | 38.36% | – | 1,255,925 | 60.55% | 9 | 12,328 | 0.59% | – | 3,397 | 0.16% | – | 6,992 | 0.3% | – | −460,229 | −22.19% | 2,074,338 | AL |
| 122,640 | 40.81% | – | 164,676 | 54.80% | 3 | 7,392 | 2.46% | – | 2,917 | 0.97% | – | 2,870 | 1.0% | – | −42,036 | −13.99% | 300,495 | AK | |
 Arizona Arizona | 1,025,232 | 44.59% | – | 1,233,654 | 53.65% | 11 | 32,100 | 1.39% | – | 7,816 | 0.34% | – | 452 | nil | – | −208,422 | −9.06% | 2,299,254 | AZ |
 Arkansas Arkansas | 394,409 | 36.88% | – | 647,744 | 60.57% | 6 | 16,276 | 1.52% | – | 9,305 | 0.87% | – | 1,734 | 0.16% | – | −253,335 | −23.69% | 1,069,468 | AR |
 California California | 7,854,285 | 60.24% | 55 | 4,839,958 | 37.12% | – | 143,221 | 1.10% | – | 85,638 | 0.66% | – | 115,445 | 0.88% | – | 3,014,327 | 23.12% | 13,038,547 | CA |
 Colorado Colorado | 1,323,101 | 51.49% | 9 | 1,185,243 | 46.13% | – | 35,545 | 1.38% | – | 7,508 | 0.29% | – | 18,121 | 0.71% | – | 137,858 | 5.36% | 2,569,518 | CO |
 Connecticut Connecticut | 905,083 | 58.06% | 7 | 634,892 | 40.73% | – | 12,580 | 0.81% | – | 863 | 0.06% | – | 5,542 | 0.36% | – | 270,191 | 17.33% | 1,558,960 | CT |
 Delaware Delaware | 242,584 | 58.61% | 3 | 165,484 | 39.98% | – | 3,882 | 0.94% | – | 1,940 | 0.47% | – | 31 | nil | – | 77,100 | 18.63% | 413,921 | DE |
 District of Columbia District of Columbia | 267,070 | 90.91% | 3 | 21,381 | 7.28% | – | 2,083 | 0.71% | – | 2,458 | 0.84% | – | 772 | 0.26% | – | 245,689 | 83.63% | 293,764 | DC |
 Florida Florida | 4,237,756 | 50.01% | 29 | 4,163,447 | 49.13% | – | 44,726 | 0.5% | – | 8,947 | 0.1% | – | 19,303 | 0.2% | – | 74,309 | 0.88% | 8,474,179 | FL |
 Georgia Georgia | 1,773,827 | 45.48% | – | 2,078,688 | 53.30% | 16 | 45,324 | 1.2% | – | 1,516 | nil | – | 695 | nil | – | −304,861 | −7.82% | 3,900,050 | GA |
 Hawaii Hawaii | 306,658 | 70.55% | 4 | 121,015 | 27.84% | – | 3,840 | 0.9% | – | 3,184 | 0.7% | – | – | – | – | 185,643 | 42.71% | 434,697 | HI |
 Idaho Idaho | 212,787 | 32.40% | – | 420,911 | 64.09% | 4 | 9,453 | 1.5% | – | 4,402 | 0.7% | – | 4,721 | 0.7% | – | −208,124 | −31.69% | 652,274 | ID |
 Illinois Illinois | 3,019,512 | 57.60% | 20 | 2,135,216 | 40.73% | – | 56,229 | 1.1% | – | 30,222 | 0.6% | – | 835 | nil | – | 884,296 | 16.87% | 5,242,014 | IL |
 Indiana Indiana | 1,152,887 | 43.93% | – | 1,420,543 | 54.13% | 11 | 50,111 | 1.9% | – | 625 | nil | – | 368 | nil | – | −267,656 | −10.20% | 2,624,534 | IN |
 Iowa Iowa | 822,544 | 51.99% | 6 | 730,617 | 46.18% | – | 12,926 | 0.8% | – | 3,769 | 0.2% | – | 12,324 | 0.8% | – | 91,927 | 5.81% | 1,582,180 | IA |
 Kansas Kansas | 440,726 | 38.05% | – | 692,634 | 59.66% | 6 | 20,456 | 1.8% | – | 714 | 0.1% | – | 5,441 | 0.5% | – | −251,908 | −21.71% | 1,159,971 | KS |
 Kentucky Kentucky | 679,370 | 37.80% | – | 1,087,190 | 60.49% | 8 | 17,063 | 1.0% | – | 6,337 | 0.4% | – | 7,252 | 0.4% | – | −407,820 | −22.69% | 1,797,212 | KY |
 Louisiana Louisiana | 809,141 | 40.58% | – | 1,152,262 | 57.78% | 8 | 18,157 | 0.9% | – | 6,978 | 0.4% | – | 7,527 | 0.4% | – | −343,121 | −17.20% | 1,994,065 | LA |
 Maine† Maine† | 401,306 | 56.27% | 2 | 292,276 | 40.98% | – | 9,352 | 1.3% | – | 8,119 | 1.1% | – | 2,127 | 0.3% | – | 109,030 | 15.29% | 713,180 | ME–AL |
| ME-1 | 223,035 | 59.57% | 1 | 142,937 | 38.18% | – | 4,501 | 1.2% | – | 3,946 | 1.1% | – | – | – | – | 80,098 | 21.39% | 374,149 | ME1 |
| ME-2 | 177,998 | 52.94% | 1 | 149,215 | 44.38% | – | 4,843 | 1.4% | – | 4,170 | 1.2% | – | – | – | – | 28,783 | 8.56% | 336,226 | ME2 |
 Maryland Maryland | 1,677,844 | 61.97% | 10 | 971,869 | 35.90% | – | 30,195 | 1.1% | – | 17,110 | 0.6% | – | 10,309 | 0.4% | – | 705,975 | 26.07% | 2,707,327 | MD |
 Massachusetts Massachusetts | 1,921,290 | 60.65% | 11 | 1,188,314 | 37.51% | – | 30,920 | 1.0% | – | 20,691 | 0.7% | – | 6,552 | 0.2% | – | 732,976 | 23.14% | 3,167,767 | MA |
 Michigan Michigan | 2,564,569 | 54.21% | 16 | 2,115,256 | 44.71% | – | 7,774 | 0.2% | – | 21,897 | 0.5% | – | 21,465 | 0.5% | – | 449,313 | 9.50% | 4,730,961 | MI |
 Minnesota Minnesota | 1,546,167 | 52.65% | 10 | 1,320,225 | 44.96% | – | 35,098 | 1.2% | – | 13,023 | 0.4% | – | 22,048 | 0.8% | – | 225,942 | 7.69% | 2,936,561 | MN |
 Mississippi Mississippi | 562,949 | 43.79% | – | 710,746 | 55.29% | 6 | 6,676 | 0.5% | – | 1,588 | 0.1% | – | 3,625 | 0.3% | – | −147,797 | −11.50% | 1,285,584 | MS |
 Missouri Missouri | 1,223,796 | 44.38% | – | 1,482,440 | 53.76% | 10 | 43,151 | 1.6% | – | – | – | – | 7,936 | 0.3% | – | −258,644 | −9.38% | 2,757,323 | MO |
 Montana Montana | 201,839 | 41.70% | – | 267,928 | 55.35% | 3 | 14,165 | 2.9% | – | – | – | – | 116 | nil | – | −66,089 | −13.65% | 484,048 | MT |
 Nebraska† Nebraska† | 302,081 | 38.03% | – | 475,064 | 59.80% | 2 | 11,109 | 1.4% | – | – | – | – | 6,125 | 0.8% | – | −172,983 | −21.77% | 794,379 | NE–AL |
| NE-1 | 108,082 | 40.83% | – | 152,021 | 57.43% | 1 | 3,847 | 1.2% | – | – | – | – | 762 | 0.3% | – | -43,949 | -16.60% | 264,712 | NE1 |
| NE-2 | 121,889 | 45.70% | – | 140,976 | 52.85% | 1 | 3,393 | 1.3% | – | – | – | – | 469 | 0.2% | – | -19,087 | -7.15% | 266,727 | NE2 |
| NE-3 | 72,110 | 27.82% | – | 182,067 | 70.23% | 1 | 3,869 | 1.5% | – | – | – | – | 1,177 | 0.5% | – | −109,957 | −42.41% | 259,223 | NE3 |
 Nevada Nevada | 531,373 | 52.36% | 6 | 463,567 | 45.68% | – | 10,968 | 1.1% | – | – | – | – | 9,010 | 0.9% | – | 67,806 | 6.68% | 1,014,918 | NV |
 New Hampshire New Hampshire | 369,561 | 51.98% | 4 | 329,918 | 46.40% | – | 8,212 | 1.2% | – | 324 | 0.1% | – | 2,957 | 0.4% | – | 39,643 | 5.58% | 710,972 | NH |
 New Jersey[121] New Jersey[121] | 2,125,101 | 58.38% | 14 | 1,477,568 | 40.59% | – | 21,045 | 0.6% | – | 9,888 | 0.3% | – | 6,690 | 0.2% | – | 647,533 | 17.79% | 3,640,292 | NJ |
 New Mexico New Mexico | 415,335 | 52.99% | 5 | 335,788 | 42.84% | – | 27,788 | 3.6% | – | 2,691 | 0.3% | – | 2,156 | 0.3% | – | 79,547 | 10.15% | 783,758 | NM |
 New York[122] New York[122] | 4,485,741 | 63.35% | 29 | 2,490,431 | 35.17% | – | 47,256 | 0.7% | – | 39,982 | 0.6% | – | 17,749 | 0.3% | – | 1,995,310 | 28.18% | 7,081,159 | NY |
 North Carolina North Carolina | 2,178,391 | 48.35% | – | 2,270,395 | 50.39% | 15 | 44,515 | 1.0% | – | – | – | – | 12,071 | 0.3% | – | −92,004 | −2.04% | 4,505,372 | NC |
 North Dakota North Dakota | 124,827 | 38.70% | – | 188,163 | 58.32% | 3 | 5,231 | 1.6% | – | 1,361 | 0.4% | – | 3,045 | 0.9% | – | −63,336 | −19.62% | 322,627 | ND |
 Ohio[123] Ohio[123] | 2,827,709 | 50.67% | 18 | 2,661,437 | 47.69% | – | 49,493 | 0.9% | – | 18,573 | 0.3% | – | 23,635 | 0.4% | – | 166,272 | 2.98% | 5,580,847 | OH |
 Oklahoma Oklahoma | 443,547 | 33.23% | – | 891,325 | 66.77% | 7 | – | – | – | – | – | – | – | – | – | −447,778 | −33.44% | 1,334,872 | OK |
 Oregon Oregon | 970,488 | 54.24% | 7 | 754,175 | 42.15% | – | 24,089 | 1.4% | – | 19,427 | 1.1% | – | 21,091 | 1.2% | – | 216,313 | 12.09% | 1,789,270 | OR |
| 2,990,274 | 51.97% | 20 | 2,680,434 | 46.59% | – | 49,991 | 0.9% | – | 21,341 | 0.4% | – | 11,630 | 0.2% | – | 309,840 | 5.38% | 5,753,670 | PA | |
 Rhode Island Rhode Island | 279,677 | 62.70% | 4 | 157,204 | 35.24% | – | 4,388 | 1.0% | – | 2,421 | 0.5% | – | 2,359 | 0.5% | – | 122,473 | 27.46% | 446,049 | RI |
 South Carolina South Carolina | 865,941 | 44.09% | – | 1,071,645 | 54.56% | 9 | 16,321 | 0.8% | – | 5,446 | 0.3% | – | 4,765 | 0.2% | – | −205,704 | −10.47% | 1,964,118 | SC |
 South Dakota South Dakota | 145,039 | 39.87% | – | 210,610 | 57.89% | 3 | 5,795 | 1.6% | – | – | – | – | 2,371 | 0.7% | – | −65,571 | −18.02% | 363,815 | SD |
 Tennessee Tennessee | 960,709 | 39.08% | – | 1,462,330 | 59.48% | 11 | 18,623 | 0.8% | – | 6,515 | 0.3% | – | 10,400 | 0.4% | – | −501,621 | −20.40% | 2,458,577 | TN |
 Texas Texas | 3,308,124 | 41.38% | – | 4,569,843 | 57.17% | 38 | 88,580 | 1.1% | – | 24,657 | 0.3% | – | 2,647 | nil | – | −1,261,719 | −15.79% | 7,993,851 | TX |
 Utah Utah | 251,813 | 24.69% | – | 740,600 | 72.62% | 6 | 12,572 | 1.2% | – | 3,817 | 0.4% | – | 8,638 | 0.9% | – | −488,787 | −47.93% | 1,017,440 | UT |
 Vermont Vermont | 199,239 | 66.57% | 3 | 92,698 | 30.97% | – | 3,487 | 1.2% | – | 594 | 0.2% | – | 3,272 | 1.1% | – | 106,541 | 35.60% | 299,290 | VT |
 Virginia Virginia | 1,971,820 | 51.16% | 13 | 1,822,522 | 47.28% | – | 31,216 | 0.8% | – | 8,627 | 0.2% | – | 20,304 | 0.5% | – | 149,298 | 3.88% | 3,854,489 | VA |
 Washington Washington | 1,755,396 | 56.16% | 12 | 1,290,670 | 41.29% | – | 42,202 | 1.4% | – | 20,928 | 0.7% | – | 16,320 | 0.5% | – | 464,726 | 14.87% | 3,125,516 | WA |
 West Virginia West Virginia | 238,269 | 35.54% | – | 417,655 | 62.30% | 5 | 6,302 | 0.9% | – | 4,406 | 0.7% | – | 3,806 | 0.6% | – | −179,386 | −26.76% | 670,438 | WV |
 Wisconsin[124] Wisconsin[124] | 1,620,985 | 52.83% | 10 | 1,407,966 | 45.89% | – | 20,439 | 0.7% | – | 7,665 | 0.3% | – | 11,379 | 0.4% | – | 213,019 | 6.94% | 3,068,434 | WI |
 Wyoming Wyoming | 69,286 | 27.82% | – | 170,962 | 68.64% | 3 | 5,326 | 2.1% | – | – | – | – | 3,487 | 1.4% | – | −101,676 | −40.82% | 249,061 | WY |
| U.S. Total | 65,915,795 | 51.06% | 332 | 60,933,504 | 47.20% | 206 | 1,275,971 | 1.0% | – | 469,627 | 0.4% | – | 490,510 | 0.4% | – | 4,982,291 | 3.86% | 129,085,410 | US |
Maine and Nebraska each allow for their election results votes to be split between candidates. The winner within each congressional district gets one electoral vote for the district. The winner of the statewide vote gets two additional electoral votes. In the 2012 election, all four of Maine's electoral votes were won by Obama and all five of Nebraska's electoral votes were won by Romney.[125][126]
States that flipped from Democratic to Republican
Close states

Red denotes states (or congressional districts that contribute an electoral vote) won by Republican Mitt Romney; blue denotes those won by Democrat Barack Obama.
State where the margin of victory was under 1% (29 electoral votes):
- Florida, 0.88% (74,309 votes)
States where the margin of victory was under 5% (46 electoral votes):
- North Carolina, 2.04% (92,004 votes)
- Ohio, 2.98% (166,272 votes)
- Virginia, 3.88% (149,298 votes)
States/districts where the margin of victory was between 5% and 10% (120 electoral votes):
- Colorado, 5.36% (137,858 votes) (tipping point state)
- Pennsylvania, 5.38% (309,840 votes)
- New Hampshire, 5.58% (39,643 votes)
- Iowa, 5.81% (91,927 votes)
- Nevada, 6.68% (67,806 votes)
- Wisconsin, 6.94% (213,019 votes)
- Nebraska's 2nd Congressional District, 7.15% (19,087 votes)
- Minnesota, 7.69% (225,942 votes)
- Georgia, 7.82% (304,861 votes)
- Maine's 2nd Congressional District, 8.56% (28,783 votes)
- Arizona, 9.06% (208,422 votes)
- Missouri, 9.38% (258,644 votes)
- Michigan, 9.50% (449,313 votes)
Statistics
Counties with highest percent of vote (Democratic)
- Shannon County, South Dakota 93.39%
- Kalawao County, Hawaii 92.59%
- Bronx County, New York 91.45%
- Washington, D.C. 90.91%
- Petersburg, Virginia 89.79%
Counties with highest percent of vote (Republican)
- King County, Texas 95.86%
- Madison County, Idaho 93.29%
- Sterling County, Texas 92.91%
- Franklin County, Idaho 92.77%
- Roberts County, Texas 92.13%
Romney's concession

After the networks called Ohio (the state that was arguably the most critical for Romney, as no Republican had ever won the presidency without carrying it) for Obama at around 11:15 pm EST on Election Day, Romney was ready to concede the race, but hesitated when Karl Rove strenuously objected on Fox News to the network's decision to make that call.[128][129] However, after Colorado and Nevada were called for the President (giving Obama enough electoral votes to win even if Ohio were to leave his column), in tandem with Obama's apparent lead in Florida and Virginia (both were eventually called for Obama), Romney acknowledged that he had lost and conceded at around 1:00 am EST on November 7.
Despite public polling showing Romney behind Obama in the swing states of Nevada, Colorado, Iowa, Wisconsin, Ohio, and New Hampshire, tied with Obama in Virginia, and just barely ahead of Obama in Florida, the Romney campaign said they were genuinely surprised by the loss, having believed that public polling was oversampling Democrats.[130] The Romney campaign had already set up a transition website, and had scheduled and purchased a fireworks display to celebrate in case he won the election.[131][132]
On November 30, 2012, it was revealed that shortly before the election, internal polling done by the Romney campaign had shown Romney ahead in Colorado and New Hampshire, tied in Iowa, and within a few points of Obama in Wisconsin, Pennsylvania, Minnesota, and Ohio.[133] In addition, the Romney campaign had assumed that they would win Florida, North Carolina and Virginia.[134] The polls had made Romney and his campaign team so confident of their victory that Romney did not write a concession speech until Obama's victory was announced.[135][136]
Reactions
Foreign leaders reacted with both positive and mixed messages. Most world leaders congratulated and praised Barack Obama on his re-election victory. However, Venezuela and some other states had tempered reactions. Pakistan commented that Romney's defeat had made Pakistan-United States relations safer. Stock markets fell noticeably after Obama's re-election, with the Dow Jones Industrial Average, NASDAQ, and the S&P 500 each declining over two percent the day after the election.[137]
All 50 states had a petition on the White House website We The People calling for their state to secede from the union. These petitions were created by individual people, with some gaining thousands of signatures.[138]
Voter demographics
| 2012 presidential election by demographic subgroup | |||||||
|---|---|---|---|---|---|---|---|
| Demographic subgroup | Obama | Romney | Other | % of total vote | |||
| Total vote | 51 | 47 | 2 | 100 | |||
| Ideology | |||||||
| Liberals | 86 | 11 | 3 | 25 | |||
| Moderates | 56 | 41 | 3 | 41 | |||
| Conservatives | 17 | 82 | 1 | 35 | |||
| Party | |||||||
| Democrats | 92 | 7 | 1 | 38 | |||
| Republicans | 6 | 93 | 1 | 32 | |||
| Independents | 45 | 50 | 5 | 29 | |||
| Gender | |||||||
| Men | 45 | 52 | 3 | 47 | |||
| Women | 55 | 44 | 1 | 53 | |||
| Marital status | |||||||
| Married | 42 | 56 | 2 | 60 | |||
| Unmarried | 62 | 35 | 3 | 40 | |||
| Sex by marital status | |||||||
| Married men | 38 | 60 | 2 | 29 | |||
| Married women | 46 | 53 | 1 | 31 | |||
| Single men | 56 | 40 | 4 | 18 | |||
| Single women | 67 | 31 | 2 | 23 | |||
| Race/ethnicity | |||||||
| White | 39 | 59 | 2 | 72 | |||
| Black | 93 | 6 | 1 | 13 | |||
| Asian | 73 | 26 | 1 | 3 | |||
| Other | 58 | 38 | 4 | 2 | |||
| Hispanic | 71 | 27 | 2 | 10 | |||
| Religion | |||||||
| Protestant or other Christian | 42 | 57 | 1 | 53 | |||
| Catholic | 50 | 48 | 2 | 25 | |||
| Mormon | 21 | 78 | 1 | 2 | |||
| Jewish | 69 | 30 | 1 | 2 | |||
| Other | 74 | 23 | 3 | 7 | |||
| None | 70 | 26 | 4 | 12 | |||
| Religious service attendance | |||||||
| More than once a week | 36 | 63 | 1 | 14 | |||
| Once a week | 41 | 58 | 1 | 28 | |||
| A few times a month | 55 | 44 | 1 | 13 | |||
| A few times a year | 56 | 42 | 2 | 27 | |||
| Never | 62 | 34 | 4 | 17 | |||
| White evangelical or born-again Christian? | |||||||
| White evangelical or born-again Christian | 21 | 78 | 1 | 26 | |||
| Everyone else | 60 | 37 | 3 | 74 | |||
| Age | |||||||
| 18–24 years old | 60 | 36 | 4 | 11 | |||
| 25–29 years old | 60 | 38 | 2 | 8 | |||
| 30–39 years old | 55 | 42 | 3 | 17 | |||
| 40–49 years old | 48 | 50 | 2 | 20 | |||
| 50–64 years old | 47 | 52 | 1 | 28 | |||
| 65 and older | 44 | 56 | 0 | 16 | |||
| Age by race | |||||||
| Whites 18–29 years old | 44 | 51 | 5 | 11 | |||
| Whites 30–44 years old | 38 | 59 | 3 | 18 | |||
| Whites 45–64 years old | 38 | 61 | 1 | 29 | |||
| Whites 65 and older | 39 | 61 | n/a | 14 | |||
| Blacks 18–29 years old | 91 | 8 | 1 | 3 | |||
| Blacks 30–44 years old | 94 | 5 | 1 | 4 | |||
| Blacks 45–64 years old | 93 | 7 | n/a | 4 | |||
| Blacks 65 and older | 93 | 6 | 1 | 1 | |||
| Latinos 18–29 years old | 74 | 23 | 3 | 4 | |||
| Latinos 30–44 years old | 71 | 28 | 1 | 3 | |||
| Latinos 45–64 years old | 68 | 31 | 1 | 3 | |||
| Latinos 65 and older | 65 | 35 | n/a | 1 | |||
| Others | 67 | 31 | 2 | 5 | |||
| LGBT | |||||||
| Yes | 76 | 22 | 2 | 5 | |||
| No | 49 | 49 | 2 | 95 | |||
| Education | |||||||
| Not a high school graduate | 64 | 35 | 1 | 3 | |||
| High school graduate | 51 | 48 | 1 | 21 | |||
| Some college education | 49 | 48 | 3 | 29 | |||
| College graduate | 47 | 51 | 2 | 29 | |||
| Postgraduate education | 55 | 42 | 3 | 18 | |||
| Family income | |||||||
| Under $30,000 | 63 | 35 | 2 | 20 | |||
| $30,000–49,999 | 57 | 42 | 1 | 21 | |||
| $50,000–99,999 | 46 | 52 | 2 | 31 | |||
| $100,000–199,999 | 44 | 54 | 2 | 21 | |||
| $200,000–249,999 | 47 | 52 | 1 | 3 | |||
| Over $250,000 | 42 | 55 | 3 | 4 | |||
| Union households | |||||||
| Union | 58 | 40 | 2 | 18 | |||
| Non-union | 49 | 48 | 3 | 82 | |||
| Issue regarded as most important | |||||||
| Economy | 47 | 51 | 2 | 59 | |||
| Federal budget deficit | 32 | 66 | 2 | 15 | |||
| Foreign policy | 56 | 33 | 11 | 5 | |||
| Health care | 75 | 24 | 1 | 18 | |||
| Region | |||||||
| Northeast | 59 | 40 | 1 | 18 | |||
| Midwest | 50 | 48 | 2 | 24 | |||
| South | 46 | 53 | 1 | 36 | |||
| West | 54 | 43 | 3 | 22 | |||
| Community size | |||||||
| Big cities (population over 500,000) | 69 | 29 | 2 | 11 | |||
| Mid-sized cities (population 50,000 to 500,000) | 58 | 40 | 2 | 21 | |||
| Suburbs | 48 | 50 | 2 | 47 | |||
| Towns (population 10,000 to 50,000) | 42 | 56 | 2 | 8 | |||
| Rural areas | 37 | 61 | 2 | 14 | |||
Hispanic vote
The United States has a population of 50 million Hispanic and Latino Americans, 27 million of whom are citizens eligible to vote (13% of total eligible voters). Traditionally, only half of eligible Hispanic voters vote (around 7% of voters); of them, 71% voted for Barack Obama (increasing his percentage of the vote by 5%); therefore, the Hispanic vote was an important factor in Obama's re-election, since the vote difference between the two main parties was only 3.9%[139][140][141][142]
Exit polls were conducted by Edison Research of Somerville, New Jersey, for the National Election Pool, a consortium of ABC News, Associated Press, CBS News, CNN,[143] Fox News,[144] and NBC News.[145]
Analysis
Combined with the re-election victories of his two immediate predecessors, Bill Clinton (1996) and George W. Bush (2004), Obama's victory in the 2012 election marked only the second time in American history that three consecutive presidents were each elected to two full terms after the consecutive two-term presidencies of Thomas Jefferson, James Madison, and James Monroe ending in 1820, which is the only other time any two-term president succeeded another.[146] This was also the first election since 1928 in which neither of the major candidates had any military experience.[147] Eight years later, Obama's successor, Donald Trump, also ran for his own re-election in 2020, but ultimately defeated by Joe Biden, who served as vice president under Obama.
The 2012 election marked the first time since Franklin D. Roosevelt's last two re-elections in 1940 and 1944 that the incumbent Democratic president won a majority of the popular vote in two consecutive elections.[148] Obama was also the first president of either party to secure a majority of the popular vote in two elections since Ronald Reagan in 1980 and 1984.[149] Obama is the third Democratic president to secure at least 51% of the vote twice, after Andrew Jackson and Franklin D. Roosevelt.[150] Romney won the popular vote in 226 congressional districts making this the first time since 1960 that the winner of the election did not win the popular vote in a majority of the congressional districts.[151]
Romney lost his home state of Massachusetts, becoming the first major party presidential candidate to lose his home state since Democrat Al Gore lost his home state of Tennessee to Republican George W. Bush in the 2000 election.[152] Romney lost his home state by more than 23%, the worst losing margin for a major party candidate since John Frémont in 1856.[153] Even worse than Frémont, Romney failed to win a single county in his home state, something last seen by Theodore Roosevelt in 1912.[154][155] In addition, since Obama carried Ryan's home state of Wisconsin, the Romney–Ryan ticket was the first major party ticket since the 1972 election to have both of its nominees lose their home states.[156] Romney won the popular vote in every county of three states: Utah, Oklahoma, and West Virginia; Obama did so in four states: Vermont, Massachusetts, Rhode Island, and Hawaii.[157]
Romney's loss prompted the Republican National Committee to try to appeal to the American Latino population by concentrating on different approaches to immigration. These were short-lived due to activity and anger from the Republican base and may have contributed to the selection of Donald Trump as their presidential candidate four years later.[158]
Gary Johnson's popular vote total set a Libertarian Party record, and his popular vote percentage was the second-best showing for a Libertarian in a presidential election, trailing only Ed Clark's in 1980.[159] Johnson would go on to beat this record in the 2016 presidential election, winning the most votes for the Libertarian ticket in history. At the time, Green Party candidate Jill Stein's popular vote total made her the most successful female presidential candidate in a general election in United States history.[160][161] This was later surpassed by Hillary Clinton in the 2016 election.
Obama's vote total was the fourth most votes received in the history of presidential elections (behind Obama's 2008 victory and both major candidates in 2020) and the most ever for a reelected president. The 2012 election marked the first time since 1988 in which no state was won by a candidate with a plurality of the state's popular vote. Furthermore, it is the only post-World War II presidential election in which no states were won by margins smaller than 30,000 votes. Obama's narrowest victories were in New Hampshire by 39,643 votes, followed by Florida by 74,309 votes. Every other presidential election in modern history has seen states narrowly won by several thousand votes. So far, this is the only presidential election in history where both the Republican and Democratic vice presidential candidates are practicing Roman Catholics. It is also the only presidential election where there are no white Protestants on either major party ticket.
Obama was the fourth of just four presidents in United States history to win re-election with a lower percentage of the electoral vote than in their prior elections, the other three were James Madison in 1812, Woodrow Wilson in 1916 and Franklin Roosevelt in 1940 and 1944. Additionally, Obama was the fifth of only five presidents to win re-election with a smaller percentage of the popular vote than in prior elections, the other four are James Madison in 1812, Andrew Jackson in 1832, Grover Cleveland in 1892, and Franklin Roosevelt in 1940 and 1944.
Maps
 Results by state, shaded according to winning candidate's percentage of the vote
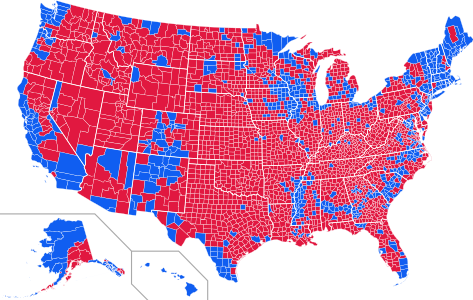 Results by county. Blue denotes counties that went to Obama; red denotes counties that went to Romney. Hawaii, Massachusetts, Rhode Island, and Vermont had all counties go to Obama. Oklahoma, Utah, and West Virginia had all counties go to Romney.
 Results by county, shaded according to winning candidate's percentage of the vote
 Popular vote by county shaded on a scale from red/Republican to blue/Democratic
 Results by state and the District of Columbia, scaled by number of electors per state
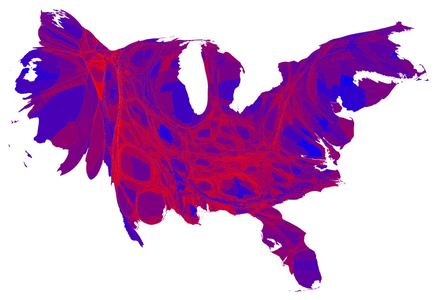 Cartogram of popular vote by county shaded on a scale from red/Republican to blue/Democratic where each county has been rescaled in proportion to its population
 Cartogram of the electoral vote results, with each square representing one electoral vote
 Results by congressional district
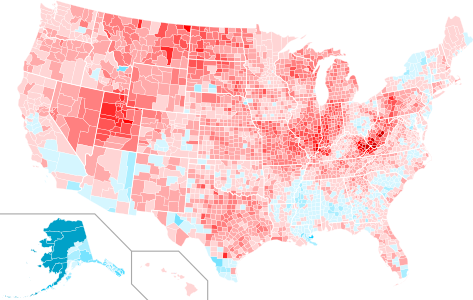 County swing from 2008 to 2012
 Treemap of the popular vote by county, state, and locally predominant recipient


Gallery
![The Empire State Building in New York City was lit blue when CNN called Ohio for Obama, projecting him the winner of the election. Likewise, red would have been used if Romney won.[162]](//upload.wikimedia.org/wikipedia/commons/thumb/4/4f/Empire_State_Building_Blue_Obama_Election.JPG/273px-Empire_State_Building_Blue_Obama_Election.JPG) The Empire State Building in New York City was lit blue when CNN called Ohio for Obama, projecting him the winner of the election. Likewise, red would have been used if Romney won.[162]
The Empire State Building in New York City was lit blue when CNN called Ohio for Obama, projecting him the winner of the election. Likewise, red would have been used if Romney won.[162] The Obamas and the Bidens embrace following the television announcement of their victory.
 The Obamas and the Bidens walk on stage at the election night victory celebration at McCormick Place in Chicago.
 Former governor Mitt Romney meets with President Barack Obama at the White House after the 2012 presidential election.
![The Empire State Building in New York City was lit blue when CNN called Ohio for Obama, projecting him the winner of the election. Likewise, red would have been used if Romney won.[162]](https://www.search.com.vn/wiki/en/File:Empire_State_Building_Blue_Obama_Election.JPG)


See also


- Planned presidential transition of Mitt Romney
- 2012 United States Senate elections
- 2012 United States House of Representatives elections
- 2012 United States gubernatorial elections
- Nationwide opinion polling for the 2012 United States presidential election
- Statewide opinion polling for the 2012 United States presidential election
- Timeline of the 2012 United States presidential election
- Second inauguration of Barack Obama
References
Further reading
- Balz, Dan (2013). Collision 2012: Obama vs. Romney and the Future of Elections in America. New York: Viking Press. ISBN 978-0670025947.
- Gardner, Liz, et al. "Press Coverage of the 2012 US Presidential Election: A Multinational, Cross-Language Comparison". in Die US-Präsidentschaftswahl 2012 (Springer Fachmedien Wiesbaden, 2016). pp 241–267.
- Hansen, Wendy L., Michael S. Rocca, and Brittany Leigh Ortiz. "The effects of Citizens United on corporate spending in the 2012 presidential election". Journal of Politics 77.2 (2015): 535–545. in JSTOR
- Heilemann, John; Halperin, Mark (2013). Double Down: Game Change 2012. New York: Penguin Press. ISBN 978-1594204401.
- Masket, Seth, John Sides, and Lynn Vavreck. "The Ground Game in the 2012 Presidential Election". Political Communication (2015) 33#2 pp: 1–19.
- Mayer, William G.; Bernstein, Jonathan, eds. (2012). The Making of the Presidential Candidates, 2012. Rowman & Littlefield. ISBN 978-1-4422-1170-4. Scholars explore nominations in the post-public-funding era, digital media and campaigns, television coverage, and the Tea Party.
- Miller, William J., ed. The 2012 Nomination and the Future of the Republican Party: The Internal Battle (Lexington Books; 2013) 265 pages; essays by experts on Romney and each of his main rivals
- Nelson, Michael, ed. The Elections of 2012 (2013) excerpt and text search; topical essays by experts
- Sides, John, and Lynn Vavreck. The Gamble: Choice and Chance in the 2012 Presidential Election (Princeton U.P. 2013) excerpt and text search
- Stempel III, Guido H. and Thomas K. Hargrove, eds. The 21st-Century Voter: Who Votes, How They Vote, and Why They Vote (2 vol. 2015).
External links
- The 9 Swing States of 2012
- 2012 Presidential Form 2 Filers at the Federal Election Commission (FEC)
- Election 2012 Presidential Primaries, Caucuses, and Conventions
- 2012 United States presidential election at Curlie
- 2012 Interactive Electoral Map
- Election of 2012 in Counting the Votes Archived August 28, 2019, at the Wayback Machine