Wikipedia talk:WikiProject Maps/Archive 5
A map for every year.
A couple of us have come up with a revolutionary idea for year articles. We thought it would be better if every year article was an actual article instead of a list of events. We made an example: 1345. I made the map of Asia for it (though I must admit I'm a novice and it's not that great), and I think it would be wonderful if every year article had a map of the world (or at least of Europe and Asia) on it. This would especially be important for the earlier years, like 1345. Then everyone could see what the world looked like in each year. I've noticed there are already some cool maps like this, for example Image:East-Hem 900ad.jpg.
Anyway, please feel free to add to the discussion on whether we should turn year articles into prose. -Tea and crumpets (t c) 03:09, 31 December 2007 (UTC)
- Or pick a range of years; if the world's borders didn't change from 1345 to 1355, we don't need 11 different maps, one will do. I agree with this (which is why I created my evolution suite of articles) --Golbez (talk) 04:11, 31 December 2007 (UTC)
- Looks good. Another trick we found was that borders didn't stay the same within the year. Sometimes not even remotely. Albania, for example, was wiped off the map in 1345. Sukhotai became Siam, the Turks and Byzantines were at odds and constantly exchanged territory, etc, etc. It's a real trick deciding what you're going to show on the map and what you're not. Wrad (talk) 07:17, 31 December 2007 (UTC)
- A similar idea was suggested awhile ago for all the Sovereign states by year articles as well and I think the same maps could be used for both. There are a handful of these already done, such as Image:World 820.png. Kmusser (talk) 14:14, 31 December 2007 (UTC)
- Mid-bad idea !!!
- It will be un-manageable to keep the places clean and on the topic. The One map by year project is unfeasable and will be lisleading : not enough sources, how to correct mistakes ? check data ? etc.
- I love History of China, but I should admit than the diference between 633 and 634 is : NOTHING (or almost) allowing to make an article now.
- I encourage you drop the "every" and to focus you on some famous years : 1453, 1492, and recent years (post 1700?: especially 1763, 1783, 1811, 1814, 1830, 1848...) where a great work can be done.
- 220.135.4.212 (talk) 16:59, 8 March 2008 (UTC)
- PS: if you want see the amazing work that it's to make year-by-year maps, look at the AMAZING work of user:Talessman which use his wikipedia user_talk_page only to get high quality feedback (user talk:Talessman) allowing him to SLOWLY walk in this NEVER DONE task.
- 220.135.4.212 (talk) 17:04, 8 March 2008 (UTC)
It could be done with a new parameter in coordinates templates: _country_year(1460-1470) for a state that existed from 1460 to 1470, for example. The user could select the year (1473, for example) and the map could show all the points of this year. —Preceding unsigned comment added by 80.31.233.208 (talk) 18:55, 18 August 2008 (UTC)
University of Oklahoma map
Article(s): University of Oklahoma, and possibly Norman, Oklahoma and other University related articles
Request: -- I'm hoping somebody with graphic design skills can create a map in either PNG or SVG similar to Image:MSU campus map.png for the University of Oklahoma. It would actually be two separate maps, one for the main campus and one for the south campus.
On Google Maps, this link shows the main campus which is already grayed. For the south campus, this map shows the area and it would be from E. Constitution on the north to Hwy 9 on the south and Jenkins on the west to Dewey on the east.
I would be happy to answer any further answers if needed.↔NMajdan•talk 21:05, 10 January 2008 (UTC)
Graphist opinion:
Guidance: map of flight routes
I'm doing research on an article about the various flight routes that people took from German-occupied Norway to neutral Sweden during World War II. Ideally, this should be done on a map that showed the geographical features (mountains, valleys, lakes, rivers) for the various sections where the escapes occured; and that I could plot the routes point by point. If someone could point me to the right resources to figure out how to do all this, I'd be appreciative. I'll check back here, but also feel free to respond on my talk page. --Leifern (talk) 18:57, 29 January 2008 (UTC)
Hi Valakkpp (talk) 16:23, 30 March 2020 (UTC)
possible errors on map
http://upload.wikimedia.org/wikipedia/commons/archive/9/9e/20080201221317%21Submarine_cables.png
linked from http://en.wikipedia.org/wiki/Submarine_communications_cable
1) several lines beginning on the US west coast end at the left side of the map when they should probably continue to Japan and Asia from the right side of the map. For example http://www.telegeography.com/products/map_cable/index.php this map does have the lines terminate in Asia instead of in the Pacific Ocean.
2) one red and one blue line leave from the Denmark/Netherlands area and terminate in the North Atlantic (undersea cables usually terminate at population centers)
3) red represent active cables, blue represent inactive cables but there is no key for the green line between Australia and Tasmania
4) no key explaining the meaning of the dark red line in Alaska
5) the dark red line in Alaska. Undersea cables are usually undersea not above ground.
6) there is no key for the gray dashed lines from the US to China and also seen in the Caribbean
I attempted to address these issues with the author but I was either too unclear or he preferred building strawmen and ignoring questions. I hope these issues can be dealt with or explained.
previous discussion:http:https://www.search.com.vn/wiki/index.php?lang=en&q=User_talk:Rarelibra&direction=prev&oldid=188434665#Map_of_submarine_cables_throughout_the_worldhttp://en.wikipedia.org/wiki/User_talk:74.139.185.198#Sub_cable_map 74.139.185.198 (talk) 03:18, 2 February 2008 (UTC)
City maps - Brussels European Quarter
Hi, I know this is a tad more complex than most but I was wondering if anyone was willing to look into creating a map of the European Quarter in Brussels for Brussels and the European Union. I've been trying to do it myself basing the street layout on Google maps and overlaying the locations from here but my graphics skills aren't any where good enough for something this complex. Just trying to get the outline of Parliament here ended in me producing something akin to a kids painting. If anyone is interested, please contact me on my talk page, I'd be most grateful. Thanks. - J Logan t: 21:44, 3 February 2008 (UTC)
- The sources you mention are copyrighted so we couldn't use them unfortunately. Jackaranga (talk) 14:13, 20 February 2008 (UTC)
How to tag unreferenced maps?
See my post at Template_talk:Fact#Version_for_maps.3F. Comments much appreciated.--Piotr Konieczny aka Prokonsul Piotrus| talk 23:15, 11 February 2008 (UTC)
No Valakkpp (talk) 16:24, 30 March 2020 (UTC)
Second Punic War
I want to draw a map of the troop movements and battles of the second Punic War with gimp. for this I need crossed swords (if possible a blue and a red set) without background and a map of the whole Mediterranean (including Gades in Spain and Pergamon in Turkey, northern Italy and northern Africa) to show the complete range of naval and land operations. Does anyone have an idea where I can find this material on commons or with a free licence? Wandalstouring (talk) 19:17, 2 March 2008 (UTC)
- What sort of output do you need?? I can put something like this together in Inkscape, which supports *.svg and *.png. Let me know, MapMaster (talk) 01:54, 4 March 2008 (UTC)
- That sounds fine, I will create some crude maps on Sunday and present them here. Afterwards you can use them for your better maps. Wandalstouring (talk) —Preceding comment was added at 09:43, 4 March 2008 (UTC)
- It takes me another week, the sources seem not clear on Hannibal's route in Italy. Wandalstouring (talk) 19:23, 9 March 2008 (UTC)
- That sounds fine, I will create some crude maps on Sunday and present them here. Afterwards you can use them for your better maps. Wandalstouring (talk) —Preceding comment was added at 09:43, 4 March 2008 (UTC)

I got so far(218BC-213BC). Black crosses are battles, green borders and red Roman movement and blue Carthaginian movement. The Carthaginian movement in northern Italy isn't clear(take one solution, I will try to clarify this issue). The Green area in northern Italy around the Po valley is Gaul, half of which become insurgent with the arrival of Hannibal(the northern tribes are loyal to Rome, the southern tribes rebel). Thanks for turning it into a decent map. Wandalstouring (talk) 10:01, 18 March 2008 (UTC)
Request for feedback
.svg)
Hi folks,
Can I get some informed feedback on Image:North Island (Houtman Abrolhos).svg. This is my first serious attempt at making a vector map, and my first use of Inkscape. I'd like to get this rather simple map right rather than carry on and make the same mistakes on more complicated maps.
Is it framed right? Is there too much information?
Are the colours right? Would the infrastructure be better in black rather than grey?
Are the text labels okay? Is the font appropriate? Is the font size right?
I've italicised common nouns like lighthouse but left proper names unitalicised. Is this acceptable, or have I unknowingly violated some mapping convention?
"Shag Rock", "North Point", "South Point" and "Northwest Hill" are common but not gazetted names - does putting them in quotes work? Should non-gazetted names appear at all?
Should the island itself be labelled, or can that be taken for granted? Should the surrounding water bodies be labelled?
Is trig acceptable, or must I write trig station or trig point?
Would the hills and lighthouse be better represented by icons rather than dots?
Should I convert the text to strokes?
Hesperian 11:49, 10 March 2008 (UTC)
- I think it looks great, only changes I'd make is I would expand trig to trig station, and I think the quotes look a little awkward. I'd take the quotes out and just list which names are non-gazetted in the description. I don't think they need to be marked differently on the map. Kmusser (talk) 13:24, 10 March 2008 (UTC)
- Looks very good. I'd also leave out the quotes. Some more suggestions:
- Make paths (coastlines, etc) smooth (mark object->"Edit path nodes or control handles" (F2) -> mark all nodes (Ctrl a) -> "Make selected nodes smooth") and simplify the jetties, especially the one on the top
- Add a map showing the location with respect to Australia since most readers (at least me) would have difficulties locating the Island on a world map. An example of what I mean can be found here.
- Add a label for the water body
- Find better placements for the labels
- Maybe crop the whole map a little on the top, right and bottom to make distances to the boundaries equal
- "salt lake" is too close to the lake
- Labels crossing coastlines don't look good. Put them either on land or the sea.
- Try to align labels such that the top-left (or bottom-left, top-right, top-left) corner of the label is pointing at the object in question. Top-center or Bottom-center (as in "salt lake") is also fine, but Mid-left/Mid-right (as in "Record Hill") don't look as good IMHO.
- Bamse (talk) 02:12, 11 March 2008 (UTC)
Thanks guys. I have made a number of changes in response to Kmusser, and others on my talk page. I will have a crack at Bamse' comments over the next day or so. Hesperian 02:18, 11 March 2008 (UTC)
SVG help needed

Hello everyone. I'm working on svg conversion of my Image:Rzeczpospolita 1920.png (well, AAMoF I'm recreating it). So far I was fairly successful and the new map (Image:Rzeczpospolita 1938.svg) started to look nice. However, I recently added texts to it and all of a sudden the map stopped showing when I uploaded a new version to Commons.
At first I used the standard Arial font, then gave the default one a try - to no avail. The map doesn't show on the image page, nor does it resize properly in articles. Any idea what might have went wrong? Any suggestions? //Halibutt 22:26, 13 March 2008 (UTC)
- I think the text problem is a bug. You could try converting the text to stroke (or shapes, or whatever it's called in the svg editor you're using) and upload it like that, but it can make the file larger and impedes translation or updating. (ie, if you made a mistake, you have to re-write an entire section of text to replace it.)
- When I have this problem, I just export the .svg as a .png and upload the .png instead. It isn't as convenient as the .svg but as long as the .svg exists, it can be updated easily. :/ vıdıoman 22:48, 13 March 2008 (UTC)
- As long as you have the .svg version, you'll retain the easy customizability that you don't have with a .png. If you want to avoid .png, then make the text into shapes, or wait until someone more experiences gives us a solution to this problem. vıdıoman 23:32, 13 March 2008 (UTC)
- Strangely, if you click through the image, the full size SVG renders just fine. The problem appears to be occurring with MediaWiki's attempt to thumb it down. Whether that is MediaWiki's fault or your file's fault, I can't say. Hesperian 23:38, 13 March 2008 (UTC)
.
- Thanks, Madman, you're my hero :) I can't tell what's missing in the version you uploaded, which means the artifact was not needed. Or perhaps it were the layers? Layers make the work easier, but it seems MediaWiki has problems rendering them properly. BTW, what software are you using for svg graphics? //Halibutt 08:43, 14 March 2008 (UTC)
- Glad to help, Halibutt. I use good ol' Inkscape, but I'm far from an expert. In fact, I don't even know how to use "layers". What I did do was to delete your groups from the svg, one by one, and upload what was left. I found that even after I had deleted every visible group, the svg still would not render correctly. So I opened a new svg and started copying the groups over to it, one by one, uploading each version until I had finally moved them all, and the last upload still rendered properly.
- I'm not sure what that "artifact" was. But I guess I don't care. : ) Have fun! Madman (talk) 12:27, 14 March 2008 (UTC)
- Thanks, Madman, you're my hero :) I can't tell what's missing in the version you uploaded, which means the artifact was not needed. Or perhaps it were the layers? Layers make the work easier, but it seems MediaWiki has problems rendering them properly. BTW, what software are you using for svg graphics? //Halibutt 08:43, 14 March 2008 (UTC)
Wrong Inner German border

In this picture the border between East and West Germany in this image is not at all where it should be, see Inner German border. It is just some kind of circle segment. West Berlin ist also misssing (i.e. a part of East Germany).
I contacted the author twice (see User talk:Bože pravde#Wrong Inner German border and commons:User talk:Bože pravde#Wrong Inner German border), but he is not reacting. Can anyone help please? --Abe Lincoln (talk) 08:54, 14 March 2008 (UTC)
- I fixed the border, I didn't add West Berlin as it would just be a dot at that scale. Kmusser (talk) 12:50, 14 March 2008 (UTC)
Thanks a lot. --Abe Lincoln (talk) 13:28, 14 March 2008 (UTC)
Something amiss in Scotland
A conversation about the current maps used to represent the constituent countries has been started at Wikipedia_talk:WikiProject_UK_geography#Something_amiss_in_Scotland. This discussion is hopefully to resolve issues that have been raised and to try to set a standard within the UK. For all those that wish to comment on this, your input is requested. Thank-you :-) -- UKPhoenix79 (talk) 00:46, 27 March 2008 (UTC)
Map symbols for lighthouse?
I am considering drawing a map (SVG of course!) of an island located in the Stockholm archipelago. This island has a lighthouse. Does anybody know what symbol to use? Please, help me! --Astor Piazzolla (talk) 11:11, 29 March 2008 (UTC)
- I typically see lighthouses depicted on maps like this. The spot is the location of the light house, and the cone part is the "light"; it should point out to the water. You could also go with a simple drawing of a lighthouse itself, and just place that on the map. (That image was made by me; if you want an SVG version I can give you one. :)) vıdıoman 11:38, 29 March 2008 (UTC)
- Thanks for your fast reply... However, not meaning to be ungrateful, I still am interested in using other symbols, like this, where the pentagon stars symbolize the lighthouses, or the older Swedish (?) symbol looking more like a light bulb. Do you think I could use such symbols? Or are there any other wiki maps with lighthouse symbols? --Astor Piazzolla (talk) 12:03, 29 March 2008 (UTC)
- Thanks for valuable advice. I will try to use this symbol, it seems to be the current official Swedish lighthouse symbol. I will add the legend to the map! --Astor Piazzolla (talk) 15:50, 29 March 2008 (UTC)
Maps for the constituent countries in the UK


I have created the above maps. I hope you all don't mind that I was WP:BOLD and added them to the relative articles myself. I really don't want to create any edit wars I just want to see what others think and hopefully bring this to a nice consensus on what to use. I hate the idea that other countries seam to be more organized then us with these things, so I hope you think the new one looks professional... I'm actually kinda pleased :-) Please voice your opinion over at Talk:Scotland#Straw_Poll I know I'd personally love to hear your opinions! Thanks -- UKPhoenix79 (talk) 05:11, 30 March 2008 (UTC)
- It looks good. The all-Europe map can be used for the United Kingdom as a whole but I think this is good enough for the constituent countries. The maps for American states don't show all of North America, likewise for Canada's provinces. vıdıoman 10:07, 30 March 2008 (UTC)
- what was the source data used? There are not many initial sources that are free - looking at your colours I am guess you've used MapInfo to create these (I may be wrong, but MapInfo and ArcMap tend to favour certain colour schemes by default) So you must have loaded the initial vector data from somewhere - we need to cite that source and establish that it is free - otherwise the OS lawyers could say it is derived from OS data and therefore © to them. --C Hawke (talk) 15:31, 2 April 2008 (UTC)
- UKPhoenix79 can speak up for himself if I'm wrong, but based on which lakes are included it looks like it was ultimately derived from the CIA Factbook maps. The colors are the standardized colors suggested by this project. Kmusser (talk) 16:29, 2 April 2008 (UTC)
- what was the source data used? There are not many initial sources that are free - looking at your colours I am guess you've used MapInfo to create these (I may be wrong, but MapInfo and ArcMap tend to favour certain colour schemes by default) So you must have loaded the initial vector data from somewhere - we need to cite that source and establish that it is free - otherwise the OS lawyers could say it is derived from OS data and therefore © to them. --C Hawke (talk) 15:31, 2 April 2008 (UTC)
Vote on standard colors and gallery of exemplars

The two threads below have been on the talk page for a long time now. I've also noticed that many people are already following its suggestions, such as in the example to the right. I recommend that we vote on moving these guidelines out of the talk section onto the main project page. Please vote Support, Oppose or Comment. Tomcool (talk) 18:49, 30 March 2008 (UTC)
- Consensus: I believe that enough time has passed for discussion, and the consensus is Support. I'll wait another week or so, and then move the following to the project page. Please adjust the language as appropriate. Tomcool (talk) 16:37, 12 July 2008 (UTC)
- The gallery and standard colors had already been moved to the project page. I subbed the language and the version of the gallery that had been voted on. I also moved the sections to the "Standard Conventions" section. This should close out this thread, which was begun more than two years ago by Roke's edit of 5 May, 2006, "Map Colors". Further discussions about adding a new exemplar, or adjusting the standard colors, should probably take place in a new thread. Tomcool (talk) 16:58, 2 August 2008 (UTC)
- Consensus: I believe that enough time has passed for discussion, and the consensus is Support. I'll wait another week or so, and then move the following to the project page. Please adjust the language as appropriate. Tomcool (talk) 16:37, 12 July 2008 (UTC)
The goal of a free, on-line encyclopedia is furthered when maps are properly designed with a clear, consistent look and feel. The following are the standard colors for maps:
| Color | Hex | RGB | Sample | Used for | |||||||||||||||||
|---|---|---|---|---|---|---|---|---|---|---|---|---|---|---|---|---|---|---|---|---|---|
| Black | #000000 | 0, 0, 0 | Primary label color | ||||||||||||||||||
| Brown | #A08070 | 160, 128, 112 | Political borders. Country, state, and province borders should be brown. | ||||||||||||||||||
| Light brown | #D0C0A0 | 208, 192, 160 | Secondary political borders. | ||||||||||||||||||
| Light yellow | #FFFFD0 | 255, 255, 208 | Primary territory of interest, or one of four choices for four-color maps. | ||||||||||||||||||
| Pink | #FFD0D0 | 255, 208, 208 | Another color to be used for four-color maps. | ||||||||||||||||||
| Orange | #F8A20C | 248, 162, 12 | A third color to be used for four-color maps. | ||||||||||||||||||
| Green | #3CE67B | 60, 230, 123 | A fourth color to be used for four-color maps. | ||||||||||||||||||
| Light blue | #CEFEF2 | 206, 254, 242 | An alternate color to be used for four-color maps. | ||||||||||||||||||
| Orange | #F7D3AA | 247, 211, 170 | Alternative color for the above Tan (surrounding territories). | ||||||||||||||||||
| Medium blue | #9EC7F3 | 158, 199, 243 | Bodies of water. Oceans or lakes. | ||||||||||||||||||
| Blue | #1821DE | 24, 33, 222 | Water borders, if necessary. For lake or ocean borders that need a color contrasting with surrounding land, or for rivers. | ||||||||||||||||||
| Red | #B00000 | 176, 0, 0 | Points of interest. Cities, especially. | Red | #B00000 | 176, 0, 0 | Red | #B00000 | 176, 0, 0 | Red | #B00000 | 176, 0, 0 | Red | #B00000 | 176, 0, 0 | Points of interest. Cities, especially. | |||||
| Red-orange | #F07568 | 240, 117, 104 | Alternative color for the above Red (points of interest). | ||||||||||||||||||
| Medium red | #E0584E | 224, 88, 78 | Border color for areas highlighted in Red-orange | ||||||||||||||||||
| Green | #A0F090 | 160, 240, 144 | Parks or natural preservation areas |
The following is a gallery of exemplar maps:
 UK outline map
 Ancient Greek Colonies of North Black Sea
Example of inset Florida Political Map
 Texas Locator Map with US inset.
 Blank map of India, used as a base map for other India maps. It is a featured picture and an example of a SVG format map.
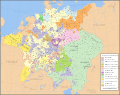 An historic map example featuring the Holy Roman Empire.


Standard map colors
Move the Map Colors table below to the main Wikiproject Maps page, with language that these are the recommended, standard colors for maps in Wikipedia.
- Support: We need standard colors to give WP a consistent look. These colors are proven to lend themselves to clear, professional-looking maps. They are already on their way to becoming de facto standards; moving them to the main project page will help advance them toward a de jure standard. Tomcool (talk) 18:49, 30 March 2008 (UTC)
- Support: I agree: we need standard colors for maps in Wikipedia. MapMaster (talk) 00:30, 29 April 2008 (UTC)
- Support: Agreed, as mentioned they're already de facto standards, putting them on the project page should help visibility. Kmusser (talk) 13:55, 29 April 2008 (UTC)
- Comment: I'm currently translating some French Wikipedia cartography articles which refer in passing to standard cartography conventions. These have been agreed and clearly laid out on the main French Maps Project page, but as far as I can see are still only at the discussion stage here. There seems to be little remaining debate, so I wonder if a project member could perhaps undertake setting the standards out clearly on the main page? Then I could point my links to them rather than to this discussion! Thanks in advance. JaneVannin (talk) 07:28, 1 July 2008 (UTC)
Gallery of exemplars
Move the Gallery of Exemplars out to the main Wikiproject Maps page, with language that these maps are examples of standard maps in Wikipedia.
- Support: A gallery of exemplars is the quickest and clearest way to communicate what standard maps should look like. Tomcool (talk) 18:49, 30 March 2008 (UTC)
- Support: Yes, they should be on the front Project Page. Madman (talk) 05:12, 2 April 2008 (UTC)
- Support: Yes, will help support the standard colors adoption. Kmusser (talk) 13:55, 29 April 2008 (UTC)
Gallery of Exemplars
As I suggested in the Map Colors discussion below, having a gallery of exemplars might help to advance our discussion of standards. These exemplars might also serve as an interim standards for mapmakers to use until the project establishes standards. Since mapmaking (and reading) are extremely visual, it helps to be able to see what people are talking about. Here is a suggestion of what such a gallery might look like:
- UK outline map
Standard colors:
Medium blue - 9ec7f3
Yellow - ffffd0
Tan - f7d3aa
Additional colors:
Gray - 808080 - Ancient Greek Colonies of North Black Sea
Example of inset
Standard colors:
Medium blue - 9ec7f3
Yellow - ffffd0
Black - 000000
Blue -1821de
Additional colors:
Red - ff3329
Taupe? - 4d4d4d
NavyBlue? - 0000aa - Florida Political Map
Standard colors:
Medium blue - 9ec7f3
Yellow - ffffd0
Black - 000000
Orange - f7d3aa
Additional colors:
PowderBlue? - cee3e9
BrightYellow? - ffff00
Red? - ff0000
- Texas Locator Map with US insert. A popular map.
- Blank map of India, used as a base map for other India maps. It is a featured picture and an example of a SVG format map.
- An historic map example featuring the Holy Roman Empire.
People could then add, delete or change the comments as the discussion on standards advances. Tomcool 13:46, 30 December 2006 (UTC)
Map colors
We need to come up with a standard palette of colors to recommend for use in all geographical maps. The previous use of "Pink" (FF0D0) and "Lavender" (F2D0FF) as third and fourth colors for four-color maps is unworkable.
| Color | Hex | RGB | Sample | Used for |
|---|---|---|---|---|
| Black | #000000 | 0, 0, 0 | Primary label color | |
| Brown | #A08070 | 160, 128, 112 | Political borders. Country, state, and province borders should be brown. | |
| Light brown | #D0C0A0 | 208, 192, 160 | Secondary political borders. | |
| Light yellow | #FFFFD0 | 255, 255, 208 | Primary territory of interest, or one of four choices for four-color maps. | |
| Pink | #FFD0D0 | 255, 208, 208 | Another color to be used for four-color maps. | |
| Orange | #F8A20C | 248, 162, 12 | A third color to be used for four-color maps. | |
| Green | #3CE67B | 60, 230, 123 | A fourth color to be used for four-color maps. | |
| Light blue | #CEFEF2 | 206, 254, 242 | An alternate color to be used for four-color maps. | |
| Orange | #F7D3AA | 247, 211, 170 | Alternative color for the above Tan (surrounding territories). | |
| Medium blue | #9EC7F3 | 158, 199, 243 | Bodies of water. Oceans or lakes. | |
| Blue | #1821DE | 24, 33, 222 | Water borders, if necessary. For lake or ocean borders that need a color contrasting with surrounding land, or for rivers. | |
| Red | #B00000 | 176, 0, 0 | Points of interest. Cities, especially. | |
| Red-orange | #F07568 | 240, 117, 104 | Alternative color for the above Red (points of interest). | |
| Medium red | #E0584E | 224, 88, 78 | Border color for areas highlighted in Red-orange | |
| Green | #A0F090 | 160, 240, 144 | Parks or natural preservation areas |
Feel free to add or revise the colors above and suggest new colors for specific purposes.
- This is an important idea but doesn't take into account the complexity of map-making. Reading over the list of suggested uses, this looks to me like a scheme for regional or perhaps national maps; cities are shown, perhaps, as small dots or symbols. Many maps are of this type but many are not.
- City maps must show, at a minimum, highways, arteries, and streets; by convention most maps use different colors for each. Topographic maps show contour lines; railway maps (among others) show rail lines. Demographic maps and their relatives tend to use large numbers of colors to show populations or distributions of some variable. (Personally, if the variable assumes ordered values I strongly prefer tints of one basic color.) Mass transit maps are often drawn by transit agencies to reflect scheduled service that is named by color (see Chicago 'L'); we must follow these schemes.
- I do strongly agree that map standardization contributes to the overall professionalism of the project. Color palettes only scratch the surface; fonts, line styles, and a host of other variables ought to be standardized. I do fear, though, that there are simply too many existing maps in widely various styles to be redrawn. These act as a giant boat anchor opposing any effort at standardization. Still, I feel there's some value in the effort. John Reid 09:15, 14 May 2006 (UTC)
- Multiple pastel shades are very difficult to distinguish on LCD screens, like my laptop. I would encourage the use of more highly saturated colors than the ones proposed, for color-coded maps where the color carries the information content. (Rather than just helping to increase the contrast between two sides of a black-line border.) -- Beland 01:36, 4 June 2006 (UTC)
- Any opinions on the colours to use when shading a map by height? I personally quite like a progression from green (sea level) to yellow (low hills) to white (mountains) and perhaps to purple (for the very highest mountains). -- ras52 12:11, 2 August 2006 (UTC)


- Thanks for making such a comprehensive and useful recommendation. I think adoption of a palate (or a series of palates) such as this one is a good way to go. One quibble: the basic color, Light yellow,#FFFFD0, is a little vibrant, maybe even garish, when used for large areas. I noticed that a lot of good maps used in Wikipedia use a slightly tamer yellow, #FFFFEO, so I recommend establishing that as a standard. (Example in a map I built is at right.) One other recommendation to help advance this issue: we should create a gallery of good maps that we can refer to as interim standards and as examples to advance discussion. (Interestingly, if you browse all maps that have been Featured Pictures in Wikicommons, there's only a handful, and they don't immediately suggest a standard.) One of the maps we should consider for this gallery is the outstanding map of Switzerland (to the right.) Tomcool 23:20, 26 December 2006 (UTC)
- I am at a loss as to why the Switzerland map is an exemplar. While the use of shading makes for an interesting effect, it does not produce the clarity that we need here, particularly for so complex a map as that of Switzerland. In addition, the names/labels on the map are too small to be read except at the higher magnifications. Moreover, of the five maps shown as exemplars, this one does not use anything close to the standard colours. Thanks for listening, Madman 05:12, 5 January 2007 (UTC)
- Thanks for making such a comprehensive and useful recommendation. I think adoption of a palate (or a series of palates) such as this one is a good way to go. One quibble: the basic color, Light yellow,#FFFFD0, is a little vibrant, maybe even garish, when used for large areas. I noticed that a lot of good maps used in Wikipedia use a slightly tamer yellow, #FFFFEO, so I recommend establishing that as a standard. (Example in a map I built is at right.) One other recommendation to help advance this issue: we should create a gallery of good maps that we can refer to as interim standards and as examples to advance discussion. (Interestingly, if you browse all maps that have been Featured Pictures in Wikicommons, there's only a handful, and they don't immediately suggest a standard.) One of the maps we should consider for this gallery is the outstanding map of Switzerland (to the right.) Tomcool 23:20, 26 December 2006 (UTC)
ColorBrewer
I would consider that we adopt the pallette of color brewer. SCmurky 23:49, 2 August 2006 (UTC)
- Which ColorBrewer palette? The best-looking one for height seems to be the fourth sequential one which runs from dark green, through increasingly pale colours to a cream, but I don't think that's ideal — for a start I'd prefer it all to be paler, go to white (rather than cream), and perhaps beyond white to purple. But maybe ColorBrewer can do more than I'm realising. Was this the colour scheme you had in mind? -- ras52 08:56, 3 August 2006 (UTC)
- I was just thinking in general, because it takes time to establish conventions regarding map colors, and colorbrewer does have a standard palette with lots of variety. This would probably work better than the list we have above. Do you know of a more extensive list of colors for use in maps? SCmurky 17:34, 3 August 2006 (UTC)
Also I would have to say I disagree with any efforts to limit color choices within cloropleth maps (eg. pink, green, red, blue for a 4-color map), no matter the number of classes. Colorbrewer has a large palette, this would offer some standardization for colors, without limiting choice (eg. pastel vs. darker colors). SCmurky 17:40, 3 August 2006 (UTC)
- The recommendation to use Colorbrewer is a well-considered one. A lot of work has gone into establishing these standard palettes, and many aspects have been addressed, such as friendliness for color-blindness and photocopying. The Colorbrewer interface is also excellent. The problem, IMO, is that the many of the color choices could be better. Many of the colors are unnatural and garish. This is an aesthetic question, I know, but I think that some of the palettes are ugly and maps made from them are going to tend to be ugly maps. I'd like to hear from some more experienced map-makers and maybe some graphic artists, fine artists (especially painters), or photographers or colorists to see what they think. Tomcool 23:31, 26 December 2006 (UTC)
Coordinates frequently show up on top of the line under page title
See Dospat Dam for an example. Isn't there a way to ensure that they stay in an appropriate position? e.g., above the line - or below the line, but not running through the line?? -- Martha (talk) 04:06, 2 April 2008 (UTC)
- Problem is currently being discussed at Template_talk:Coord. Kmusser (talk) 04:53, 2 April 2008 (UTC)
Advice on this map?
 This is my
 first attempt at a map, made by combining a satellite photo with an orthogonal map. However the horizontal scale is visibly different on the two. Is it "fair" to stretch the satellite photo to match the scale of the orthogonal map?! If so, is there a (relatively) simple way I can be sure I am doing it accurately? Or, could I somehow make the satellite map orthogonal? Any suggestions will be welcome. — Martha (talk) 07:13, 2 April 2008 (UTC)
- If you have details on the projection information for both the image and the map it would be possible to make them match using GIS software - assuming you're not that lucky you can just stretch one or the other to match using something like Photoshop as long as you have landmarks that you can clearly identify on both in order to line them up. Kmusser (talk) 14:55, 2 April 2008 (UTC)
- So, not being "that lucky"....using the coordinates on (this map, plus the original two maps, should enable me to adjust the satellite image manually, and then recreate what I have here? But why would a satellite image be out-of-proportion? Foreshortening in the photograph maybe? (you can tell I am NOT a caratographer!) — Martha (talk) 18:38, 2 April 2008 (UTC)
- Yes, and they're probably just two different map projections, all maps are distorted in some direction - it looks like that image has already been orthorectified so it's probably not something in the image itself. Anyway the process of manually adjusting images to match is called rubbersheeting in cartography, so if want more info google rubbersheeting and maps or GIS. Kmusser (talk) 13:25, 3 April 2008 (UTC)
- So, not being "that lucky"....using the coordinates on (this map, plus the original two maps, should enable me to adjust the satellite image manually, and then recreate what I have here? But why would a satellite image be out-of-proportion? Foreshortening in the photograph maybe? (you can tell I am NOT a caratographer!) — Martha (talk) 18:38, 2 April 2008 (UTC)
What you'll see here now is a complete re-make of the map. I think it's an improvement. I tinkered with the scaling of the photo, using the blank orthogonal map as a reference point (I realize that's not terribly precise, but I do tend to be terribly careful, so I don't think it was a bad job - actually it only seemed to need a little vertical stretching (so why did the original LOOK so bad? maybe because the photo needs more sensitive correcting - all I could take into account were the extreme N-S-E-W points). Then, instead of referring my segment to the orthogonal map, I simply cut it out of the original (adjusted) photo, cleaned up so you can see the outline of the country, and reduced that to an appropriate size. I rather like this myself - do you experienced folk have an opinion? Once it's "good enough" I plan to move the image to Commons, and put it on the Dospat Dam page. -- Martha (talk) 22:38, 4 April 2008 (UTC)
reproducing maps
hi, would it be possible to get someone to reproduce the map at the extreme bottom of this page? -maps.blog.com.mk/ at the extreme bottom.
i was having some trouble with the copyrighting system usec by wikipeida. if anyone has any sugesstions or help it would be greatly appreciated.
P m kocovski (talk) 07:52, 4 April 2008 (UTC)
- I located the original of this map, [here]. It was made by a Polish gentleman named Wojtek - why don't you try to contact him about using it? He gives code for embedding it, however that's different from making it copyright-free. You wouldn't be able to use it on Wikipedia unless it's copyright free, but probably elsewhere? I'm a bit confused about that too, but if you join Wikimedia Commons and try uploading something there - you don't actually have to complete an upload, but I discovered that if you select any of the licensing options they offer, you will be able to SEE what it puts up, and I found that very helpful. — Martha (talk) 22:27, 4 April 2008 (UTC)
- I will try to upload the picture but if not would it be possible for someone to reproduce the map? Oh and by the way map you found is different to the map i found (see north greece, south-west bulgaria), just for clarification reasons. thank you P m kocovski (talk) 00:56, 5 April 2008 (UTC)
What's wrong?
Any ideas as to what might have went wrong with this one on the right? When clicked, the image shows just fine, but it does not scale down nor does it show up well in thumbnails. There's no layers in that image, nor is there any grouped objects - yet it does not show up well... Any ideas? //Halibutt 11:58, 7 April 2008 (UTC)
- Fixed. Use the "vacuum defs" option in Inkscape to remove unused code. I did this then saved as plain SVG and reopened the file in Inkscape. This revealed that the red ring was on top of the yellow. The red ring didn't have a fill-rule specified which meant that it used the default value nonzero which just meas that it looks like a filled disc. problem was solved either by moving the red ring so that it lies underneath the yellow (which I did) or to specify fill-rule:evenodd for the red ring. /Lokal_Profil 13:24, 7 April 2008 (UTC)
Licensing of maps
One problem that I've found is in the incompatibility between the GFDL and the CC licenses. The main problem occurs if I want to create a Vector map based on say a GFDL licensed original and a CC licensed original. The problem then is that I'm not technichally allowed to make a derivative at all. Obviously we can't force anyone to license their maps under a specific license and everyone tends to have their own preference. Still it would be good if the issue was raised and discussed. I know that dual licensing is possible but what I (and I'm guessing a lot of others with me) don't know is how dual licenseing would affect the by-sa part of a cc-by-sa license. /Lokal_Profil 13:14, 7 April 2008 (UTC)
- There's no problem. What dual-licensing means is that you are free to choose between the two--GFDL or CC--when you use or derive from the original. You don't have to follow both. --seav (talk) 23:16, 7 April 2008 (UTC)
- No, that is a problem. If you create a Vector map based on a GFDL licensed original and a CC licensed original, and release it under a dual license, then you've released a GFDL derivative under CC without permission, and a CC derivative under GFDL without permission. I don't think there is a solution to this situation except to ask one or both licence holders to consider releasing their material under another licence. The one time I tried this I got immediate satisfaction.[1][2] Hesperian 23:57, 7 April 2008 (UTC)
- Ah wait, I misunderstood the problem. I thought that Profil wanted to create a derivative of a single map that is dual licensed. I guess it's supposed to be that he wants to create a single derivative map from two different original maps that are differently licensed. In the second case, I agree that the derivative can't be created since the derivative can't satisfy both of the original licenses. --seav (talk) 15:42, 8 April 2008 (UTC)
- Well it was actually a bit of both. The general problem is the incompatibility of the licenses. on way to get around that would be to recommend map creators to dual-license their images (or PD-license them). here the second question comes in. If I definitly want my images to be under a by-sa type license (i.e. I qant atteribution and share alike to be required) then how hollowed out will this part bee by dual licensing the image with a GFDL license? If I understood things right GFDL has a built in share-alike requirement (basically every derivative of a GFDL object must also be GFDL) but does GFDL have any attribution requirement built in? /Lokal_Profil 16:35, 10 April 2008 (UTC)
- Ah wait, I misunderstood the problem. I thought that Profil wanted to create a derivative of a single map that is dual licensed. I guess it's supposed to be that he wants to create a single derivative map from two different original maps that are differently licensed. In the second case, I agree that the derivative can't be created since the derivative can't satisfy both of the original licenses. --seav (talk) 15:42, 8 April 2008 (UTC)
- I think modifications to a dual-licensed image can be created under the same dual licensing, as the alterations can be viewed as being done under both licenses and modifications are being licensed in parallel (thus the licenses don't cross-conflict due to modification under the 'other' license). An image which is dual licensed under GFDL and attribution-required can lose the attribution license in copies which are forked out under only the GFDL; I think a copy can be made under only the GFDL. It's inherent in dual licensing that the licenses can stand alone of each other. -- SEWilco (talk) 16:52, 10 April 2008 (UTC)
general-use Pacific-centered SVG world map
- horribly skewed attempt from Commonshorribly skewed attempt from Commons
 colorful one from Commons
 this type of map is needed
 Start SVG
 180E
180E 162E
162E


Article(s):
Request: There's not really a good general-use Pacific-centered SVG world map on the 'pedia. Anyone up to the challenge? -- Chris (クリス • フィッチ) (talk) 18:54, 13 April 2008 (UTC)
Graphist opinion:
That image is copyrighted according to the text in the corner. I don't think we'd be allowed to trace it? vıdıoman 20:01, 13 April 2008 (UTC)
- The image is copyrighted, the shape of the continents cannot be. Chris (クリス • フィッチ) (talk) 20:18, 13 April 2008 (UTC)
- Another user has taken on the base challenge of SVGifying, is anyone else up to making this one square instead of the original elliptic, with Africa all one piece, as the Atlantic-centered one is not split thus? Chris (クリス • フィッチ) (talk) 20:48, 13 April 2008 (UTC)
- There exists a is a python script specifically designed to modify Image:BlankMap-World6.svg. Amongst other thing it can rotate the map. I'll see what I can do, which longitude line should be in the center? /Lokal_Profil 21:30, 13 April 2008 (UTC)
- It won't be an exact match, just as Greenwich is not really the center of Image:BlankMap-World6.svg. But if you were to use the International Date Line, that would be close. Chris (クリス • フィッチ) (talk) 21:45, 13 April 2008 (UTC)
- If a set it to 180 then I get a map similar to the leftmost one above, i.e. Africa split into two parts. I'll try around and see if I can get something which keeps Africa intact, Island will probably suffer though. /Lokal_Profil 22:04, 13 April 2008 (UTC)
- Any way to make this a rectangle projection, and leave a whole Iceland on the side with Europe? Thanks! Chris (クリス • フィッチ) (talk) 07:44, 14 April 2008 (UTC)
Copyright of maps
In response to the issue of tracing copyrighted maps raised above, I would like to clear this up once and for all.
Short answer: Kintetsubuffalo is correct, and well said: "The image is copyrighted, the shape of the continents cannot be."
Long answer:
With text, copyright applies not to the concepts expressed, but to the words used to express the concepts. The same is true for maps. Copyright applies not to the geographic concepts underlying the map, but to the symbology used to represent those concepts.
The shape of land-forms, the position of roads, the location of towns, the extent of vegetation - all of these are geographical concepts that are represented by the map, and therefore cannot be copyrighted. You are free to trace a copyrighted map, satellite image or photograph, in order to obtain this information.
However, you may not take from a copyrighted map its layout, its colour scheme, its icons, its extent, its text placement, its fonts, its line styles, its line thicknesses, its legend, its compass ross, etc. These graphical components of the map are the result of a creative process by the cartographer, and subject to copyright. On these points, you must make your own decisions, thus representing the underlying geographical data in your own way.
If you are working in SVG, it is pretty easy to comply with these rules. Step One: Capture the geographic information by tracing the map using a very fine black line stroke. Step Two: Put the copyrighted map out of your sight, and make your own independent decisions on how to adjust your fill and stroke properties.
Hesperian 03:21, 14 April 2008 (UTC)
- That could be contested. If, for example, the original map maker omitted certain small islands in a creative process of simplifying the map and you copied the same, then you could be infringing on the original map's copyright. Same goes for the curvature of the shapes of linear features (in certain maps). If you copy the exact same corner points in a curve, then you could also be infringing on the map's copyright. Additionally, there's the problem of copyright easter eggs. In a nutshell, tracing over a copyrighted map is not as simple as it seems copyright-wise. --seav (talk) 04:37, 14 April 2008 (UTC)
- Yes, I agree with all your points. Another issue is that the act of tracing implies the acceptance of the original map's projection, which is another creative decision that ought to be taken independently. And another issue is that of necessarily misplaced features; for example at small scales it is impossible to accurately represent a road running alongside a railway line; the distance between these two features must be exaggerated in order to make the map readable.
- The principle remains, I think we agree, that only the representation is copyrightable, not the geographical data being represented. Hesperian 04:44, 14 April 2008 (UTC)
- Yeah, I guess we agree. But it should be very clear what is creative representation and what is uncopyrightable fact. So I think that we should still caution against blindly tracing over a copyrighted map unless the tracer knows exactly what to copy and what not to copy. --seav (talk) 05:38, 14 April 2008 (UTC)
"Step One: Capture the geographic information by tracing the map using a very fine black line stroke." Sorry, but if you do that to anything produced by the UK's Ordnance Survey you will be breaking their © and liable to be chased by their department they have specifically for this task - any such maps can only be published with their permission and citation, in this case it would contain the wording "derived from" - believe me they take this seriously, I have seen official presentations from them, showing the lengths people go to to get around it and how OS have proven that a finished map, however simplified, was derived from their data.--C Hawke (talk) 11:58, 14 April 2008 (UTC)
- You're preaching to the converted mate; we've already been through this. Hesperian 12:03, 14 April 2008 (UTC)
- One should also keep in mind that the UK extends copyright more or less based on the effort of creation, and not strictly based on creativity. They are one of the most liberal jurisdictions for doing this, and it implies the OS can assert copyright (at least within the UK) over many things that would be considered uncopyrightable facts in the US. Dragons flight (talk) 12:35, 14 April 2008 (UTC)
This analysis is on shaky grounds, I think. While it is true no one can "copyright" the shape of a country or a continent, tracing a map is making a derivative work of that map, and only the original copyright holder has that right under U.S. copyright law. Courts have ruled differently on this matter in the past, so there is no one hard and fast answer to what consititutes a copyrighted "original" map. See [3]. If you create a reproduction of a map using the original data sources or other public sources, you aren't copying it. But tracing the map would be considered copying and an infringement of the owner's copyright. A circuit court in Oregon ruled (1882), for example, that merely changing the scale or color of a map is infrining on the copyright (Chapman v. Ferry). Even OpenStreetMap.org states its own page that it does not permit people to "use" a copyrighted map (Google Maps, printed maps, or satellite images) in any way when editing a map on their site, including tracing it. They consider this "copying." Since OpenStreetMap has similar requirements to Wikipedia when it comes to "free (as in speech)" content, I would say that such tracing and copying should not be permitted here. Just my two cents.Dcmacnut (talk) 17:45, 16 April 2008 (UTC)
- Also, whilst the shape of the continents isn't copyrighted, it's possible that the mapping company's representation of the shape of the continents might be. It's very unlikely that you'll be able to represent the shape of a continent exactly on a map - you will usually have to make certain concessions (e.g. slightly reduced complexity). Also, it may be necessary to move certain features slightly to ensure that the map remains legible and that all of the features are visible. Surely that would mean that *some* creativity has gone into creating the map. It's not a facsimile of what's on the ground. Richard B (talk) 21:14, 16 April 2008 (UTC)
- It should be noted that OpenStreetMap does trace over satellite imagery from Yahoo! Maps since Yahoo! Maps gave permission. I'm actually wondering if Yahoo! is permitted to do that since most of its worldwide satellite imagery is licensed from GeoEye; I'm not sure GeoEye and other providers' licenses permit third-party (i.e., OSM) reuse. --seav (talk) 22:11, 16 April 2008 (UTC)
- Typically a satellite imagery provider will license a set of rights to its clients (e.g. Yahoo). These rights may include "derivation rights" and the ability to sublicense said rights. The Yahoo/OSM agreement has been cleared by Yahoo's lawyers and has been visible without problems for a good while now. --ChaRleyTroniC (talk) 14:36, 29 April 2008 (UTC)
First map, comments please
Just uploaded my first map, in svg and png, any comments welcome. My svg is plain, not inkscape and I've converted the text into paths - but it still doesn't render properly. Can you point out where I'm going wrong? Ki | jog 22:00, 24 April 2008 (UTC)
- I believe I've fixed the rendering problems with your map. There were some hidden/invisible artifacts within the map. I located and deleted them in Inkscape using the TAB function. It should render properly now (although make sure to clear your browser cache, which may retain the old version).
- Regarding the map, I think it is excellent -- surely this cannot be your first attempt at a map. Keep up the good work, Madman (talk) 22:01, 29 April 2008 (UTC)
- In response to your posting at Commons, KVJ, I don't know what you did to create those black boxes. They are caused by invisible or hidden objects within the file. I really don't know how much more than that about them -- I'm by no means an SVG (Inkscape) expert -- but it's a problem I've run up against in my limited map work and I want to help others fix them. I'm glad to help, Madman (talk) 01:04, 1 May 2008 (UTC)
- I believe the black boxes are caused by SVG <marker> tags, as well as flowed text. MediaWiki currently cannot render either; see Commons:Transition to SVG#Limitations. The easiest solution is to convert the markers to paths, and the flowed text to regular text (with Text->Convert to Text) or paths. Unfortunately, both make the file harder to edit. Superm401 - Talk 00:38, 2 May 2008 (UTC)
- In response to your posting at Commons, KVJ, I don't know what you did to create those black boxes. They are caused by invisible or hidden objects within the file. I really don't know how much more than that about them -- I'm by no means an SVG (Inkscape) expert -- but it's a problem I've run up against in my limited map work and I want to help others fix them. I'm glad to help, Madman (talk) 01:04, 1 May 2008 (UTC)
Linear Route maps
Inspired by the excellent article Johnson Creek (Willamette River) (soon to be a featured article), I've devised a method for using Template:Wide image to make photo maps of urban creeks. See my "methods" document and two sample maps at User:Northwesterner1/photomaps. Feedback welcome! Northwesterner1 (talk) 07:29, 4 May 2008 (UTC)
Do we have inline templates that could be added to maps, noting that they don't have a source, may be ORish or non-neutral? Template:Fact lists several inline templates, but they are for texts, not maps/pictures/captions.--Piotr Konieczny aka Prokonsul Piotrus| talk 22:02, 9 May 2008 (UTC)
- I support this demand. Templates for texts are not appropriate to question maps as they only refer to the discriptions, not the maps themselves. --ThePiedCow (talk) 16:32, 2 June 2008 (UTC)
Maps in building infoboxes
I am contemplating placing maps in building & structure infoboxes. Should this be standard?--TonyTheTiger (t/c/bio/WP:CHICAGO/WP:LOTM) 14:26, 26 May 2008 (UTC)
Partition of Czechoslovakia


Hi, I was hoping for a good map of the partition of Czechoslovakia in 1938-9. Unfortunately, this image is the best wikipedia has to offer at the moment. These other images online [4] [5][6] are what I'm looking for. Preferably the last of the three.
.png)
![[4]](https://www.bbc.co.uk/scotland/education/bitesize/higher/img/history/roadwar/munich/czech_partition.gif)
![[5]](http://www.historyhome.co.uk/europe/pictures/germany2.jpg)
![[6]](http://comenius.gvm.cz/history/map2.jpg)
This image is the most accurate vector graphic we have of pre-ww2 Czechoslovakia.
I just spent 2 hours installing and trying to figure out inkscape and I have nothing to show for it. Can anyone help? - TheMightyQuill (talk) 13:31, 3 June 2008 (UTC)
- What problems are you having? There is a learning curve associated with Inkscape, but it is surmountable. MapMaster (talk) 00:35, 4 June 2008 (UTC)
I imported the SVG blank map of modern europe, and I understand how that works, but I'm not sure where to go from there. Freehand drawing the borders with the touchpad on my laptop is not really practical. I tried importing the jpgs/gifs above and overlaying the maps, but I can't make them match up properly. - TheMightyQuill (talk) 16:30, 4 June 2008 (UTC)
- One of the first things that surprised (and frustrated) me was that if I superimposed two maps of the same place, they would just not line up. It's likely because of different projections, mapmaker quirks, and general weirdness.
- Yes, it would be hard to do fine movements using a touchpad. What you may want to do in that case is to zoom in (using the minus key), which should give you finer control. MapMaster (talk) 01:11, 6 June 2008 (UTC)
Okay, I decided to start small and just create a good svg of the first republic. How's this for starters? (Old one below) - TheMightyQuill (talk) 00:22, 9 June 2008 (UTC)

Okay, I made the partition map, and things went fairly well, except that, once uploaded, the arrow heads didn't show up and the "Rus" moved left. Any suggestions for improvement? - TheMightyQuill (talk) 16:11, 9 June 2008 (UTC)
- To get the arrow heads to show up, just place a triangle over the area instead. Those little things you can add to the ends of lines in inkscape are always buggy, I never use them. vıdıoman 21:19, 9 June 2008 (UTC)
- Done. Thanks. And it turns out using the space bar to centre text doesn't work as well as using the text format centre function. - TheMightyQuill (talk) 22:28, 9 June 2008 (UTC)
- Yes; I find that Inkscape can render text funny, even in common fonts like Arial and Tahoma. You should check the map in other browsers to make sure it's functioning correctly for everyone; use the safe mode for Firefox and Internet Explorer 7. vıdıoman 01:19, 10 June 2008 (UTC)
- Great work with the map, though I thought I should drop a line that the borders at Image:First Czechoslovak Republic.SVG are heavily erroneous. You've corrected the German-Polish border on your map but I am very confident the USSR didn't share a border with Czechoslovakia at that point, a mistake which you've kept on your map. Still a great map! +Hexagon1 (t) 04:30, 10 June 2008 (UTC)
- Yes; I find that Inkscape can render text funny, even in common fonts like Arial and Tahoma. You should check the map in other browsers to make sure it's functioning correctly for everyone; use the safe mode for Firefox and Internet Explorer 7. vıdıoman 01:19, 10 June 2008 (UTC)
Unexplained black rectangles
I tried to translate the above maps, but these weird black rectangles are showing up over the text for Subcarpathian Rus. See Image:První Československá republika.SVG and Image:Première République tchécoslovaque.SVG. I opened the SVG files, and there are no black rectangles in my original images. I can't figure out what's causing it. It looks like I'm being censored. =) Help anyone? - TheMightyQuill (talk) 20:06, 12 August 2008 (UTC)
- Just don't use "flow root". If you get this problem again you need to delete the <flowroot> element as it is not supported in the official SVG standard, thus there is no point in using anyway, as Firefox and mediawiki will not understand it. Assuming you're using Inkscape, open the file then go to Edit > XML Editor . Look for a line that says <svg:flowroot ... click the line once and press the delete node button at the top (the one with a red box). Close the XML editor window, then you may also go to File > Vacuum Defs just for good measure. Don't forget to save the file. Jackaranga (talk) 21:30, 12 August 2008 (UTC)
- You can read the bug report at https://bugs.launchpad.net/inkscape/+bug/167335 Jackaranga (talk) 21:33, 12 August 2008 (UTC)
Awesome. Thanks for your help, Jackaranga. - TheMightyQuill (talk) 23:52, 12 August 2008 (UTC)
Historical Map of Europe
I've also reinserted it into the blank map of europe. If anyone wants to combine efforts and make an blank interwar map of europe, it might be a useful project. - TheMightyQuill (talk) 00:26, 9 June 2008 (UTC)
- I did some serious searching for other free historical maps of europe but didn't find much of quality. I did however, find these beautiful historical maps of Europe - the post-script images are of excellent detailed quality. Unfortunately, they're not free, but if people decide to create historical maps of europe, they could check their work against these. - TheMightyQuill (talk) 03:18, 11 June 2008 (UTC)

Would you think that the attached map serves its purpose well? The article on the Battle of Yarmouk had the most ugliest (I have even told the author that and we laugh about it) battle maps so I decided to come up with a map detailing a 3-dimensional terrain. I haven't seen any such map on Wikipedia that details a battle formation in 3-dimensions.
Why I submit the map here is to gather feedback on maps of this sort in particular and if there is anything this map is lacking. I have put days and nights into making an SVG version of a live terrain just so that I can modify it whenever I need to. And please do take a look at the article to tell me if the maps do justice. Thanks and God bless. Arun Reginald (talk · contribs) 02:36, 3 June 2008 (UTC)
- First, let me say that you have a real flair for design. Here is my critique of this specific map, which is colored by my desire to provide clean and clear information to our readers:
- While these sort of 3D perspective maps are interesting, I don't believe that they are worth the investment. Three-dimension maps like this might be pretty, but are not nearly as precise or as easy to understand as those that use simple elevation lines on a flat map. See Battle of Gettysburg maps (which show elevation in this way) or my Image:Battle of the Gebora.svg.
- Similarly, the icons representing the troops also seem to be 3D. I am not sure what benefit this has but it does make it more difficult to determine which is cavalry and which infantry.
- The cleanest and clearest battle maps, for example those from West Point, are flat 2D maps.
- The battle itself occupies only perhaps 25% - 30% of the area of this graphic. Why is there, for example, all that empty map space off to the left??
- I am unsure why there should be a narrative built into the map itself. If the map is designed for Wikipedia, the narrative is redundant and could be confusing or misleading when used with the article itself, but the narrative is not sufficient in itself for anyone to understand the battle. Moreover, it would be more difficult to edit the narrative in the map than in the article. I note also that Wikipedia:MOS#Images_as_text discourages text within images.
- The movement lines are, in some situations, puzzling: I would suggest arrowheads be used on them. And what do the dashed lines represent?
- What do the different colors (dark green, light green, brown, tan) represent? It seems that dark brown is the lowest terrain and that the tan is non-horizontal terrain.
- The map needs references.
TfD nomination of Template:PD-PCL
Template:PD-PCL has been nominated for deletion. You are invited to comment on the discussion at the template's entry on the Templates for Deletion page. Thank you. /Lokal_Profil 10:05, 3 June 2008 (UTC)
Blank map of Europe in 1920
I just finished this. Any comments or suggestions would be appreciated. TheMightyQuill (talk) 02:35, 16 June 2008 (UTC)
- The Europe portion looks good, though I'd include the island of Rhodes so someone could potentially show the Italian control. In the mid-east a bunch of the boundaries were different, there shouldn't be Israel-Jordan or Lebanon-Syria borders and the Syria-Turkey border was different. In Asia there shouldn't be a Kazakhstan border, that was all Russia. The modern Caucasus states didn't exist then being split between Turkey and Russia. There was an independent Ukraine, Armenia and Georgia, but I think they mostly existed on paper by that point. Russia and Turkey borders are going to problematic as they were both in the middle of civil wars then - I'd be tempted to go with the post war borders even if that's technically 1921. In Africa Spanish Morocco was larger.Kmusser (talk) 14:58, 16 June 2008 (UTC)
Excellent, thank you for the advice. The Kazakhsan border, and those of the middle-east mandates were easy. I'm not sure what to do about the Caucasus. Image:DRGMap.png is pretty confused, and it would be difficult to be neutral. Is this the border I want for Spanish Morocco? Thanks again. - TheMightyQuill (talk) 15:25, 16 June 2008 (UTC)
- Yes on Morocco. The Caucasus is a mess. It looks like Azerbaijan and Armenia were both taken by Russia by the end of 1920. I think you could show Georgia using the borders as shown in Image:TranscaucasusCampaign1921.jpg (which also could be used for the Turkish boundary through what is now Armenia). Kmusser (talk) 16:35, 16 June 2008 (UTC)
- There's at least an other error : the border between France and Germany shows Alsace and Lorraine as belonging to Germany, as it was between 1871 and WWI. At the end of WWI France had already taken back these two regions which belonged to her before the disastrous 1870-1871 war. Sting-fr (talk) 13:07, 23 June 2008 (UTC)
Hah... You're right. I'm not sure why I move Alsace Lorraine. The borders in 1920 were the same as they are now, correct? Yeesh, that took me a while. What a waste of time. - TheMightyQuill (talk) 15:48, 23 June 2008 (UTC)
Fixed, and I finally fixed Morocco too. I just have to worry about the caucasus now... ugh. - TheMightyQuill (talk) 16:12, 23 June 2008 (UTC)
PDF map conversion to SVG
Please see this discussion:
- Wikipedia:Graphic Lab/Images to improve/Archive/Jul 2008#Image:APISmap1.pdf --Timeshifter (talk) 10:45, 21 June 2008 (UTC)
- It takes only a few seconds to convert a PDF to an SVG, using nothing but free software. Go Open Source! This tutorial assumes familiarity with installing programs and downloading, saving, opening and uploading files. --Dhatfield (talk) 14:44, 22 June 2008 (UTC)
How to convert a PDF to SVG
- Download Inkscape 0.46 from www.inkscape.org
- Download the PDF you want to convert
- Run Inkscape
- Open the PDF file you want convert in Inkscape (not Acrobat)
- Click OK on the box that comes up
- Wait a little while as Inkscape converts it
- Click File>Save As..
- Click Save in the bottom right corner
- Done! You now have an SVG file with the same name as the PDF, but with the .svg extension
- Upload the SVG and check that it displays properly
If you can't see the SVG on Wikipedia/Commons
This should work for most PDF to SVG conversions, but if it doesn't there are some things you can do:
- Check that you have the 0.46 or later version of Inkscape. Earlier versions do not have PDF support.
- There may be compatability problems between the Wikipedia / Media rendering engine and Inkscape:
- (This is a shameless ripoff of User:Phidauex/SVG tips)
- Select everything (Ctrl-A) and choose the Path>Object to Path command.
- Select everything (Ctrl-A) and choose the Path>Stroke to Path command.
- In the File>Save As.. dialog look for the drop-down menu just above the Save button and save as a Plain SVG.
- If that doesn't work, call your local friendly WikiGraphist.
I you want to take a look at your SVG in Inkscape hold Ctrl and scroll you mouse wheel forward and back to zoom in and out. Use the scroll-bars on the right and bottom to scroll.
Warning
Some PDFs create very "bad" SVG files when converted automatically. A "bad" SVG can be identified because it will convert slowly (more than 5 seconds), it will be very large for an SVG (over 1MB) and it will render very slowly on WP - there is a long wait while the text and other images on the page are loaded, but the SVG image does not show up. Bad SVGs put a lot of strain on the Wiki servers. If you suspect you have a "bad" file, go to a Wikigraphist for a manual conversion. These will almost always be much better than the automated versions in terms of being smaller, better drawn and easier to translate because the text is created properly.
For interest
Inkscape is FOSS software. Feel good about saving the planet from commercialism while converting! For additional comments see this discussion:
If you have comments about this tutorial or it doesn't work for you, please talk to me. Dhatfield (talk) 14:44, 22 June 2008 (UTC)
- It might be worth mentioning that this won't magically convert any raster graphics included in the document into vector graphics. This is excellent if the PDF has vector graphics, but not so useful if it has a photograph inside. - TheMightyQuill (talk) 15:25, 22 June 2008 (UTC)
Can you clarify what a "PDF map" is, for this purpose?
I feel ignorant - but a quick wiki-search and Google-search did not enlighten me. I know how to put any graphic file into a pdf - but my strong hunch is that it takes more than this to make it a "pdf map"! - Martha (talk) 19:04, 22 June 2008 (UTC)
- Good Q. An example of a (vector) PDF map ready for conversion to SVG is this. PDFs can contain practically any type of information, the most common ones being text, raster images (ordinary images like bitmaps) and vector graphics. The vector information has to be coded into the PDF as such. Quite a lot of organisations publish vector information (like maps) this way, so it's handy to be able to convert out of PDF, but putting things into PDFs is pointless for us, it doesn't change the type. If you need a raster image converted, best to speak to a WikiGraphist - MissMJ is the resident pro and very approachable. Dhatfield (talk) 00:52, 23 June 2008 (UTC)
Subpage started
Please see:
Feel free to edit it. I already started. --Timeshifter (talk) 12:46, 23 June 2008 (UTC)
Request! Please date all maps....
In looking at the source map for TheMightyQuill's map of Europe in 1920, I discovered that the source map (which shows borders, just as the 1920 one does - but of course they're different borders) has NO date! That makes it hard to use, because you don't know when the borders refer to. Shouldn't there be a policy that ALL maps put onto Commons - or Wikipedia - should be dated?? The date could be part of the title for the file, or part of the Information box, or any number of things - my point here is to raise the issue of the importance of dating things! Spoken by one who was trained by trying to date office notes by the handwriting..... - Martha (talk) 18:52, 22 June 2008 (UTC)
- The source map is dated (Sept. 13, 2007) - the majority of maps in commons are intended to be "current" maps in which case I think it is safe to assume that the date the map is supposed to represent is the same as the date it is created. I think you only need an explicit date when that is not the case. TheMightyQuill took a modern map and adjusted the borders to their historic positions. Kmusser (talk) 23:53, 22 June 2008 (UTC)
I'm sorry to say I don't agree with your logic. I think we have a very imprecise system here. In the case of those two maps, the "image information" box contains a date, which in each case pretty much agrees with the date when the map was uploaded (not the date to which the map itself refers). What date is supposed to be entered there? Creation date? Time frame represented? Upload date?? Template:Information specifies "date of creation, or date of publication" - but a) that leaves a choice (and no way to identify which of the two you've chosen), and b) do users of that Template really think about what they put there, and its implications?? Shouldn't the template be updated so that it specifies what date that is? The only thing that identifies the 1920 map is its title, which disagrees with the "date" in the info box; and the source map is identified only by its upload date. Nothing identifies when that source map was actually CREATED - it could have been created quite awhile before it was uploaded. - Furthermore it is already out of date: it does not show the borders of Kosova! So at this point in history, I would be happier if it were clearly identified as "map as of [date]".
Dealing with the source map is not so hard in June of 2008 - but in 10, 20, 50 years....how might things change, and how would we know exactly what we're looking at? We're hoping for Wikipedia to be accurate in the long term, aren't we? If so, we need to start right now taking responsibility for making things we put into Wikipedia be precisely identified. - Martha (talk) 22:46, 26 June 2008 (UTC)
- Maybe you could make a template like {{Accurate-map|from=[[date]]|to=[[date]]|details=}} that can be placed on maps? It might also make sense to have a template {{Inaccurate-map|Reasons}} to place on maps with problems - TheMightyQuill (talk) 23:46, 26 June 2008 (UTC)
Proposition for common map conventions announcement
Hello.
I'm from the French-speaking Graphic lab and we had a discussion there about the creation of a colorimetric convention for geopolitical and topographic maps for a common use in the Wikimedia project.
Now we make this proposition on Commons talk:Project Mapmaking Wiki Standards.
I invite all Wiki map makers here to take a look at that page and participate so we can harmonize the aspect of our maps, have common conventions and ease their creation.
Note also that I initiated on the same page a discussion about the choice for a recommended projection to be used for world maps.
Thanks for your participation. Sting-fr (talk) 22:01, 23 June 2008 (UTC)
Question
I reckon this is the best place to ask this. For a map for an article, are we allowed to use a map from Google Maps, or would that go against either copyright, or policy, or do we have to use self-created maps? Deamon138 (talk) 23:33, 11 July 2008 (UTC)
- Using a google maps image definitely violates copyrights and is not allowed. --MattWright (talk) 00:27, 12 July 2008 (UTC)
Getting started

I'm getting started making maps, using Inkscape for now. So far, I'm making low-detail "locator"-style maps. I'd really appreciate comments on how to improve. Here's an example map for comment. In particular, I'm wondering about how best to handle labels, the level of detail in coastlines, and line thicknesses. Thanks! --Amble (talk) 06:30, 16 July 2008 (UTC)
- Personally (I'm no expert), I think it would look better with a standard line thickness - that of the mainland - rather than the wider borders on the coloured areas. You might use a standard colour (black?) for the island borders as well, but maybe choose a different colour than black to border Incheon? If Ganghwa County and Daecheong Myeon are not related in some way, you might choose colours that are less similar.- TheMightyQuill (talk) 15:15, 16 July 2008 (UTC)
- I think it looks pretty good overall, the mainland coast line looks like it got a little warped in the SVG conversion, it that may not be important at that scale, but if available I'd make the coast a little more detailed. I like the colored borders for the islands, it helps them to stand out, but I think they can be the same thickness as the mainland. I also think that the Ganghwa and Daecheong colors are a little too close. I think how you have the labels is just fine. Kmusser (talk) 16:05, 16 July 2008 (UTC)
- My comments:
- I think the previous editors' comments are spot on. In particular, I agree with Mr M that main coastline is not detailed enough, giving it a fake or amateurish look (yes, except for Mr M, we are amateurs, but still . . . ).
- Maps like this generally use a san serif font, like Arial. The present font is better for large blocks of text, not labels.
- I would urge you to use standard colors for the mainland and the ocean. These colors may not be the absolute best, but they are semi-standard. These colors can be found on this Talk Page, or alternatively at Commons:Commons talk:Project Mapmaking Wiki Standards.
- Looking at this map, it seems that Seoul is smaller than Incheon. Is Incheon here a "county" or city??
- A scale would help.
- Hope this helps, Madman (talk) 19:27, 16 July 2008 (UTC)
- My comments:
Thanks to all for the very helpful comments! --Amble (talk) 17:34, 19 July 2008 (UTC)

Update: here's the improved version! I didn't use the recommended colors for the DMZ, because they were too colorful relative to the main contents of the map. I didn't find a standard color for the mainland... there's "territory of interest," but I took that to be mainland Incheon in this case.Seoul and Incheon are both special cities, i.e. province-level entities. Honestly, the main difficulty in showing the detailed borders of Seoul is finding a good free source. In the first version of the map, I used existing Wikipedia maps, but those are of unknown origin and are quite rough. In the new version, I had to really work. I looked at an Incheon city government map, identified the landmarks near the administrative boundaries, and found the same landmarks on the Landsat images - no tracing. Maybe that's too paranoid (and maybe just paranoid enough).--Amble (talk) 02:59, 31 July 2008 (UTC)
Japan location articles-maps
Right now on the Japanese location articles, the maps just show the location of the city or village or ward in relation to the prefecture. It would be more useful to include a small map of Japan with the area highlighted, just as the map of Mawlamyine includes a location of the state within Burma. Please can we modify the infobox to include this somehow? Chris (クリス • フィッチ) (talk) 15:34, 16 July 2008 (UTC)
- An example of what he means can be seen at Kyoto I think. But if you wanted a pushpin map you could use {{Infobox Settlement}} instead of {{Infobox City Japan}}. This will then use {{Location map Japan}} for the map. That map is pretty bad though for a locator map, I can help create a better one if you like. Or we could add a pushpin map to {{Infobox City Japan}} instead but I don't know if people would approve of it. {{Infobox City Japan}} has some elements one would find in a directory rather than an encyclopaedia, for example the address of the government office is of very little encyclopaedic value. Jackaranga (talk) 19:54, 16 July 2008 (UTC)
- Yes, please create a better map if you would, thank you! Chris (クリス • フィッチ) (talk) 08:22, 17 July 2008 (UTC)
New inaccuracy templates on commons
I've created two new templates on commons: commons:Template:Inaccurate-map-disputed and commons:Template:Inaccurate-map-disputed, the former for authors to acknowledge their own inaccuracies, the latter for others to dispute the accuracy of maps. Comments? - TheMightyQuill (talk) 16:44, 16 July 2008 (UTC)
A replacement map is needed
Western Climate Initiative uses Image:Map of North America, WRCAI members.svg to illustrate its members and (via {{legend}}s) the type of members. The current version is out of date (e.g. Ontario switched from being an observer to a partner). Could someone update it (and remove the "out of date" description I added to the article). Thanks. 67.101.6.100 (talk) 19:55, 18 July 2008 (UTC).
P.S. Here's what the new version of the map should look like:
67.101.6.100 (talk) 20:05, 18 July 2008 (UTC)
Generating map from coordinates
Hello, I would like to create a map of the settlements in regions of Northern Greece and Southern Bulgaria. A region known as Chech. You see there is a map of that region, but it is not based on GPS data, rather on old inaqurate maps. Now I have the coordinates of all settlements from that area in Greece here and the coordinates of the settlements in Bulgaria are in Bulgarian Wikipedia. Question: How do I make a map, given that I know the coordinates of all settlements? Is there some program or script where you can feed the coordinates and get the map in return? That's priority number one. Priority number two is the border between Bulgaria and Greece to be present on the map. Priority number three is topographic features like rivers, dams and peaks. And last, the border of the Chech Region, which can be taken from the old map. I will appreciate any help and advices. --Chech Explorer (talk) 11:58, 18 August 2008 (UTC)
- Using Inkscape and GMT you should be able to get all this done. Jackaranga (talk) 09:43, 20 August 2008 (UTC)
- Thanks, what does GMT stand for? --Chech Explorer (talk) 15:34, 20 August 2008 (UTC)
- Generic Mapping Tools Jackaranga (talk) 15:55, 20 August 2008 (UTC)
- To plot the points use psxy, to plot the text use pstext using the -Dj switch to make sure the name doesn't overlap the point, use pscoast for the borders, rivers etc., use grdimage to draw the elevation data. If the inbuilt elevation data is not precise enough use the data available at http://www.ngdc.noaa.gov/mgg/topo/gltiles.html, and if you want even more precise data use SRTM data from http://srtm.csi.cgiar.org/SELECTION/inputCoord.asp (a faster mirror at http://srtm.jrc.ec.europa.eu/) and then convert to netCDF using grdraster. You should open the final file in gsview and convert to PDF, then you can open it in Inkscape and save as SVG. I hope this helps. Jackaranga (talk) 17:41, 20 August 2008 (UTC)
- Generic Mapping Tools Jackaranga (talk) 15:55, 20 August 2008 (UTC)
- Thanks, what does GMT stand for? --Chech Explorer (talk) 15:34, 20 August 2008 (UTC)
Integration of Wikimapia?
I doubt it's gonna happen any time soon, and have no idea what kind of code realities are required to make it happen (or what mountains of inertia within the Wikimedia Foundation), but will it ever be possible to have a Wikimapia window on Wikipedia articles where a given location can be shown automatically as a sattelite image, based on its latlong and a specified radius? The wikimapia basemap is the same as that for googlemaps so maybe there's copyright issues - ? - but the sat maps are great especially forgeographic articles; but instead of having to "make" them separately I'm wondering if there might be a way to make them generatable directly form a Wiki page? Maybe even with a scale-slider and pan-ability? Nice idea, is it possible at all?Skookum1 (talk) 16:03, 20 August 2008 (UTC)
- Wikimapia isn't a Wikimedia project so while cool, integration doesn't seem likely. For articles that have a lat/long coordinates link, there is an indirect link to Wikimapia via the GeoHack tool which may be as good as we're going to get. Kmusser (talk) 16:25, 20 August 2008 (UTC)
- Too bad. Nice idea though, huh?Skookum1 (talk) 16:32, 20 August 2008 (UTC)
- BTW bivouac.com's site-owner developed hacks for BC Basemap, Topozone nad other sites which link directly from a bivouac page to the location in question. Not a copyvio, however he did it, but the parse-code he used to do it I never learned in all my time there. I realize geohack provides much the same (sans BC Basemap being among the options); I guess a geonames.org maplink works pretty much the same (and byapsses geohack) but I've only seen a few here and there on various pages. The idea was a display window of the target URL, but that's not possible with images I know (otherwise lots of sites could be "jacked" like that, like how on my own site http://www.cayoosh.net the click-throughs on thumbnails of BC ARchives images go right to their own site's page, not a copy hosted on mine). Anyway, too bad, just daunted by the number of sat-image maps for BC geographic objects that could use creation....just trying to byapsss a lot of work. BTw Karl I want to make a terrain-locator map to replace many usages of RD-locator maps on inappropriate articles for RD maps; I understand the latter are somehow generated using the latlong on the RD basemap. Would this also be possible on terrain-bassed maps? A sample of the kind of map I'm thinking of is on Lillooet Ranges, I think, or Clear Range and others, though those aren't BC-wide. I gather the latlong parameters of teh originating basemap would be needed, then somehow the latlong-point is overlain, yes?Skookum1 (talk) 16:37, 20 August 2008 (UTC)
Blank maps
Can i know why most of the blank maps is deprecated? Should i use that deprecated blank maps to draw the maps anymore? --Aleenf1 06:40, 26 September 2008 (UTC)
- They've likely been deprecated because they're PNGs, and PNGs are, in most mapping cases, deprecated in favor of SVGs. Please, by all means, use the existing maps, but know that eventually you will want to convert your works to SVG as well. (I've made a bunch of the blank maps but I still haven't managed to learn SVG yet) --Golbez (talk) 07:48, 26 September 2008 (UTC)
What's missing: guideline and tutorial
Although maps are an important issue in Wikipedia being located in most articles, I remarked the absence of a guideline regulating or organizing it. One issue I think should be included is the independence of a map from an article; I noticed that most maps don't have any legend in the image itself, which makes it incomprehensible without the article. Since WP material (including maps) is meant to be reused by anyone, shouldn't the legend be (mandatory) included with the map? Another thing is the total absence of a tutorial explaining step-by-step how to create a map and color it. Also, I think that the project needs a little bit of organization, I'll hopefully try to work on it. Thank you. Eklipse (talk) 18:41, 26 September 2008 (UTC)
- I agree that a tutorial would be useful. The lack of legends in the map themselves is often intentional though, it makes it easier to use the map across multiple languages and the legend is often easier to read if it's in the caption rather than in the image. Kmusser (talk) 20:07, 26 September 2008 (UTC)
- Tutorials are being created or translated. More help is needed. Please see User:JaneVannin/translations, Category:Wikipedia maps (a work category), and Wikipedia:Graphic Lab/Resources/Maps (its linked subpages, too). There are some legend templates. They could use some work, too. Please see:
- commons:Category:Map-related templates
- Category:Mapping templates
- Category:Graphic templates - some map templates, too.
- Category:Wikipedia template categories - Some map-related templates there, too.
- Legends can be within the map itself and/or in the map caption under the map within the article. There are many examples of both of these methods in Wikipedia. More detailed legends are sometimes found on the image description page for the map. Anybody can add a legend later to a map caption or image description page. A map with a caption legend is at List of U.S. minimum wages. --Timeshifter (talk) 21:56, 26 September 2008 (UTC)
- Ok, I see your point in excluding legends from maps, however, I have seen many odd maps which uses strange and unmatched colors, and portrays information in a confusing way. I've seen books about some theory and good practice in making maps; and I think it should be mentioned in a comprehensive style guideline about maps. Anyways, it won't happen unless a number of experienced editors want to address this issue, and I'm certainly not qualified to have an opinion about it. Eklipse (talk) 20:51, 27 September 2008 (UTC)
Linking articles to Google Maps
How do I link an article that I have created onto Google Maps?I am trying to get a placeholder on my article Churchtown Farm to appear on Google Maps. A geographically adjacent article, Saltash.net_community_school does appear on Google Maps. Both articles have co-ordinates, but I can't see what it is that my article needs that the Saltash.net one already has.Can anyone help?Thanks.Tinminer (talk) 19:06, 30 September 2008 (UTC)
- That's a Google Maps question rather than a Wikipedia question, I took a quick look at the Google Maps help and didn't see an obvious answer though. I suspect Google Maps syncs with the Wikipedia database on a periodic basis and all you'll have to do is wait for it to update. Kmusser (talk) 19:24, 30 September 2008 (UTC)
Yes, I looked on Google Maps first, but could find no help to this, so thought I'd try on here!Tinminer (talk) 19:40, 30 September 2008 (UTC)
I've now found this (Placeopedia) which seems to do the trick. Runs on open-source software (non-commercial website).Tinminer (talk) 19:58, 30 September 2008 (UTC)
Location maps: Mercator projection v. Robinson projection
There's an ongoing discussion over at the European Union talk page#Mercator projection over whether a Mercator, a Robinson projection or a picture of a globe should be used as a location map. I was wondering if there is are any policy preference on what map to use? Is it simply something decided on a case-by-case basis or ought there be a consistent policy across all country/international organisation articles? Blue-Haired Lawyer 18:53, 19 October 2008 (UTC)
- I think it is something to be decided on a case-by-case basis, although recommendations would be useful. MapMaster (talk) 22:53, 19 October 2008 (UTC)
- I thought there was a general unwritten rule that we don't use Mercator? I think Robinson would be better. I don't like the 'picture of the globe' maps, I think they look tacky. vıdıoman 04:19, 20 October 2008 (UTC)
- Maybe Robinson centered on the longitude of the location in question? --seav (talk) 04:51, 20 October 2008 (UTC)
- What about the Winkel tripel projection? Sting-fr (talk) 20:39, 22 October 2008 (UTC)
- Maybe Robinson centered on the longitude of the location in question? --seav (talk) 04:51, 20 October 2008 (UTC)
- I thought there was a general unwritten rule that we don't use Mercator? I think Robinson would be better. I don't like the 'picture of the globe' maps, I think they look tacky. vıdıoman 04:19, 20 October 2008 (UTC)
Help requested
Hello! I am working on a map of Constantinople during the Byzantine period. There are apparently some problems with how the text is presented by various browsers, and I don't have enough knowledge of the intricacies of svg-making to correct this. So it was suggested that I should appeal to this project for help. If anyone can help, it would be greatly appreciated. Oh, and if anyone has any suggestions on improving the map further, please say so. Thank you in advance, Constantine ✍ 17:51, 24 October 2008 (UTC)
- In order to force the Wikipedia (or any) SVG rendering software to display a font the way you want it displayed, you have to change the text from an "object" to a "path". In that way, the text actually becomes just another drawing and loses its textual qualities.
- To do this, simply select the text, and then use the Path pulldown menu to choose Object to Path.
- Of course, losing the textual qualities means that you will have to recreate the text to make a change to it (for example, if there were a typo).
- This method can also be used to display unsupported-by-the-rendering-software fonts in a drawing. Does this help? MapMaster (talk) 14:40, 25 October 2008 (UTC)
- Yep, definite improvement. Only, in some cases, the letters appear thinner than others, although they're the same font & size. I suppose it's just how my browser renders it, or not? Thank you for the advice and the instructions, anyhow. As a more expert map-maker, if you have any further suggestions or comments on it, please let me know. Best regards, Constantine ✍ 17:53, 25 October 2008 (UTC)
- No, Constantine, I think it's an excellent map. One that deserves to be a Featured Picture. The reason that there is still some variation is just the way that the letters appear on the screen. There are only so many pixels available. Keep up the good work. MapMaster (talk) 05:37, 26 October 2008 (UTC)
- This is a way to do, but as it has been said, you cannot edit the text afterwards without deleting the paths and recreating the text again, so imagine making this for the whole text for a translation (which is one of the most important interest of this format for the inter-Wikis exchange), specially for your map which has a lot of labels! What I prefer to do is creating and uploading a raster version of the image which will be used in the articles' pages, the optional svg file being on Commons only for modifications/translations purposes. I think this is much more practical for later modifications and you're sure everyone will see the image the way it should be. This is particularly valuable like in your case or with large files in size and weight as the navigation in a svg file is slow, at least under Firefox. Sting-fr (talk) 00:53, 26 October 2008 (UTC)
- I thought about uploading a png version (which would have no rendering problems, too) and keeping the svg for reference, as you suggest. But it occurs to me that there is a simple way for anyone who wants to make a translation: just download and use the version prior to the current one. :) Although it misses some details (e.g. the land walls' posterns) the text is the same. Either way, I'm planning on making the Greek and German versions of the map myself. Constantine ✍ 10:12, 26 October 2008 (UTC)
- This is a way to do, but as it has been said, you cannot edit the text afterwards without deleting the paths and recreating the text again, so imagine making this for the whole text for a translation (which is one of the most important interest of this format for the inter-Wikis exchange), specially for your map which has a lot of labels! What I prefer to do is creating and uploading a raster version of the image which will be used in the articles' pages, the optional svg file being on Commons only for modifications/translations purposes. I think this is much more practical for later modifications and you're sure everyone will see the image the way it should be. This is particularly valuable like in your case or with large files in size and weight as the navigation in a svg file is slow, at least under Firefox. Sting-fr (talk) 00:53, 26 October 2008 (UTC)
Battle of Opis map

Would this resolve the problems of the map I've just added to Battle of Opis#Background? The text renders very poorly; I couldn't work out why. -- ChrisO (talk) 01:34, 26 October 2008 (UTC)
- I think that this map's text renders so poorly because it's so small -- there are only so many pixels on the screen. I also believe that the cause of a lot of the problem is the yellow letters on the purple background.
- To improve this map, I would suggest the following:
- Use the semi-standard colors on the project page. In particular, the dark purple is not good and the seas are much too dark. Lighten up the colors.
- Use only black text. Yellow and red text is hard to read.
- Use both upper and lower case letters. LABELS WHICH ARE ALL UPPER CASE ARE MORE DIFFICULT TO READ.
- Try to reduce the wasted space around the edges of the map. Include only the western half of the Persian Empire. Don't include Thrace and Scythia. Etc.
- Decrease the number of labels, and increase the size of those remaining. Only keep the cities mentioned in the article, and make them prominent.
- Does this help? MapMaster (talk) 05:34, 26 October 2008 (UTC)
- Yes, I think it does. I'll have a go at making the changes you suggest. Thanks very much for all the advice. -- ChrisO (talk) 23:57, 30 October 2008 (UTC)
Standard colors and range maps

I've been looking at the standard conventions on the main page for color usage, but would appreciate some advice for colors on range maps for flora and fauna pages. Since I've just learned to use Inkscape to create SVGs, I have gone on to create my first SVG range map, which is shown to the right. In this example, I used red (#FF0000) to highlight the animals' geographic range. Instead, should I have used the red from the standard conventions (#B00000)? If not, which color would you suggest? And what about range maps that highlight ranges for more than one species, such as my old ruffed lemur map (which I will replace, pending the color recommendations here), Image:Madagascar_Varecia_range.png? Should I use the standard convention colors pink (#FFD0D0), orange (#F8A20C), green (#3CE67B), light blue (#CEFEF2), or red-orange (#F07568)? Sadly, as far as I can tell, this topic has not been discussed on WikiProject:Tree of Life or any of its subprojects. The only mentions I can find of range maps include:
Obviously, this discussion should include members of these projects as well.
In regards to color selection, I have another question that I could not quickly find an answer to reading the posts above: Have your standard convention colors been tested for clarity when color blindness is factored in? If you haven't done so already, you can test an image on sites like Vischeck.
I am currently revving up create range maps for all lemurs, but this color issue needs to be resolved first. I have already created a range map template for Madagascar, which can not only be used for lemurs, but other endemic Malagasy biota. I'd like to get started, so I'm hoping this won't be too complicated of an issue. –Visionholder (talk) 08:13, 31 October 2008 (UTC)
- Hi, congratulations to the map. I am not aware of any convention for the colors either. Just do what looks good to you. Some time ago I made Image:Hylobates distribution map with legend.svg which has several colors in one range map. I would prefer less vivid colors now though. Before you start creating more range maps of Madagascar you might want to do the following:
- make the world map much smaller since the main item should be the map of Madagascar
- Should the range go all the way to the coast line? If yes, "fill bounded areas" in inkscape could be useful.
- Please correct me if I am mistaken, but there are usually no labels of geographic items (Indian Ocean, Mozambique Channel) in range maps. bamse (talk) 12:59, 31 October 2008 (UTC)
- I can try to minimize the world map more, but the smaller the world map gets, the harder Madagascar is to see in the little red box. As for ranges running to the coast, according to the source map the ranges sometimes go to the coast and sometimes don't. I just used the pencil tool to create a complex filled-in area, then dragged the nodes to line up with the coast. I'm still learning, but I'll look into your suggestion and try to figure it out.
- In regards to labeling geographic features (like large bodies of water), you make a good point. Although with the lack of range map conformity I guess anything could go. I put them in because the discussion of lemur evolution usually mentions the Mozambique Channel. I can take them out for the sake of standardization.
- But when it comes to color choices, I'd really prefer to see some defined standards for the same reasons this project opted to select some. It would also be nice if those colors were meaningful to color blind people—something that won't happen (consistently) if you leave it to the editors to randomly pick their colors. –Visionholder (talk) 17:58, 31 October 2008 (UTC)
- Some suggestions:
- Yes, the #B00000 red is less red than the one you used. In general, as noted by Bamse, more subdued colors are generally better.
- I don't have a problem with the labels on the bodies of water. Why not??
- Drop the world map in favor of a map of Africa. It's hard to conceive of a situation where a world map would be better than an African map.
- Regarding standard colors, check out the various suggestions on the Project Page. Initiatives to get more detailed have all stalled.
- Thanks, MapMaster (talk) 19:16, 31 October 2008 (UTC)
- Some suggestions:
- I made a lot of fixes to both the template and the first range map. Colors were changed to match the standard conventions, the Arican continent map was used instead of the world map, the Comoros Islands were added and a scale was added. I left the labels for the bodies of water, but they are on their own layer, so they can be hidden if not desired. The only problem I'm having is that Ring-tailed Lemur page and this page are distorting the new SVG range map, I guess by trying to force it to fit into its former dimensions. I figured this was a cache problem in IE, so I tried in Firefox (in which I had never visited these pages), and it was still distorting the maps there too. Ironically, if I edit the page, the preview fixes the problem. Canceling out of editing mode reverts back to the distortion problem. Hopefully this post will fix things on my computer. If the maps are being distorted on anyone else's computer, could someone help me fix this problem?
- But back on topic, I'll keep playing with the maps where I'll be showing ranges for multiple species. Hopefully I can come use your suggested colors or find new, subdued ones that work. –Visionholder (talk) 08:29, 1 November 2008 (UTC)
- Much better now with the Africa map. If you move "Indian Ocean" further north, you move the inset map to the left and make the whole map more compact. Since you have enough space, I would write "Indian Ocean" horizontally, if necessary in two lines since horizontal text is easier to read. As for putting the range all the way to the coast, there is an easier way: Just draw the boundaries of the range on land starting and ending at a point on the coast, i.e. don't trace the coastline when you draw the area of the range. You can use either the pencil or the bezier tool. Then use the bucket fill tool to color the range. It will fill the area between the boundaries you drew and the coastline. bamse (talk) 11:57, 1 November 2008 (UTC)
- Thanks for the tips on doing the ranges. Sometimes my source doesn't have the range follow the coast exactly, in which cases (such as the west coast of the map above), I'll probably partially trace the coast, veering in when necessary. As for making the map more compact, I intentionally left it the way it is with plans to add a legend in the top right corner. Once I figure out how I want this to look, I'll post what will hopefully be a final update. Thanks again for your time and input. –Visionholder (talk) 19:55, 6 November 2008 (UTC)
- Good idea with the legend. If the range does not go all the way to the coast, just draw the border where you need to "veer in" (and the other borders between the range and land). You don't need to trace the part where the range borders the sea. Then use the fill-bucket tool in the area bounded by 1. the coastline which is already present, 2. the veered-in borders close to the sea and 3. the borders between range and land. So you only need to draw 2. and 3. For this to work you might need to have the range borders and the coastline in the same "layer". Just try. You could always make a copy of the coastline with Ctrl-D and put it in the layer where you want to have the range. bamse (talk) 12:20, 7 November 2008 (UTC)
- Thanks for the tips on doing the ranges. Sometimes my source doesn't have the range follow the coast exactly, in which cases (such as the west coast of the map above), I'll probably partially trace the coast, veering in when necessary. As for making the map more compact, I intentionally left it the way it is with plans to add a legend in the top right corner. Once I figure out how I want this to look, I'll post what will hopefully be a final update. Thanks again for your time and input. –Visionholder (talk) 19:55, 6 November 2008 (UTC)
- Much better now with the Africa map. If you move "Indian Ocean" further north, you move the inset map to the left and make the whole map more compact. Since you have enough space, I would write "Indian Ocean" horizontally, if necessary in two lines since horizontal text is easier to read. As for putting the range all the way to the coast, there is an easier way: Just draw the boundaries of the range on land starting and ending at a point on the coast, i.e. don't trace the coastline when you draw the area of the range. You can use either the pencil or the bezier tool. Then use the bucket fill tool to color the range. It will fill the area between the boundaries you drew and the coastline. bamse (talk) 11:57, 1 November 2008 (UTC)
Are maps to be considered primary or secondary sources?
Please give your input at Wikipedia talk:No original research#Regarding maps being "primary sources" according to this policy. --Rschen7754 (T C) 11:59, 16 November 2008 (UTC)
Standard for American election results maps?
I've been making a few maps for election results in Oregon. They can be seen here. The ones I've made only involve the Democratic and Republican parties in general elections, and thus use just the simple red–blue color coding. But I've considered maps for primary election results too, as well as gradient maps to show margin of victory.
Are there guidelines already in place? Äþelwulf Talk to me. 18:41, 1 December 2008 (UTC)