Wind power in Italy, at the end of 2015, consisted of more than 1,847 wind turbines with a total installed capacity of 8,958 megawatts. Wind power contributed 5.4% of Italy electricity generation in 2015 (14,589 GWh).[1] Italy is ranked as the world's tenth producer of wind power as of the end of 2016. Prospects for Italian wind energy beyond 2020 were positive, with several projects planned to go live before 2030.[2][3]

In 2019, Italy generated 20,054 GWh of electricity from wind power, equal to 7.1% of the total electricity generation.[4]
Overview

In 2001, the European Commission issued its Directive on Electricity Production from Renewable Energy Sources. The Directive set a goal for Italy to obtain at least 25% of its electricity from renewables by 2010.[5] The 1999 Italian ‘White Book’ targeted to install 2,500 MW of wind power capacity by 2010; Italy exceeded this in 2007. The Italian government targeted 12,000 MW by 2020. Given that Italy's recent growth in wind power capacity has been about 30% annually, in 2008 the target appeared reachable by 2015.[5] Italy introduced a renewable energy quota system in 2002, and uses green certificates to ensure that power producers and importers produce specified percentages of electricity from renewables. Renewable energy under the quota system must come from new or repowered plants which began operating after April 1, 1999.[5]

The first floating wind turbines were tested in 2007-2008. Blue H Technologies of the Netherlands deployed the world's first floating wind turbine, 21.3 kilometres (13.2 mi) off the coast of Apulia in December 2007.[6] The first foundations for the 30 MW Beleolico offshore wind farm were installed near Taranto in January 2022,[7] and inaugurated in April 2022.[8]
Installed capacity growth
The table shows the annual increase in installed wind power capacity in recent years.[9]: 39
| Year | Nameplate capacity | Plants | ||
|---|---|---|---|---|
| MW | change | number | change | |
| 2000 | 363 | - | 55 | - |
| 2001 | 664 | 82.92% | 81 | 47.27% |
| 2002 | 780 | 17.47% | 99 | 22.22% |
| 2003 | 874 | 12.05% | 107 | 8.08% |
| 2004 | 1,131 | 29.41% | 120 | 12.15% |
| 2005 | 1,639 | 44.92% | 148 | 23.33% |
| 2006 | 1,908 | 16.41% | 169 | 14.19% |
| 2007 | 2,714 | 42.24% | 203 | 20.12% |
| 2008 | 3,538 | 30.36% | 242 | 19.21% |
| 2009 | 4,898 | 38.44% | 294 | 21.49% |
| 2010 | 5,814 | 18.70% | 487 | 65.65% |
| 2011[10] | 6,936 | 19.30% | 807 | 65.71% |
| 2012[11] | 8,144 | 17.42% | 1,054 | |
| 2013[12] | 8,552 | 5.01% | 1,386 | |
| 2014[13] | 8,703 | 1.77% | 1,847 | |
| 2015[13] | 9,126 | 4.86% | 2,734 | |
| 2016[14] | 9,388 | 3,598 | ||
| 2017 | 9,780 | 5,579 | ||
| 2018 | 10,310 | 5,642 | ||
| 2019 | 10,760 | 5,644 | ||
| 2020[15] | 10,907 | 5,660 | ||
| 2021 | 11,320 | 5,731 | ||
Gallery

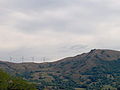 Wind farm in Varese Ligure, Province of La Spezia
 REpower MM82 Wind Turbine in Minervino Murge

.jpg)


See also

References
External links
- Associazione Nazionale Energia del Vento (ANEV), the Italian Wind Energy Association
- Il Portale italiano dell'energia del vento The Italian Web portal about wind power