
원본 파일 (2,700 × 1,669 픽셀, 파일 크기: 2.66 MB, MIME 종류: image/png)
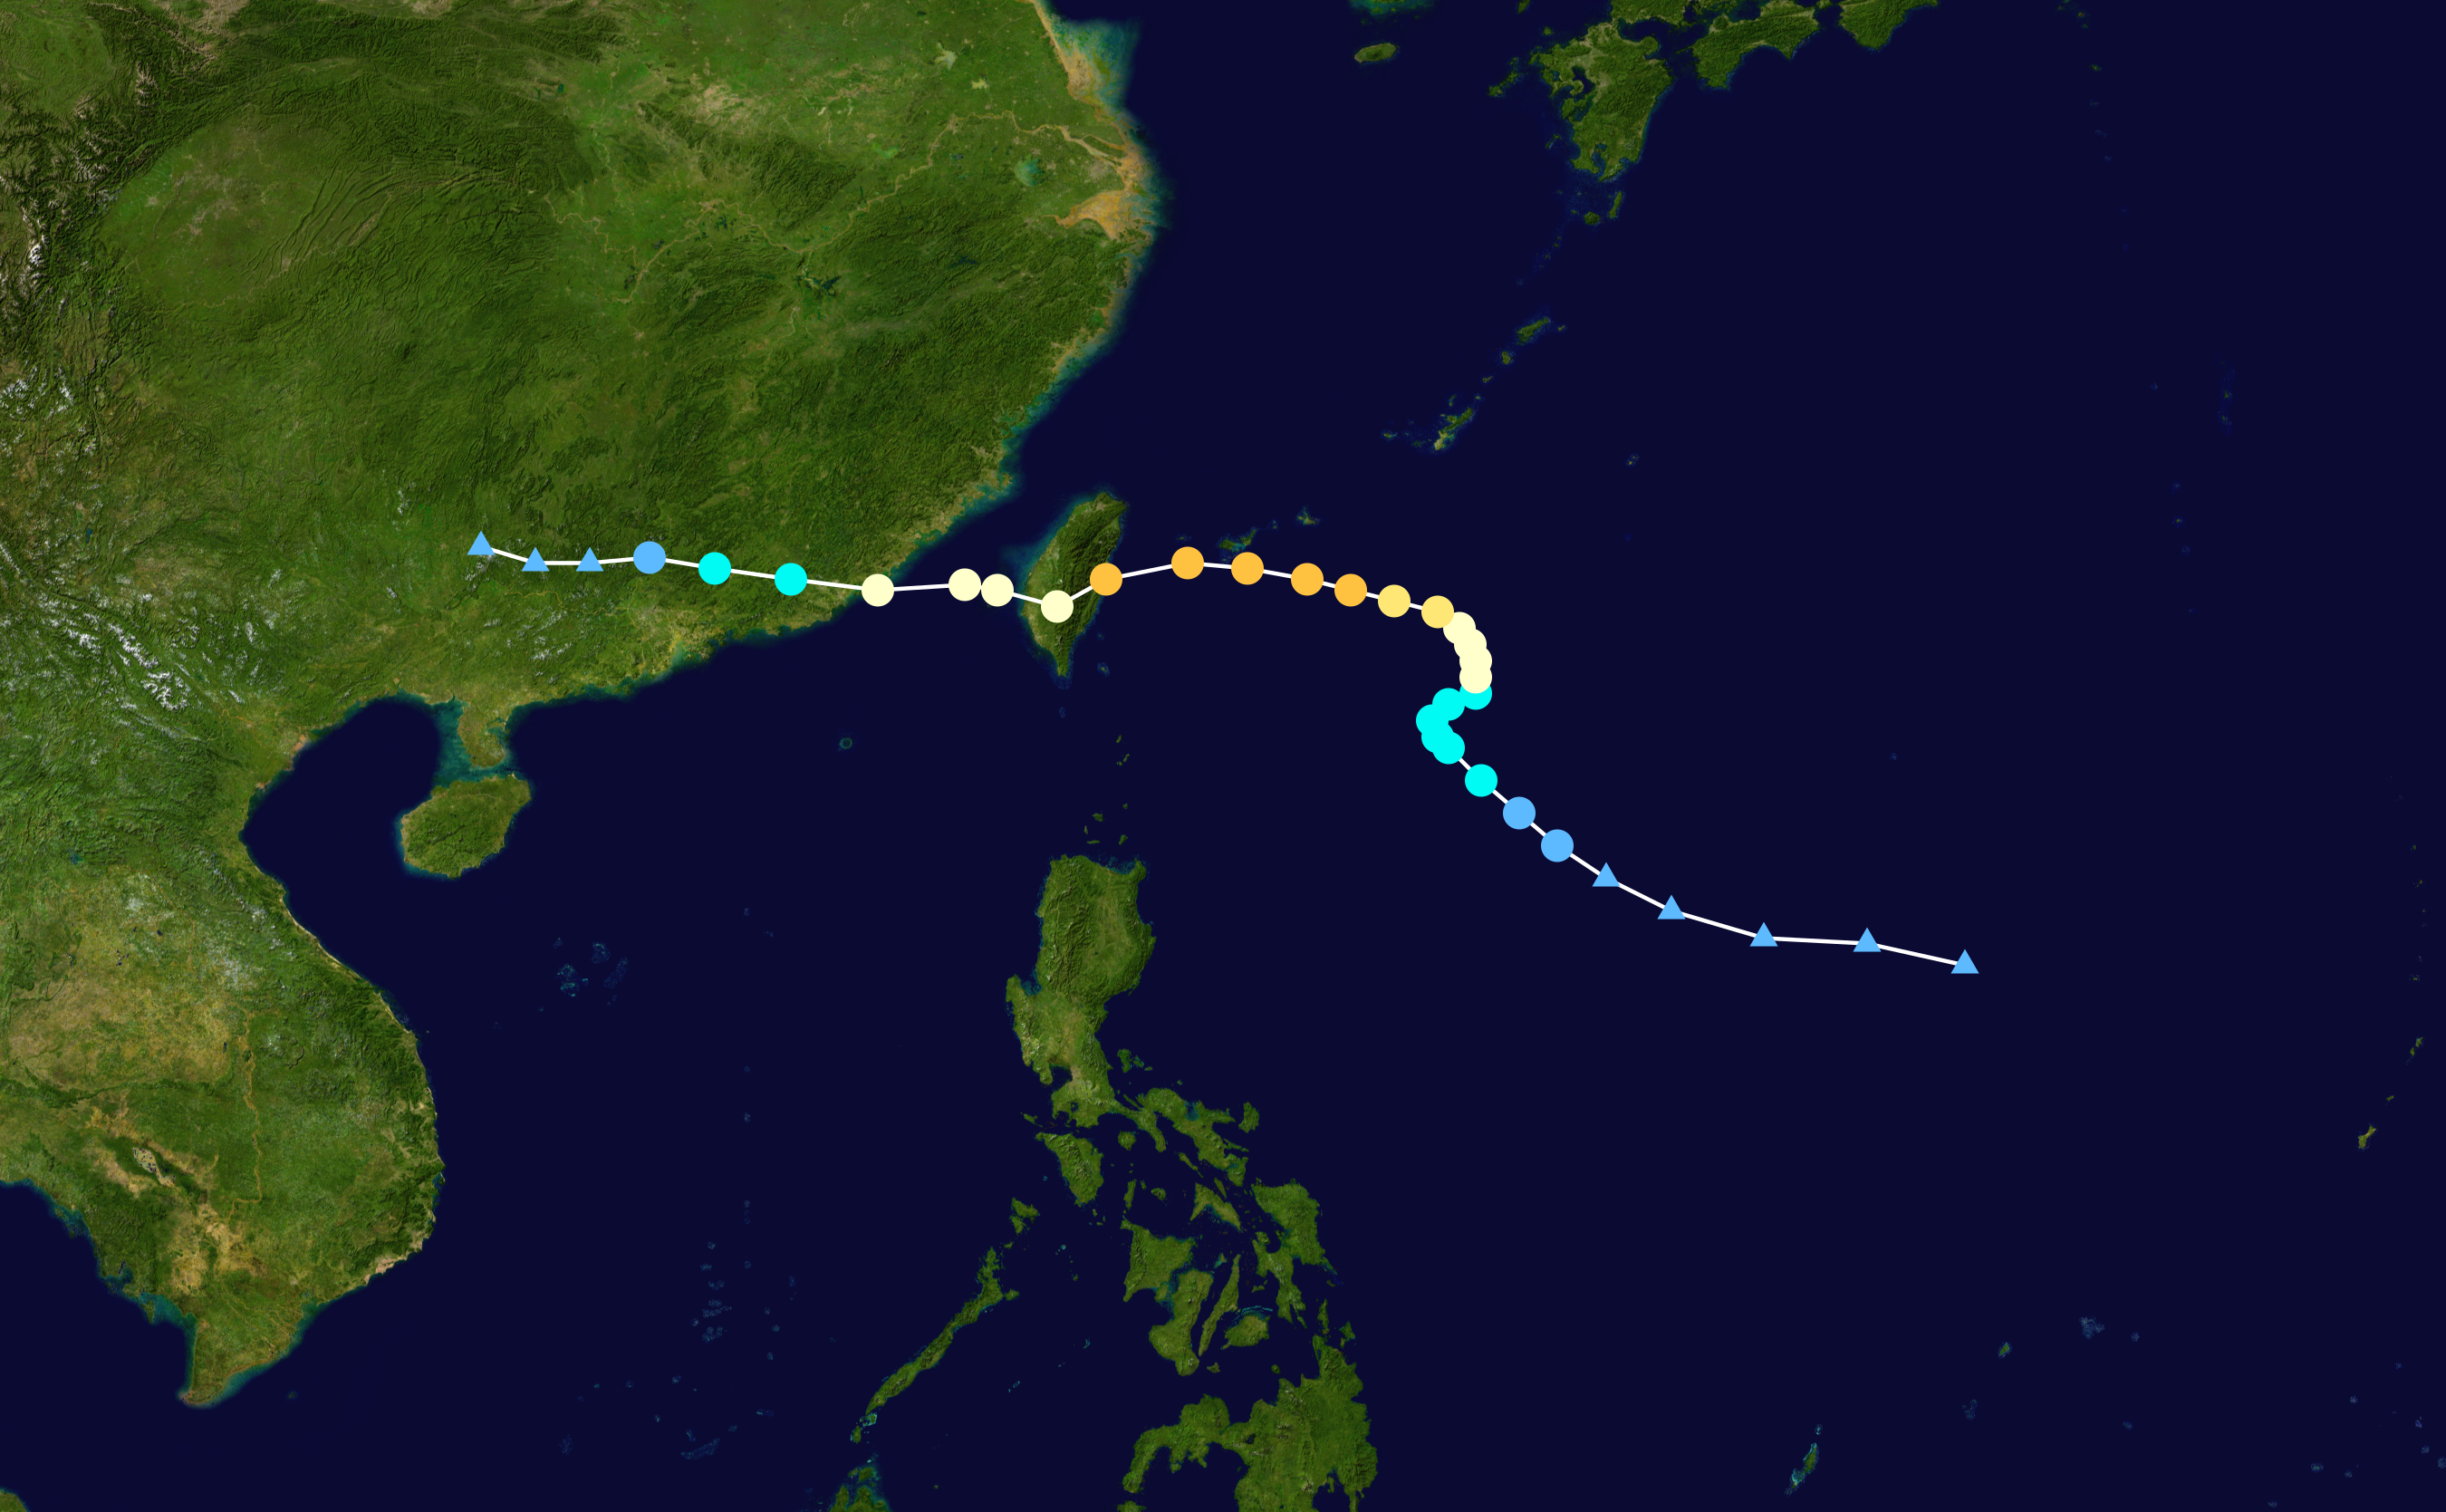
| 설명Fanapi 2010 track.png | English: Track map of Typhoon Fanapi of the 2010 Pacific typhoon season. The points show the location of the storm at 6-hour intervals. The colour represents the storm's maximum sustained wind speeds as classified in the (see below), and the shape of the data points represent the nature of the storm, according to the legend below. | ||
| 날짜 | 2010-09-13–2010-09-21 | ||
| 출처 | Created by Atomic7732 using Wikipedia:WikiProject Tropical cyclones/Tracks. The background image is from NASA. Tracking data is from the Joint Typhoon Warning Center[1]. | ||
| 저자 | Atomic7732 | ||
| Source code InfoField | Track map data table, if present below, is in HURDAT2 or ATCF format. See format details in [2] and [3], respectively.
|
| Public domainPublic domainfalsefalse |
| 이 작품은 저작자인 Atomic7732에 의해 퍼블릭 도메인으로 공개된 작품입니다. 이 공개 선언은 전 세계적으로 유효합니다. 만약 저작권의 포기가 법률적으로 가능하지 않은 경우, Atomic7732은 이 작품을 법적으로 허용되는 한도 내에서 누구나 자유롭게 어떤 목적으로도 제한 없이 사용할 수 있도록 허용합니다. |
날짜/시간 링크를 클릭하면 해당 시간의 파일을 볼 수 있습니다.
| 날짜/시간 | 섬네일 | 크기 | 사용자 | 설명 | |
|---|---|---|---|---|---|
| 현재 | 2020년 6월 18일 (목) 11:06 | | 2,700 × 1,669 (2.66 MB) | Supportstorm | JTWC/JMA data |
| 2016년 9월 24일 (토) 00:39 |  | 2,700 × 1,669 (2.8 MB) | Supportstorm | IBTrACS version | |
| 2011년 6월 21일 (화) 06:50 |  | 1,024 × 633 (540 KB) | Iune | Update with JTWC Best Track | |
| 2010년 11월 15일 (월) 12:44 |  | 1,024 × 633 (613 KB) | Cyclonebiskit | update | |
| 2010년 9월 26일 (일) 01:04 |  | 1,024 × 633 (391 KB) | Cyclonebiskit | update | |
| 2010년 9월 24일 (금) 08:44 |  | 1,024 × 633 (548 KB) | Syntheticalconnections | {{Information |Description={{en|1=== Summary == {{Information |Description={{en|Track map of Typhoon Fanapi of the 2010 Pacific typhoon season. The points show the location |
다음 위키에서 이 파일을 사용하고 있습니다: