
Carbon_basic_phase_diagram.png (672×509 điểm ảnh, kích thước tập tin: 13 kB, kiểu MIME: image/png)
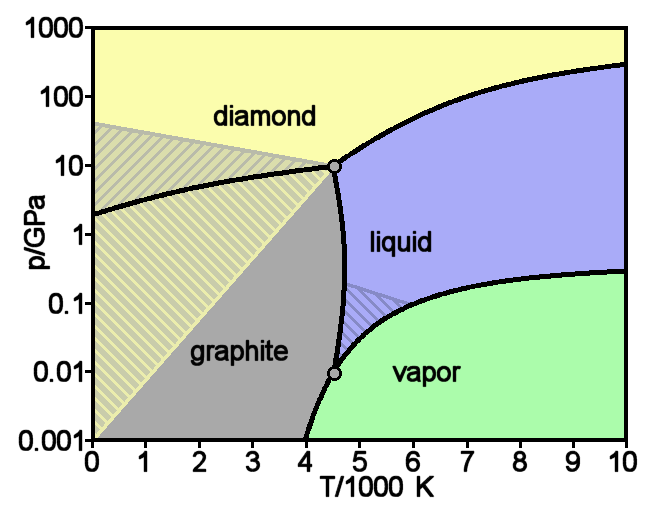
| Miêu tảCarbon basic phase diagram.png | English: Theoretical phase diagram of carbon, which shows the state of matter for varying temperatures and pressures. The hatched regions indicate conditions under which one phase is metastable, so that two phases can coexist. The source reference says that the phase diagram is well established only up to around 100 GPa. More recent work shows that the melting point does not go as high as 10,000 K.Accurate illustration but not a pixel-exact plot. Also note that a considerable disagreement exists between theory and experiment, e.g., for the triple point doi:10.1016/0008-6223(76)90010-5 |
| Ngày | Source: English Wikipedia, original upload 16 April 2005 by Femto en:Image:Carbon basic phase diagram.png |
| Nguồn gốc | Own work using:
|
| Tác giả | User name tại Wikipedia Tiếng Anh |
| Phiên bản khác | [sửa đổi]
.png:
.jpg:
|
| Public domainPublic domainfalsefalse |
| | Tác phẩm này đã được tác giả của nó, Femto tại Wikimedia Commons , phát hành vào phạm vi công cộng. Điều này có hiệu lực trên toàn thế giới. Trong trường hợp không khả thi về mặt luật pháp: |
Nhấn vào ngày/giờ để xem nội dung tập tin tại thời điểm đó.
| Ngày/giờ | Hình xem trước | Kích cỡ | Thành viên | Miêu tả | |
|---|---|---|---|---|---|
| hiện tại | 08:19, ngày 7 tháng 9 năm 2005 | | 672×509 (13 kB) | Saperaud~commonswiki | Basic phase diagram of carbon, which shows the state of matter for varying temperatures and pressures. The hatched regions indicate conditions under which one phase is metastable, so that two phases can coexist. Accurate illustration but not a pixel-exac |
Những wiki sau đang sử dụng tập tin này:


