Tập tin:Crude oil spread.svg

Tập tin gốc (tập tin SVG, 825×300 điểm ảnh trên danh nghĩa, kích thước: 57 kB)
Miêu tả
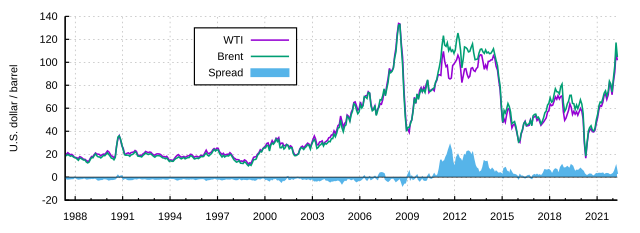
| Miêu tả | Deutsch: Preisentwicklung der Ölsorten West Texas Intermediate (WTI) und Brent sowie die Entwicklung des Preisunterschiedes („Spread“ = Brent minus WTI) zwischen beiden Sorten, Rohdaten: siehe unten. English: Price and spread (= Brent minus WTI) histories of the two crude oil types West Texas Intermediate (WTI) and Brent, raw data: see below |
| Ngày | |
| Nguồn gốc | Tác phẩm được tạo bởi người tải lên |
| Tác giả | StefanPohl, updated by Gretarsson |
| SVG genesis |
Giấy phép
| Tập tin này được phân phối theo Creative Commons Hiến tặng vào Phạm vi Công cộng Toàn thế giới CC0. | |
| Người nào gán tài liệu này với tác phẩm nghĩa là đã hiến tác phẩm cho phạm vi công cộng bằng cách từ bỏ mọi quyền lợi của người đó đối với tác phẩm theo quy định của luật bản quyền, có hiệu lực trên toàn thế giới và các quyền lợi pháp lý phụ mà người đó có được trong tác phẩm, đến mức độ mà luật pháp cho phép. Bạn được tự do sao chép, phân phối, và biểu diễn tác phẩm này, tất cả đều không bắt buộc ghi công. |
Code and raw data
#DateWTIBrentSpread15/05/8719.4418.58-0.8615/06/8720.0718.86-1.2115/07/8721.3419.86-1.4815/08/8720.3118.98-1.3315/09/8719.5318.31-1.2215/10/8719.8618.76-1.115/11/8718.8517.78-1.0715/12/8717.2817.05-0.2315/01/8817.1316.75-0.3815/02/8816.815.73-1.0715/03/8816.214.73-1.4715/04/8817.8616.6-1.2615/05/8817.4216.31-1.1115/06/8816.5315.54-0.9915/07/8815.514.91-0.5915/08/8815.5214.89-0.6315/09/8814.5413.18-1.3615/10/8813.7712.41-1.3615/11/8814.1413.02-1.1215/12/8816.3815.31-1.0715/01/8918.0217.17-0.8515/02/8917.9416.89-1.0515/03/8919.4818.7-0.7815/04/8921.0720.32-0.7515/05/8920.1218.63-1.4915/06/8920.0517.67-2.3815/07/8919.7817.62-2.1615/08/8918.5816.77-1.8115/09/8919.5917.77-1.8215/10/8920.118.91-1.1915/11/8919.8618.73-1.1315/12/8921.119.84-1.2615/01/9022.8621.25-1.6115/02/9022.1119.81-2.315/03/9020.3918.39-215/04/9018.4316.61-1.8215/05/9018.216.35-1.8515/06/9016.715.1-1.615/07/9018.4517.17-1.2815/08/9027.3127.17-0.1415/09/9033.5134.91.3915/10/9036.0436.02-0.0215/11/9032.3333.070.7415/12/9027.2828.270.9915/01/9125.2323.57-1.6615/02/9120.4819.54-0.9415/03/9119.919.08-0.8215/04/9120.8319.18-1.6515/05/9121.2319.19-2.0415/06/9120.1918.17-2.0215/07/9121.419.4-215/08/9121.6919.77-1.9215/09/9121.8920.5-1.3915/10/9123.2322.21-1.0215/11/9122.4621.11-1.3515/12/9119.518.41-1.0915/01/9218.7918.16-0.6315/02/9219.0118.05-0.9615/03/9218.9217.63-1.2915/04/9220.2318.92-1.3115/05/9220.9819.89-1.0915/06/9222.3921.16-1.2315/07/9221.7820.24-1.5415/08/9221.3419.74-1.615/09/9221.8820.27-1.6115/10/9221.6920.26-1.4315/11/9220.3419.21-1.1315/12/9219.4118.14-1.2715/01/9319.0317.39-1.6415/02/9320.0918.47-1.6215/03/9320.3218.79-1.5315/04/9320.2518.67-1.5815/05/9319.9518.51-1.4415/06/9319.0917.65-1.4415/07/9317.8916.78-1.1115/08/9318.0116.7-1.3115/09/9317.516.01-1.4915/10/9318.1516.61-1.5415/11/9316.6115.2-1.4115/12/9314.5213.73-0.7915/01/9415.0314.29-0.7415/02/9414.7813.8-0.9815/03/9414.6813.82-0.8615/04/9416.4215.23-1.1915/05/9417.8916.19-1.715/06/9419.0616.76-2.315/07/9419.6617.6-2.0615/08/9418.3816.89-1.4915/09/9417.4515.9-1.5515/10/9417.7216.49-1.2315/11/9418.0717.19-0.8815/12/9417.1615.93-1.2315/01/9518.0416.55-1.4915/02/9518.5717.11-1.4615/03/9518.5417.01-1.5315/04/9519.918.65-1.2515/05/9519.7418.35-1.3915/06/9518.4517.31-1.1415/07/9517.3315.85-1.4815/08/9518.0216.1-1.9215/09/9518.2316.7-1.5315/10/9517.4316.11-1.3215/11/9517.9916.86-1.1315/12/9519.0317.93-1.115/01/9618.8617.85-1.0115/02/9619.0918-1.0915/03/9621.3319.85-1.4815/04/9623.520.9-2.615/05/9621.1719.15-2.0215/06/9620.4218.46-1.9615/07/9621.319.57-1.7315/08/9621.920.51-1.3915/09/9623.9722.63-1.3415/10/9624.8824.16-0.7215/11/9623.7122.76-0.9515/12/9625.2323.78-1.4515/01/9725.1323.54-1.5915/02/9722.1820.85-1.3315/03/9720.9719.13-1.8415/04/9719.717.56-2.1415/05/9720.8219.02-1.815/06/9719.2617.58-1.6815/07/9719.6618.46-1.215/08/9719.9518.6-1.3515/09/9719.818.46-1.3415/10/9721.3319.87-1.4615/11/9720.1919.17-1.0215/12/9718.3317.18-1.1515/01/9816.7215.19-1.5315/02/9816.0614.07-1.9915/03/9815.1213.1-2.0215/04/9815.3513.53-1.8215/05/9814.9114.36-0.5515/06/9813.7212.21-1.5115/07/9814.1712.08-2.0915/08/9813.4711.91-1.5615/09/9815.0313.34-1.6915/10/9814.4612.7-1.7615/11/981311.04-1.9615/12/9811.359.82-1.5315/01/9912.5211.11-1.4115/02/9912.0110.27-1.7415/03/9914.6812.51-2.1715/04/9917.3115.29-2.0215/05/9917.7215.23-2.4915/06/9917.9215.86-2.0615/07/9920.119.08-1.0215/08/9921.2820.22-1.0615/09/9923.822.54-1.2615/10/9922.6922-0.6915/11/992524.58-0.4215/12/9926.125.47-0.6315/01/0027.2625.51-1.7515/02/0029.3727.78-1.5915/03/0029.8427.49-2.3515/04/0025.7222.76-2.9615/05/0028.7927.74-1.0515/06/0031.8229.8-2.0215/07/0029.728.68-1.0215/08/0031.2630.2-1.0615/09/0033.8833.14-0.7415/10/0033.1130.96-2.1515/11/0034.4232.55-1.8715/12/0028.4425.66-2.7815/01/0129.5925.62-3.9715/02/0129.6127.5-2.1115/03/0127.2524.5-2.7515/04/0127.4925.66-1.8315/05/0128.6328.31-0.3215/06/0127.627.850.2515/07/0126.4324.61-1.8215/08/0127.3725.68-1.6915/09/0126.225.62-0.5815/10/0122.1720.54-1.6315/11/0119.6418.8-0.8415/12/0119.3918.71-0.6815/01/0219.7219.42-0.315/02/0220.7220.28-0.4415/03/0224.5323.7-0.8315/04/0226.1825.73-0.4515/05/0227.0425.35-1.6915/06/0225.5224.08-1.4415/07/0226.9725.74-1.2315/08/0228.3926.65-1.7415/09/0229.6628.4-1.2615/10/0228.8427.54-1.315/11/0226.3524.34-2.0115/12/0229.4628.33-1.1315/01/0332.9531.18-1.7715/02/0335.8332.77-3.0615/03/0333.5130.61-2.915/04/0328.1725-3.1715/05/0328.1125.86-2.2515/06/0330.6627.65-3.0115/07/0330.7628.35-2.4115/08/0331.5729.89-1.6815/09/0328.3127.11-1.215/10/0330.3429.61-0.7315/11/0331.1128.75-2.3615/12/0332.1329.81-2.3215/01/0434.3131.28-3.0315/02/0434.6930.86-3.8315/03/0436.7433.63-3.1115/04/0436.7533.59-3.1615/05/0440.2837.57-2.7115/06/0438.0335.18-2.8515/07/0440.7838.22-2.5615/08/0444.942.74-2.1615/09/0445.9443.2-2.7415/10/0453.2849.78-3.515/11/0448.4743.11-5.3615/12/0443.1539.6-3.5515/01/0546.8444.51-2.3315/02/0548.1545.48-2.6715/03/0554.1953.1-1.0915/04/0552.9851.88-1.115/05/0549.8348.65-1.1815/06/0556.3554.35-215/07/055957.52-1.4815/08/0564.9963.98-1.0115/09/0565.5962.91-2.6815/10/0562.2658.54-3.7215/11/0558.3255.24-3.0815/12/0559.4156.86-2.5515/01/0665.4962.99-2.515/02/0661.6360.21-1.4215/03/0662.6962.06-0.6315/04/0669.4470.260.8215/05/0670.8469.78-1.0615/06/0670.9568.56-2.3915/07/0674.4173.67-0.7415/08/0673.0473.230.1915/09/0663.861.96-1.8415/10/0658.8957.81-1.0815/11/0659.0858.76-0.3215/12/0661.9662.470.5115/01/0754.5153.68-0.8315/02/0759.2857.56-1.7215/03/0760.4462.051.6115/04/0763.9867.493.5115/05/0763.4667.213.7515/06/0767.4971.053.5615/07/0774.1276.932.8115/08/0772.3670.76-1.615/09/0779.9277.17-2.7515/10/0785.882.34-3.4615/11/0794.7792.41-2.3615/12/0791.6990.93-0.7615/01/0892.9792.18-0.7915/02/0895.3994.99-0.415/03/08105.45103.64-1.8115/04/08112.58109.07-3.5115/05/08125.4122.8-2.615/06/08133.88132.32-1.5615/07/08133.37132.72-0.6515/08/08116.67113.24-3.4315/09/08104.1197.23-6.8815/10/0876.6171.58-5.0315/11/0857.3152.45-4.8615/12/0841.1239.95-1.1715/01/0941.7143.441.7315/02/0939.0943.324.2315/03/0947.9446.54-1.415/04/0949.6550.180.5315/05/0959.0357.3-1.7315/06/0969.6468.61-1.0315/07/0964.1564.440.2915/08/0971.0572.511.4615/09/0969.4167.65-1.7615/10/0975.7272.77-2.9515/11/0977.9976.66-1.3315/12/0974.4774.46-0.0115/01/1078.3376.17-2.1615/02/1076.3973.75-2.6415/03/1081.278.83-2.3715/04/1084.2984.820.5315/05/1073.7475.952.2115/06/1075.3474.76-0.5815/07/1076.3275.58-0.7415/08/1076.677.040.4415/09/1075.2477.842.615/10/1081.8982.670.7815/11/1084.2585.281.0315/12/1089.1591.452.315/01/1189.1796.527.3515/02/1188.58103.7215.1415/03/11102.86114.6411.7815/04/11109.53123.2613.7315/05/11100.9114.9914.0915/06/1196.26113.8317.5715/07/1197.3116.9719.6715/08/1186.33110.2223.8915/09/1185.52112.8327.3115/10/1186.32109.5523.2315/11/1197.16110.7713.6115/12/1198.56107.879.3115/01/12100.27110.6910.4215/02/12102.2119.3317.1315/03/12106.16125.4519.2915/04/12103.32119.7516.4315/05/1294.66110.3415.6815/06/1282.395.1612.8615/07/1287.9102.6214.7215/08/1294.13113.3619.2315/09/1294.51112.8618.3515/10/1289.49111.7122.2215/11/1286.53109.0622.5315/12/1287.86109.4921.6315/01/1394.76112.9618.215/02/1395.31116.0520.7415/03/1392.94108.4715.5315/04/1392.02102.2510.2315/05/1394.51102.568.0515/06/1395.77102.927.1515/07/13104.67107.933.2615/08/13106.57111.284.7115/09/13106.29111.65.3115/10/13100.54109.088.5415/11/1393.86107.7913.9315/12/1397.63110.7613.1315/01/1494.62108.1213.515/02/14100.82108.98.0815/03/14100.8107.486.6815/04/14102.07107.765.6915/05/14102.18109.547.3615/06/14105.79111.86.0115/07/14103.59106.773.1815/08/1496.54101.615.0715/09/1493.2197.093.8815/10/1484.487.433.0315/11/1475.7979.443.6515/12/1459.2962.343.0515/01/1547.2247.760.5415/02/1550.5858.17.5215/03/1547.8255.898.0715/04/1554.4559.525.0715/05/1559.2764.084.8115/06/1559.8261.481.6615/07/1550.956.565.6615/08/1542.8746.523.6515/09/1545.4847.622.1415/10/1546.2248.432.2115/11/1542.4444.271.8315/12/1537.1938.010.8215/01/1631.6830.7-0.9815/02/1630.3232.181.8615/03/1637.5538.210.6615/04/1640.7541.580.8315/05/1646.7146.740.0315/06/1648.7648.25-0.5115/07/1644.6544.950.315/08/1644.7245.841.1215/09/1645.1846.571.3915/10/1649.7849.52-0.2615/11/1645.6644.73-0.9315/12/1651.9753.311.3415/01/1752.554.582.0815/02/1753.4754.871.415/03/1749.3351.592.2615/04/1751.0652.311.2515/05/1748.4850.331.8515/06/1745.1846.371.1915/07/1746.6348.481.8515/08/1748.0451.73.6615/09/1749.8256.156.3315/10/1751.5857.515.9315/11/1756.6462.716.0715/12/1757.8864.376.4915/01/1863.769.085.3815/02/1862.2365.323.0915/03/1862.7366.023.2915/04/1866.2572.115.8615/05/1869.9876.98715/06/1867.8774.416.5415/07/1870.9874.253.2715/08/1868.0672.534.4715/09/1870.2378.898.6615/10/1870.7581.0310.2815/11/1856.9664.757.7915/12/1849.5257.367.8415/01/1951.3859.418.0315/02/1954.9563.969.0115/03/1958.1566.147.9915/04/1963.8671.237.3715/05/1960.8371.3210.4915/06/1954.6664.229.5615/07/1957.3563.926.5715/08/1954.8159.044.2315/09/1956.9562.835.8815/10/1953.9659.715.7515/11/1957.0363.216.1815/12/1959.8867.317.4315/01/2057.5263.656.1315/02/2050.5455.665.1215/03/2029.2132.012.815/04/2016.5518.381.8315/05/2028.5629.380.8215/06/2038.3140.271.9615/07/2040.7143.242.5315/08/2042.3444.742.415/09/2039.6340.911.2815/10/2039.440.190.7915/11/2040.9442.691.7515/12/2047.0249.992.9715/01/215254.772.7715/02/2159.0462.283.2415/03/2162.3365.413.0815/04/2161.7264.813.0915/05/2165.1768.533.3615/06/2171.3873.161.7815/07/2172.4975.172.6815/08/2167.7370.753.0215/09/2171.6574.492.8415/10/2181.4883.542.0615/11/2179.1581.051.915/12/2171.7174.172.4615/01/2283.2286.513.2915/02/2291.6497.135.4915/03/22108.5117.258.7515/04/22101.78104.582.8
set xdata timeset xrange ["15/05/87":"15/04/22"]set format x "%Y"set yrange [-20:140]set ylabel "U.S. dollar / barrel"set border 3 lw 1.5set tics nomirror scale 0.5set key at "01/01/02",130 box lw 1.5 width 0.5 height 0.5set gridset terminal svg size 825,300 font "Arial, 14"set output "Crude oil spread.svg"plot "WTI_brent_spread.txt" u 1:2 w l lw 2 t "WTI", "WTI_brent_spread.txt" u 1:3 w l lw 2 t "Brent", "WTI_brent_spread.txt" u 1:4:(0) w filledcurve t "Spread", "WTI_brent_spread.txt" u 1:4 w l lc rgb "#56B4E9" lw 2 notitle, 0 lc rgb "#66000000" lw 1.5 notitle
Der Befehlscode kann ohne weiteres in die Zwischenablage kopiert und in das Kommandozeilen-Fenster von Gnuplot eingefügt werden. Die Datei wird erstellt, indem nach dem Einfügen die ENTER-Taste betätigt wird (es sei denn, unterhalb der eingefügten Sequenz befindet sich ein Prompt -- in diesem Fall wurde der Code bereits ausgeführt und die Datei ist bereits erstellt worden!). Damit alles funktioniert, muss die .txt-Datei, die die Rohdaten enthält, WTI_brent_spread.txt genannt werden und im gleichen Verzeichnis liegen wie die gnuplot.exe (d.h. im bin-Ordner des Gnuplot-Installationsverzeichnisses). Die Crude oil spread.svg wird im gleichen Verzeichnis abgelegt werden (und wenn nicht dort, dann im Benutzer-Ordner Dokumente).
The command code can be copied to the clipboard and pasted into Gnuplot’s command line shell window. The file is created by pressing ENTER after pasting (unless there appears a prompt after the pasted sequence -- in this case the code has already been run!). In order to make it work properly the .txt file containing the raw data (see above) has to be named WTI_brent_spread.txt and has to be located in the same directory as the gnuplot.exe (i.e. the bin folder of the Gnuplot install directory). The Crude oil spread.svg will be saved in the same directory (and if not it might have been saved to the user’s folder Documents).
Lịch sử tập tin
Nhấn vào ngày/giờ để xem nội dung tập tin tại thời điểm đó.
| Ngày/giờ | Hình xem trước | Kích cỡ | Thành viên | Miêu tả | |
|---|---|---|---|---|---|
| hiện tại | 02:22, ngày 31 tháng 5 năm 2022 | 825×300 (57 kB) | Gretarsson | Update | |
| 01:43, ngày 25 tháng 3 năm 2018 | 825×300 (53 kB) | Gretarsson | ‘smoothened’ area graph (“spread”) by superimposing a line graph of same color on it and decreased ticmark size by 50 %, both in order to make the diagram look more similar in style to its first version | ||
| 17:27, ngày 6 tháng 3 năm 2018 | 825×300 (48 kB) | Gretarsson | used decimal period in the datafile instead of comma -> more precise curves (sorry for such a beginner's mistake); some minor cosmetic changes | ||
| 20:37, ngày 5 tháng 3 năm 2018 | 825×300 (51 kB) | Gretarsson | update (end date Jan 2018) | ||
| 20:43, ngày 6 tháng 8 năm 2016 | 800×300 (45 kB) | StefanInaktiv | User created page with UploadWizard |
Trang sử dụng tập tin
Sử dụng tập tin toàn cục
Những wiki sau đang sử dụng tập tin này:
- Trang sử dụng tại af.wikipedia.org
- Trang sử dụng tại de.wikipedia.org
- Trang sử dụng tại en.wikipedia.org
- Trang sử dụng tại es.wikipedia.org
- Trang sử dụng tại eu.wikipedia.org
- Trang sử dụng tại fa.wikipedia.org
- Trang sử dụng tại ja.wikipedia.org
- Trang sử dụng tại ko.wikipedia.org
- Trang sử dụng tại pt.wikipedia.org
- Trang sử dụng tại simple.wikipedia.org
- Trang sử dụng tại sv.wikipedia.org
- Trang sử dụng tại uk.wikipedia.org