Ireland had an estimated population of 5,281,600 as of 1 April 2023.[1]
| Demographics of Ireland | |
|---|---|
 Population pyramid of Ireland in 2022 | |
| Population | 5,281,600 (2023) |
| Density | 73 per km2 |
| Growth rate | 8.1% |
| Birth rate | 10.5 births/1,000 population (2023 est.) |
| Death rate | 6.7 deaths/1,000 population (2023 est.) |
| Life expectancy | 80.19 years |
| • male | 78 years |
| • female | 82.6 years |
| Fertility rate | 1.70 children born/woman (2022 est.) |
| Infant mortality rate | 3.85 deaths/1,000 live births |
| Net migration rate | 0.86 migrant(s)/1,000 population |
| Age structure | |
| 0–14 years | 19.98% |
| 15–64 years | 65.26% |
| 65 and over | 14.76% |
| Sex ratio | |
| Total | 0.99 male/female |
| At birth | 1.057 male/female |
| Under 15 | 1.07 male/female |
| 15–64 years | 1.00 male/female |
| 65 and over | 0.81 male/female |
| Nationality | |
| Nationality | Irish |
| Major ethnic | Irish 76.5% |
| Minor ethnic | Other White 10.3%, Asian: 3.7%, Black: 1.5%, Irish Travellers 0.7%, Other 1.3%, Not stated 6.7% (2022) |
| Language | |
| Official | Irish, English |
| Spoken | Irish sign language, Shelta, Ulster Scots |
Demographic history
The island of Ireland's population has fluctuated over history. In the 18th and early 19th centuries, Ireland experienced a major population boom as a result of the Agricultural and Industrial Revolutions. In the 50-year period 1790–1840, the population of the island doubled from 4 million to 8 million. At its peak, Ireland's population density was similar to that of England and continental Europe.
This changed dramatically with the Great Famine of the mid-19th century, which led to mass starvation and consequent mass emigration. In the area covering the present day Republic of Ireland, the population reached about 6.5 million in the mid-1840s. Ten years later it was down to 5 million. The population continued a slow decline well into the 20th century, with the Republic recording a low of 2.8 million in the 1961 census.[2]
During the 1960s, the population started to grow once more, although slowly as emigration was still common. In the 1990s the country entered a period of rapid economic growth as a result of the Celtic Tiger Irish economic boom, and the Republic started to receive immigration. Many former Irish emigrants returned home, and Ireland became an attractive destination for immigrants, from other member states EU such as Central Europe, but also from outside the EU such as Africa, Asia and elsewhere. With the 2008 onset of the Irish economic and banking crisis, the state's economy suffered, and Ireland has once again been experiencing net emigration of its citizens, but immigration remains high.
In November 2013, Eurostat reported that the Republic had the largest net emigration rate of any member state, at 7.6 emigrants per 1,000 population. However, it has the youngest population of any European Union member state[3] and its population size is predicted to grow for many decades, in contrast with the declining population predicted for most European countries. A report published in 2008 predicted that the population would reach 6.7 million by 2060.[4] The Republic has also been experiencing a baby boom, with increasing birth rates and overall fertility rates.[5] Despite this, the total fertility rate is still below replacement depending on when the measurement is taken. The Irish fertility rate is still the highest of any European country.[6] This increase is significantly fuelled by non-Irish immigration – in 2009, one-quarter of all babies born in Ireland were born to foreign-born mothers.[7]
| Year | Pop. | ±% p.a. |
|---|---|---|
| 1841 | 6,528,799 | — |
| 1851 | 5,111,557 | −2.42% |
| 1861 | 4,402,111 | −1.48% |
| 1871 | 4,053,187 | −0.82% |
| 1881 | 3,870,020 | −0.46% |
| 1891 | 3,468,694 | −1.09% |
| 1901 | 3,221,823 | −0.74% |
| 1911 | 3,139,688 | −0.26% |
| 1926 | 2,971,992 | −0.37% |
| 1936 | 2,968,420 | −0.01% |
| 1946 | 2,955,107 | −0.04% |
| 1951 | 2,960,593 | +0.04% |
| 1961 | 2,818,341 | −0.49% |
| 1971 | 2,978,248 | +0.55% |
| 1981 | 3,443,405 | +1.46% |
| 1991 | 3,525,719 | +0.24% |
| 2002 | 3,917,203 | +0.96% |
| 2011 | 4,588,252 | +1.77% |
| 2022 | 5,149,139 | +1.05% |
| Source: CSO[8] 2019[9] | ||
Population
The population of Ireland was 5,123,536 people in 2022.Demographic statistics as of 2019.[10]
- One birth every 8 minutes
- One death every 16 minutes
- One net migrant every 90 minutes
- Net gain of one person every 14 minutes
- Geographic Population Distribution
Urban population (areas with >1,500 people): 62.0% (2011)
Rural population: 38.0% (2011)

Fertility
The total fertility rate is the number of children born per woman.[11]
| Year | 1850 | 1851 | 1852 | 1853 | 1854 | 1855 | 1856 | 1857 | 1858 | 1859 | 1860[11] |
|---|---|---|---|---|---|---|---|---|---|---|---|
| Total fertility rate of Ireland | 4.20 | 4.13 | 4.06 | 3.99 | 3.93 | 3.86 | 3.79 | 3.72 | 3.65 | 3.58 | 3.51 |
| Year | 1861 | 1862 | 1863 | 1864 | 1865 | 1866 | 1867 | 1868 | 1869 | 1870[11] |
|---|---|---|---|---|---|---|---|---|---|---|
| Total fertility rate of Ireland | 3.45 | 3.38 | 3.31 | 3.24 | 3.47 | 3.54 | 3.53 | 3.58 | 3.58 | 3.71 |
| Year | 1871 | 1872 | 1873 | 1874 | 1875 | 1876 | 1877 | 1878 | 1879 | 1880[11] |
|---|---|---|---|---|---|---|---|---|---|---|
| Total fertility rate of Ireland | 3.67 | 3.72 | 3.63 | 3.57 | 3.51 | 3.57 | 3.54 | 3.40 | 3.44 | 3.31 |
| Year | 1881 | 1882 | 1883 | 1884 | 1885 | 1886 | 1887 | 1888 | 1889 | 1890[11] |
|---|---|---|---|---|---|---|---|---|---|---|
| Total fertility rate of Ireland | 3.33 | 3.22 | 3.15 | 3.20 | 3.15 | 3.11 | 3.10 | 3.06 | 3.04 | 2.99 |
| Year | 1891 | 1892 | 1893 | 1894 | 1895 | 1896 | 1897 | 1898 | 1899[11] |
|---|---|---|---|---|---|---|---|---|---|
| Total fertility rate of Ireland | 3.05 | 3.01 | 3.09 | 3.08 | 3.12 | 3.17 | 3.16 | 3.13 | 3.09 |
Birth rate; 13.8 births/1,000 population (2018 est.) Country comparison to the world: 137th
Total fertility rate; 1.96 children born/woman (2018 est.) Country comparison to the world: 125th
Mother's mean age at first birth; 30.7 years (2015 est.)
Life expectancy


Death rate; 6.6 deaths/1,000 population (2018 est.) Country comparison to the world: 140th
| Period | Life expectancy in Years | Period | Life expectancy in Years |
|---|---|---|---|
| 1950–1955 | 66.9 | 1985–1990 | 74.2 |
| 1955–1960 | 69.2 | 1990–1995 | 75.3 |
| 1960–1965 | 70.1 | 1995–2000 | 76.0 |
| 1965–1970 | 70.8 | 2000–2005 | 77.8 |
| 1970–1975 | 71.2 | 2005–2010 | 79.7 |
| 1975–1980 | 72.0 | 2010–2015 | 80.9 |
| 1980–1985 | 73.2 |
Source: UN World Population Prospects
Age structure
Age structure[12]
- 0–14 years: 21.37% (male 554,110 /female 529,067)
- 15–24 years: 11.92% (male 306,052 /female 297,890)
- 25–54 years: 42.86% (male 1,091,495 /female 1,080,594)
- 55–64 years: 10.53% (male 267,255 /female 266,438)
- 65 years and over: 13.32% (male 312,694 /female 362,455) (2018 est.)
Median age; total: 37.1 years
- male: 36.8 years
- female: 37.5 years (2018 est.)
Vital statistics
| Population on 1 April | Live births | Deaths | Natural change | Crude birth rate (per 1000) | Crude death rate (per 1000) | Natural change (per 1000) | Crude migration (per 1000) | Total fertility rate[fn 1][11] | |
|---|---|---|---|---|---|---|---|---|---|
| 1900 | 3,231,000 | 70,435 | 21.8 | 3.04 | |||||
| 1901 | 3,234,000 | 70,194 | 21.7 | 2.92 | |||||
| 1902 | 3,205,000 | 71,156 | 22.2 | 3.08 | |||||
| 1903 | 3,191,000 | 70,541 | 22.1 | 3.09 | |||||
| 1904 | 3,169,000 | 72,261 | 22.8 | 3.16 | |||||
| 1905 | 3,160,000 | 71,427 | 22.6 | 3.13 | |||||
| 1906 | 3,164,000 | 72,147 | 22.8 | 3.15 | |||||
| 1907 | 3,145,000 | 70,773 | 22.5 | 3.11 | |||||
| 1908 | 3,147,000 | 71,439 | 22.7 | 3.12 | |||||
| 1909 | 3,135,000 | 72,119 | 23.0 | 3.14 | |||||
| 1910 | 3,132,000 | 71,744 | 22.9 | 3.12 | |||||
| 1911 | 3,129,000 | 71,351 | 22.8 | 3.07 | |||||
| 1912 | 3,116,000 | 70,734 | 50,489 | 20,245 | 22.7 | 16.2 | 6.5 | -9.7 | 3.10 |
| 1913 | 3,106,000 | 70,214 | 52,184 | 18,030 | 22.6 | 16.8 | 5.8 | -8.4 | 3.09 |
| 1914 | 3,098,000 | 69,102 | 49,674 | 19,428 | 22.3 | 16.0 | 6.3 | -16.0 | 3.05 |
| 1915 | 3,068,000 | 67,501 | 53,713 | 13,788 | 22.0 | 17.5 | 4.5 | -3.5 | 2.99 |
| 1916 | 3,071,000 | 64,814 | 50,627 | 14,187 | 21.1 | 16.5 | 4.6 | -4.6 | 2.87 |
| 1917 | 3,071,000 | 61,429 | 51,713 | 9,716 | 20.0 | 16.8 | 3.2 | -3.9 | 2.71 |
| 1918 | 3,069,000 | 61,092 | 53,682 | 7,410 | 19.9 | 17.5 | 2.4 | -5.3 | 2.73 |
| 1919 | 3,060,000 | 61,829 | 55,776 | 6,044 | 19.9 | 18.2 | 1.7 | 12.0 | 2.75 |
| 1920 | 3,102,000 | 67,015 | 45,521 | 21,494 | 21.6 | 14.7 | 6.9 | -8.8 | 3.20 |
| 1921 | 3,096,000 | 61,010 | 44,537 | 16,473 | 19.7 | 14.4 | 5.3 | -13.7 | 2.79 |
| 1922 | 3,070,000 | 58,849 | 44,547 | 14,302 | 18.5 | 14.5 | 4.0 | -22.2 | 2.61 |
| 1923 | 3,014,000 | 62,417 | 42,217 | 19,473 | 20.5 | 14.0 | 6.5 | -9.5 | 2.74 |
| 1924 | 3,005,000 | 63,402 | 45,180 | 18,222 | 21.1 | 15.0 | 6.1 | -12.8 | 2.83 |
| 1925 | 2,985,000 | 62,069 | 43,650 | 18,419 | 20.8 | 14.6 | 6.2 | -10.9 | 2.79 |
| 1926 | 2,971,000 | 61,176 | 41,740 | 19,436 | 20.6 | 14.0 | 6.5 | -11.2 | 2.76 |
| 1927 | 2,957,000 | 60,054 | 43,677 | 16,377 | 20.3 | 14.8 | 5.5 | -9.9 | 2.72 |
| 1928 | 2,944,000 | 59,176 | 41,792 | 17,384 | 20.1 | 14.2 | 5.9 | -8.3 | 2.69 |
| 1929 | 2,937,000 | 58,280 | 42,991 | 15,289 | 19.8 | 14.6 | 5.2 | -8.6 | 2.66 |
| 1930 | 2,927,000 | 58,353 | 41,702 | 16,651 | 19.9 | 14.2 | 5.7 | -3.7 | 2.54 |
| 1931 | 2,933,000 | 57,086 | 42,947 | 14,139 | 19.5 | 14.6 | 4.8 | 0.7 | 2.49 |
| 1932 | 2,949,000 | 56,240 | 42,984 | 13,256 | 19.1 | 14.6 | 4.5 | -0.1 | 2.43 |
| 1933 | 2,962,000 | 57,364 | 40,539 | 16,825 | 19.4 | 13.7 | 5.7 | -2.7 | 2.47 |
| 1934 | 2,971,000 | 57,897 | 39,083 | 18,814 | 19.5 | 13.2 | 6.3 | -6.3 | 2.49 |
| 1935 | 2,971,000 | 58,266 | 41,543 | 16,723 | 19.6 | 14.0 | 5.6 | -6.9 | 2.50 |
| 1936 | 2,967,000 | 58,115 | 42,586 | 15,529 | 19.6 | 14.4 | 5.2 | -11.6 | 2.50 |
| 1937 | 2,948,000 | 56,488 | 45,086 | 11,402 | 19.2 | 15.3 | 3.9 | -7.6 | 2.45 |
| 1938 | 2,937,000 | 56,925 | 40,041 | 16,884 | 19.4 | 13.6 | 5.7 | -6.7 | 2.47 |
| 1939 | 2,934,000 | 56,070 | 41,717 | 14,353 | 19.1 | 14.2 | 4.9 | 3.3 | 2.43 |
| 1940 | 2,958,000 | 56,594 | 41,885 | 14,709 | 19.1 | 14.2 | 5.0 | 6.8 | 2.43 |
| 1941 | 2,993,000 | 56,780 | 43,797 | 12,983 | 19.0 | 14.6 | 4.3 | -14.3 | 2.42 |
| 1942 | 2,963,000 | 66,117 | 41,640 | 24,477 | 22.3 | 14.1 | 8.3 | -14.0 | 2.85 |
| 1943 | 2,946,000 | 64,375 | 43,494 | 20,881 | 21.9 | 14.8 | 7.1 | -7.8 | 2.80 |
| 1944 | 2,944,000 | 65,425 | 45,128 | 20,297 | 22.2 | 15.3 | 6.9 | -4.2 | 2.84 |
| 1945 | 2,952,000 | 66,861 | 42,762 | 24,099 | 22.6 | 14.5 | 8.2 | -6.5 | 2.90 |
| 1946 | 2,957,000 | 67,922 | 41,457 | 26,465 | 23.0 | 14.0 | 8.9 | -3.2 | 2.94 |
| 1947 | 2,974,000 | 68,978 | 44,061 | 24,917 | 23.2 | 14.8 | 8.4 | -4.7 | 2.98 |
| 1948 | 2,985,000 | 65,930 | 36,357 | 29,573 | 22.1 | 12.2 | 9.9 | -11.2 | 2.80 |
| 1949 | 2,981,000 | 64,153 | 38,062 | 26,091 | 21.5 | 12.8 | 8.8 | -12.8 | 2.75 |
| 1950 | 2,969,000 | 63,565 | 37,741 | 25,824 | 21.4 | 12.7 | 8.7 | -11.2 | 2.74 |
| 1951 | 2,961,000 | 62,878 | 42,382 | 20,496 | 21.2 | 14.3 | 6.9 | -9.6 | 2.69 |
| 1952 | 2,953,000 | 64,631 | 35,105 | 29,526 | 21.9 | 11.9 | 10.0 | -11.4 | 2.97 |
| 1953 | 2,949,000 | 62,558 | 34,591 | 27,967 | 21.2 | 11.7 | 9.5 | -12.2 | 2.95 |
| 1954 | 2,941,000 | 62,534 | 35,535 | 26,999 | 21.3 | 12.1 | 9.2 | -16.0 | 3.18 |
| 1955 | 2,921,000 | 61,622 | 36,761 | 24,861 | 21.1 | 12.6 | 8.5 | -16.4 | 3.28 |
| 1956 | 2,898,000 | 60,740 | 33,910 | 26,830 | 21.0 | 11.7 | 9.3 | -13.8 | 3.41 |
| 1957 | 2,885,000 | 61,242 | 34,311 | 26,931 | 21.2 | 11.9 | 9.3 | -20.4 | 3.52 |
| 1958 | 2,853,000 | 59,510 | 34,248 | 25,262 | 20.9 | 12.0 | 8.9 | -11.4 | 3.43 |
| 1959 | 2,846,000 | 60,188 | 34,243 | 25,945 | 21.1 | 12.0 | 9.1 | -14.0 | 3.63 |
| 1960 | 2,832,000 | 60,735 | 32,660 | 28,075 | 21.4 | 11.5 | 9.9 | -14.8 | 3.78 |
| 1961 | 2,818,000 | 59,825 | 34,763 | 25,062 | 21.2 | 12.3 | 8.9 | -4.6 | 3.78 |
| 1962 | 2,830,000 | 61,782 | 33,838 | 27,944 | 21.8 | 12.0 | 9.9 | -2.8 | 3.92 |
| 1963 | 2,850,000 | 63,246 | 33,795 | 29,451 | 22.2 | 11.9 | 10.3 | -5.4 | 4.01 |
| 1964 | 2,864,000 | 64,072 | 32,630 | 31,442 | 22.4 | 11.4 | 11.0 | -6.8 | 4.07 |
| 1965 | 2,876,000 | 63,525 | 33,022 | 30,503 | 22.1 | 11.5 | 10.6 | -7.8 | 4.04 |
| 1966 | 2,884,000 | 62,215 | 35,113 | 27,102 | 21.6 | 12.2 | 9.4 | -3.9 | 3.95 |
| 1967 | 2,900,000 | 61,307 | 31,400 | 29,907 | 21.1 | 10.8 | 10.3 | -5.8 | 3.84 |
| 1968 | 2,913,000 | 61,004 | 33,157 | 27,847 | 20.9 | 11.4 | 9.6 | -5.1 | 3.77 |
| 1969 | 2,926,000 | 62,912 | 33,734 | 29,178 | 21.5 | 11.5 | 10.0 | -1.8 | 3.83 |
| 1970 | 2,950,000 | 64,382 | 33,686 | 30,696 | 21.8 | 11.4 | 10.4 | -0,9 | 3.85 |
| 1971 | 2,978,000 | 67,551 | 31,890 | 35,661 | 22.7 | 10.7 | 3.4 | 12.0 | 3.97 |
| 1972 | 3,024,000 | 68,527 | 34,381 | 34,146 | 22.7 | 11.4 | 11.3 | 4.9 | 3.93 |
| 1973 | 3,073,000 | 68,713 | 34,192 | 34,521 | 22.4 | 11.1 | 11.2 | 5.4 | 3.78 |
| 1974 | 3,124,000 | 68,907 | 34,921 | 33,986 | 22.1 | 11.2 | 10.9 | 6.1 | 3.64 |
| 1975 | 3,177,000 | 67,178 | 33,173 | 34,005 | 21.1 | 10.4 | 10.7 | 5.4 | 3.43 |
| 1976 | 3,228,000 | 67,718 | 34,043 | 33,675 | 21.0 | 10.5 | 10.4 | 3.2 | 3.35 |
| 1977 | 3,272,000 | 68,892 | 33,632 | 35,260 | 21.1 | 10.3 | 10.8 | 2.0 | 3.31 |
| 1978 | 3,314,000 | 70,299 | 33,794 | 36,505 | 21.2 | 10.2 | 11.0 | 5.3 | 3.27 |
| 1979 | 3,368,000 | 72,539 | 33,771 | 38,768 | 21.5 | 10.0 | 11.5 | -1.7 | 3.26 |
| 1980 | 3,401,000 | 74,064 | 33,472 | 40,592 | 21.8 | 9.8 | 11.9 | 0.4 | 3.25 |
| 1981 | 3,443,000 | 72,158 | 32,929 | 39,229 | 21.0 | 9.6 | 11.4 | -0.7 | 3.10 |
| 1982 | 3,480,000 | 70,843 | 32,457 | 38,386 | 20.4 | 9.3 | 11.0 | -4.1 | 2.98 |
| 1983 | 3,504,000 | 67,117 | 32,076 | 35,041 | 19.2 | 9.2 | 10.0 | -2.9 | 2.76 |
| 1984 | 3,529,000 | 64,062 | 32,154 | 31,908 | 18.2 | 9.1 | 9.0 | -5.9 | 2.57 |
| 1985 | 3,540,000 | 62,388 | 33,213 | 29,175 | 17.6 | 9.4 | 8.2 | -7.9 | 2.48 |
| 1986 | 3,541,000 | 61,620 | 33,630 | 27,990 | 17.4 | 9.5 | 7.9 | -6.2 | 2.44 |
| 1987 | 3,547,000 | 58,433 | 31,413 | 27,020 | 16.5 | 8.9 | 7.6 | -12.1 | 2.31 |
| 1988 | 3,531,000 | 54,600 | 31,580 | 23,020 | 15.5 | 8.9 | 6.5 | -12.4 | 2.17 |
| 1989 | 3,510,000 | 52,018 | 32,111 | 19,907 | 14.8 | 9.1 | 5.7 | -6.8 | 2.08 |
| 1990 | 3,506,000 | 52,954 | 31,370 | 21,584 | 15.1 | 8.9 | 6.2 | -0.5 | 2.12 |
| 1991 | 3,526,000 | 52,718 | 31,305 | 21,413 | 15.0 | 8.9 | 6.1 | 2.1 | 2.09 |
| 1992 | 3,555,000 | 51,089 | 30,931 | 20,158 | 14.4 | 8.7 | 5.7 | -0.4 | 1.99 |
| 1993 | 3,574,000 | 49,304 | 32,148 | 17,156 | 13.8 | 9.0 | 4.8 | -1.4 | 1.91 |
| 1994 | 3,586,000 | 48,255 | 30,948 | 17,307 | 13.5 | 8.6 | 4.8 | -0.6 | 1.85 |
| 1995 | 3,601,000 | 48,530 | 31,494 | 17,036 | 13.5 | 8.7 | 4.7 | 2.2 | 1.86 |
| 1996 | 3,626,000 | 50,390 | 31,514 | 18,876 | 13.9 | 8.7 | 5.2 | 5.3 | 1.89 |
| 1997 | 3,664,000 | 52,311 | 31,605 | 20,706 | 14.3 | 8.6 | 5.7 | 4.9 | 1.93 |
| 1998 | 3,703,000 | 53,551 | 31,352 | 22,199 | 14.5 | 8.5 | 6.0 | 4.5 | 1.95 |
| 1999 | 3,742,000 | 53,354 | 31,683 | 21,671 | 14.3 | 8.5 | 5.8 | 7.0 | 1.90 |
| 2000 | 3,790,000 | 54,789 | 31,391 | 23,398 | 14.5 | 8.3 | 6.2 | 8.8 | 1.89 |
| 2001 | 3,847,000 | 57,854 | 30,212 | 27,642 | 15.0 | 7.9 | 7.2 | 11.0 | 1.96 |
| 2002 | 3,917,000 | 60,503 | 29,683 | 30,820 | 15.4 | 7.6 | 7.8 | 8.3 | 1.97 |
| 2003 | 3,980,000 | 61,529 | 29,074 | 32,455 | 15.5 | 7.3 | 8.2 | 8.1 | 1.99 |
| 2004 | 4,045,000 | 61,972 | 28,665 | 33,307 | 15.3 | 7.1 | 8.2 | 13.8 | 1.96 |
| 2005 | 4,134,000 | 61,372 | 28,260 | 33,112 | 14.8 | 6.8 | 8.0 | 15.9 | 1.88 |
| 2006 | 4,233,000 | 65,425 | 28,488 | 36,937 | 15.4 | 6.7 | 8.7 | 16.3 | 1.93 |
| 2007 | 4,339,000 | 71,389 | 28,117 | 43,272 | 16.3 | 6.4 | 9.9 | 9.2 | 2.04 |
| 2008 | 4,422,000 | 75,173 | 28,274 | 46,899 | 16.8 | 6.3 | 10.5 | -2.1 | 2.09 |
| 2009 | 4,459,000 | 75,554 | 28,380 | 47,174 | 16.7 | 6.3 | 10.4 | -7.9 | 2.10 |
| 2010 | 4,470,000 | 75,174 | 27,961 | 47,213 | 16.5 | 6.1 | 10.4 | 13.1 | 2.07 |
| 2011 | 4,575,000 | 74,033 | 28,456 | 45,577 | 16.2 | 6.2 | 10.0 | -5.8 | 2.03 |
| 2012 | 4,594,000 | 71,674 | 29,186 | 42,488 | 15.6 | 6.4 | 9.2 | -4.6 | 1.98 |
| 2013 | 4,615,000 | 68,954 | 29,504 | 39,450 | 15.0 | 6.4 | 8.6 | -2.1 | 1.93 |
| 2014 | 4,645,000 | 67,295 | 29,252 | 38,043 | 14.6 | 6.4 | 8.2 | 1.1 | 1.89 |
| 2015 | 4,688,000 | 65,536 | 30,127 | 35,409 | 14.0 | 6.4 | 7.6 | 3.5 | 1.86 |
| 2016 | 4,740,000 | 63,841 | 30,390 | 33,451 | 13.5 | 6.5 | 7.2 | 3.8 | 1.82 |
| 2017 | 4,792,000 | 61,824 | 30,418 | 31,406 | 12.9 | 6.3 | 6.6 | 7.0 | 1.77 |
| 2018 | 4,857,000 | 61,016 | 31,116 | 29,900 | 12.6 | 6.4 | 6.2 | 7.1 | 1.75 |
| 2019 | 4,921,500 | 59,294 | 31,184 | 28,110 | 12.0 | 6.3 | 5.7 | 5.7 | 1.72 |
| 2020 | 4,977,400 | 55,959 | 31,765 | 24,194 | 11.2 | 6.4 | 4.8 | 2.1 | 1.63 |
| 2021 | 5,011,500 | 58,443 | 33,055 | 25,388 | 11.7 | 6.6 | 5.1 | 12.6 | 1.71 |
| 2022c | 5,149,139 | 57,540 | 35,477 | 22,063 | 11.3 | 7.0 | 4.3 | 10.0 | 1.70 |
| 2023 | 5,281,600 | 55,500 | 35,500 | 20,000 | 10.5 | 6.7 | 3.8 | 14.7 |
c = Census results.
Current vital statistics
| Period | Live births | Deaths | Natural increase |
|---|---|---|---|
| January – September 2022 | 44,671 | 27,328 | +17,343 |
| January – September 2023 | 41,263 | 27,273 | +13,990 |
| Difference |
Structure of the population
| Age Group | Male | Female | Total | % |
|---|---|---|---|---|
| Total | 2 272 699 | 2 315 553 | 4 588 252 | 100 |
| 0–4 | 182 076 | 174 253 | 356 329 | 7.77 |
| 5–9 | 164 037 | 156 733 | 320 770 | 6.99 |
| 10–14 | 155 076 | 147 415 | 302 491 | 6.59 |
| 15–19 | 144 262 | 138 757 | 283 019 | 6.17 |
| 20–24 | 146 636 | 150 595 | 297 231 | 6.48 |
| 25–29 | 173 714 | 187 408 | 361 122 | 7.87 |
| 30–34 | 194 774 | 199 171 | 393 945 | 8.59 |
| 35–39 | 182 237 | 182 024 | 364 261 | 7.94 |
| 40–44 | 166 330 | 164 482 | 330 812 | 7.21 |
| 45–49 | 151 516 | 153 669 | 305 185 | 6.65 |
| 50–54 | 136 737 | 137 649 | 274 386 | 5.98 |
| 55–59 | 122 121 | 122 401 | 244 522 | 5.33 |
| 60–64 | 109 869 | 108 917 | 218 786 | 4.77 |
| 65-69 | 86 298 | 87 340 | 173 638 | 3.78 |
| 70-74 | 63 476 | 67 714 | 131 190 | 2.86 |
| 75-79 | 46 631 | 55 405 | 102 036 | 2.22 |
| 80-84 | 28 423 | 41 690 | 70 113 | 1.53 |
| 85-89 | 13 591 | 26 296 | 39 887 | 0.87 |
| 90-94 | 4 155 | 10 722 | 14 877 | 0.32 |
| 95-99 | 682 | 2 581 | 3 263 | 0.07 |
| 100+ | 58 | 331 | 389 | 0.01 |
| Age group | Male | Female | Total | Percent |
| 0–14 | 501 189 | 478 401 | 979 590 | 21.35 |
| 15–64 | 1 528 196 | 1 545 073 | 3 073 269 | 66.98 |
| 65+ | 243 314 | 292 079 | 535 393 | 11.67 |
| Age Group | Male | Female | Total | % |
|---|---|---|---|---|
| Total | 2 477 803 | 2 528 521 | 5 006 324 | 100 |
| 0–4 | 155 762 | 149 311 | 305 073 | 6.09 |
| 5–9 | 173 176 | 164 974 | 338 150 | 6.75 |
| 10–14 | 182 865 | 174 327 | 357 192 | 7.13 |
| 15–19 | 164 643 | 158 528 | 323 171 | 6.46 |
| 20–24 | 156 739 | 151 495 | 308 234 | 6.16 |
| 25–29 | 146 911 | 145 135 | 292 046 | 5.83 |
| 30–34 | 155 831 | 163 136 | 318 967 | 6.37 |
| 35–39 | 181 494 | 197 232 | 378 726 | 7.56 |
| 40–44 | 195 943 | 204 498 | 400 441 | 8.00 |
| 45–49 | 179 647 | 183 297 | 362 944 | 7.25 |
| 50–54 | 160 508 | 161 545 | 322 053 | 6.43 |
| 55–59 | 145 919 | 150 061 | 295 980 | 5.91 |
| 60–64 | 130 499 | 133 847 | 264 346 | 5.28 |
| 65-69 | 112 741 | 115 631 | 228 372 | 4.56 |
| 70-74 | 94 777 | 98 767 | 193 544 | 3.87 |
| 75-79 | 67 518 | 73 623 | 141 141 | 2.82 |
| 80-84 | 40 946 | 50 350 | 91 296 | 1.82 |
| 85-89 | 20 870 | 29 977 | 50 847 | 1.02 |
| 90-94 | 8 151 | 15 395 | 23 546 | 0.47 |
| 95-99 | 2 280 | 5 796 | 8 076 | 0.16 |
| 100+ | 583 | 1 596 | 2 179 | 0.04 |
| Age group | Male | Female | Total | Percent |
| 0–14 | 511 803 | 488 612 | 1 000 415 | 19.98 |
| 15–64 | 1 618 134 | 1 648 774 | 3 266 908 | 65.26 |
| 65+ | 347 866 | 391 135 | 739 001 | 14.76 |
Ethnic groups

| Ethnic Group | Year | |||||||
|---|---|---|---|---|---|---|---|---|
| 2006[16] | 2011[17] | 2016[17][18] | 2022[19] | |||||
| Number | % | Number | % | Number | % | Number | % | |
| White: Total | 3,956,609 | 94.84% | 4,264,465 | 94.24% | 4,331,940 | 92.37% | 4,444,145 | 87.4% |
| White Irish | 3,645,199 | 87.37% | 3,821,995 | 84.46% | 3,854,226 | 82.2% | 3,893,056 | 76.5% |
| Irish Traveller | 22,369 | 0.54% | 29,495 | 0.65% | 30,987 | 0.7% | 32,949 | 0.65% |
| White Roma | - | - | - | - | - | - | 16,059 | 0.31% |
| Other White | 289,041 | 6.93% | 412,975 | 9.13% | 446,727 | 9.5% | 502,081 | 9.87% |
| Asian: Total | 52,345 | 1.25% | 84,690 | 1.87% | 98,720 | 2.10% | 186,321 | 3.7% |
| Chinese | 16,533 | 0.40% | 17,832 | 0.39% | 19,447 | 0.4% | 26,828 | 0.5% |
| Indian/Pakistani/Bangladeshi | - | - | - | - | - | - | 94,434 | 1.86% |
| Arab | - | - | - | - | - | - | 20,115 | 0.4% |
| Other Asian | 35,812 | 0.86% | 66,858 | 1.48% | 79,273 | 1.7% | 44,944 | 0.88% |
| Black: Total | 44,318 | 1.06% | 65,078 | 1.44% | 64,639 | 1.38% | 76,245 | 1.5% |
| Black Irish and Black African | 40,525 | 0.97% | 58,697 | 1.30% | 57,850 | 1.24% | 67,547 | 1.32% |
| Other Black | 3,793 | 0.09% | 6,381 | 0.14% | 6,789 | 0.14% | 8,699 | 0.17% |
| Other including Mixed | - | - | - | - | - | - | 64,992 | 1.28% |
| Not Stated | 118,741 | 2.85% | 111,048 | 2.45% | 194,622 | 3.98% | 313,176 | 6.16% |
| Total: | 4,172,013 | 100% | 4,525,281 | 100% | 4,689,921 | 100% | 5,084,879 | 100% |
- Population pyramids of ethnic groups within Ireland in 2022
 White Irish
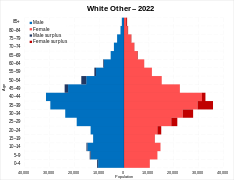 White Other
 Asian: Indian/Pakistani/Bangladeshi
 Asian: Chinese
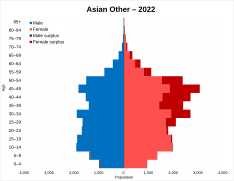 Asian: Other
 Black: Africans
 Black: Other
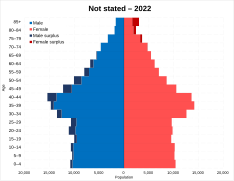 Not Stated


Immigration
Ireland's immigration history (and of one of a multi-ethnic society) is most of that of a country of emigration, remaining exclusively homogeneous for the vast majority of 20th century history, rather than one of net migration and increased ethnic and racial diversity.
However, from the 1990s, with the rise of the 'Celtic Tiger', the nation shifted to one of a net receiver of immigration at a rapid pace,[20][21] changing from one of the most 'homogeneous countries in the EU, to a country with a rate of change almost unparalleled in speed and scale'.[2] The Celtic Tiger economic boom saw a large expansion of the labour market, which contributed to the large increase of immigration towards the country, with the additional enlargement of the European Union in 2004 and the further 2007 enlargement contributing to increased levels of immigration.
Additionally, asylum seekers rose dramatically as well: from 364 in 1994 to 11,634 in 2002, before falling off towards the end of the decade.[20] The Irish Government amended legislation in 2023 with the intention of streamlining the naturalisation process.[22][23]
- Net migration rate: 6.8 migrant(s)/1,000 population (2023 est.)[24]
- Country comparison to the world: 13th
Nationalities
Ireland contains several immigrant communities, especially in Dublin and other cities across the country. The largest immigrant groups, with over 10,000 people, being Poles, British, Indians, Romanians, Lithuanians, Brazilians, Italians, Latvians, Spaniards, French, Croats, Americans, Chinese, Germans and Ukrainians.
| Citizenship[fn 2] | 2016[19] | 2022[19] | ||
|---|---|---|---|---|
| Number | % | Number | % | |
| Total Irish | 4,082,513 | 87% | 4,283,490 | 84% |
| Irish | 3,977,729 | 85% | 4,112,893 | 81% |
| Dual Irish | 104,784 | 2% | 170,597 | 3% |
| None/Other | 607,408 | 13% | 801,389 | 15% |
| Non-Irish | 535,475 | 11% | 631,785 | 12% |
| None/not stated | 71,933 | 2% | 169,604 | 3% |
| Total | 4,689,921 | 100% | 5,084,879 | 100% |
| Nationality | Population (2022)[25] |
|---|---|
  Poland Poland | 93,680 |
 United Kingdom United Kingdom | 83,347 |
 India India | 45,449 |
 Romania Romania | 43,323 |
 Lithuania Lithuania | 31,177 |
 Brazil Brazil | 27,338 |
 Italy Italy | 18,319 |
 Latvia Latvia | 18,300 |
 Spain Spain | 17,953 |
 France France | 13,893 |
 Croatia Croatia | 13,649 |
 United States United States | 13,412 |
 China China | 13,050 |
 Germany Germany | 12,390 |
 Ukraine Ukraine | 11,791 |
 Hungary Hungary | 9,336 |
 Pakistan Pakistan | 9,309 |
 Slovakia Slovakia | 8,600 |
| Hungary | 8,503 |
 Nigeria Nigeria | 8,368 |
 Portugal Portugal | 8,310 |
 South Africa South Africa | 8,250 |
 Philippines Philippines | 7,736 |
 Netherlands Netherlands | 4,670 |
 Czech Republic Czech Republic | 4,530 |
 Bulgaria Bulgaria | 3,994 |
 Canada Canada | 3,528 |
 Australia Australia | 3,481 |
 Malaysia Malaysia | 3,407 |
 Syria Syria | 3,267 |
 Moldova Moldova | 3,119 |
Nationality of mothers
Of the 57,540 births in 2022, there were 43,651 babies (76%) born to mothers of Irish nationality compared to 45,381 (78%) in 2021. There were 8.3% of births to mothers of EU15 to EU27 nationality, 1.9% of mothers were of UK nationality, and 2.3% were of EU14 nationality (excluding Ireland). Mothers of nationalities other than Ireland, UK and the EU accounted for 12% of total births registered. There were 0.01% of mothers where the nationality was not stated.[26]
Country of birth
In 2022, 20% of the usually resident population in Ireland were born elsewhere, an increase of 3% since 2016. This represented 1,017,437 people, an increase of 207,031 from six years previously.
| Country | 1986 | 1991 | 1996 | 2002 | 2006 | 2011 | 2016 | 2022 |
|---|---|---|---|---|---|---|---|---|
  England and Wales England and Wales | 128,668 | 126,487 | 139,330 | 182,624 | 200,488 | 212,296 | 203,188 | 210,434 |
| Poland | − | − | − | 2,167 | 62,495 | 115,193 | 115,161 | 106,142 |
| Northern Ireland | 36,538 | 35,986 | 39,567 | 49,928 | 49,171 | 58,470 | 57,389 | 61,750 |
| India | − | − | − | 3,402 | 9,192 | 17,856 | 20,969 | 56,624 |
| Romania | − | − | − | 5,838 | 8,492 | 17,995 | 28,702 | 42,460 |
| Brazil | − | − | − | 1,232 | 4,666 | 9,298 | 15,796 | 39,556 |
| Lithuania | − | − | − | 2,120 | 24,611 | 34,847 | 33,344 | 34,242 |
| United States | 15,350 | 14,533 | 15,619 | 21,541 | 24,643 | 27,762 | 28,650 | 34,236 |
| Nigeria | − | − | − | 9,225 | 16,327 | 19,780 | 16,569 | 20,559 |
| Latvia | − | − | − | 2,281 | 13,854 | 19,989 | 18,991 | 20,330 |
| Philippines | − | − | − | 4,086 | 9,427 | 13,833 | 14,725 | 19,846 |
| Spain | 1,113 | 1,801 | 2,104 | 4,632 | 6,122 | 7,003 | 11,809 | 18,356 |
 Scotland Scotland | 12,586 | 11,378 | 11,751 | 15,963 | 16,488 | 17,871 | 16,644 | 16,869 |
| Moldova | − | − | − | 1,032 | 2,233 | 3,421 | 6,472 | 16,155 |
| China | − | − | − | 5,669 | 11,022 | 11,458 | 11,262 | 16,425 |
| South Africa | − | − | − | 6,260 | 7,576 | 8,116 | 8,085 | 15,886 |
| Italy | 1,314 | 1,507 | 1,844 | 3,705 | 5,705 | 7,146 | 10,913 | 15,689 |
| Ukraine | − | − | − | 1,485 | 3,367 | 4,123 | 4,624 | 15,678 |
| Pakistan | − | − | − | 3,391 | 5,757 | 8,329 | 12,891 | 15,185 |
| France | 2,460 | 4,512 | 3,593 | 6,794 | 9,145 | 10,081 | 11,924 | 14,821 |
| Germany | 3,853 | 5,792 | 6,343 | 8,770 | 11,544 | 12,980 | 12,964 | 14,789 |
| Croatia | − | − | − | − | − | 980 | 5,202 | 12,743 |
| Slovakia | − | − | − | − | 8,129 | 9,537 | 9,443 | 10,695 |
| Australia | − | − | − | 6,107 | 6,478 | 5,964 | 6,748 | 9,947 |
| Hungary | − | − | − | 3,285 | 8,129 | 7,413 | 8,648 | 8,634 |
 Russia Russia | − | − | − | 2,556 | 4,511 | 5,936 | 6,414 | 7,900 |
| Canada | − | − | − | 4,081 | 4,492 | 4,809 | 5,314 | 7,122 |
| Portugal | 124 | 147 | 192 | 590 | 1,496 | 2,246 | 3,866 | 5,987 |
| Netherlands | 1,888 | 1,985 | 2,490 | 3,512 | 4,211 | 4,499 | 4,729 | 5,376 |
 Zimbabwe Zimbabwe | − | − | − | 1,462 | 2,230 | 2,790 | 2,811 | 5,246 |
| Czech Republic | − | − | − | − | 5,230 | 5,494 | 4,936 | 5,092 |
| Malaysia | − | − | − | 2,195 | 3,340 | 3,782 | 4,016 | 4,864 |
| Bulgaria | − | − | − | − | − | 1,783 | 2,911 | 4,585 |
 Bangladesh Bangladesh | − | − | − | − | 1,924 | 2,920 | 3,410 | 4,388 |
 Turkey Turkey | − | − | − | − | − | 1,301 | 1,607 | 4,086 |
| Syria | − | − | − | − | − | 308 | 920 | 3,922 |
 Egypt Egypt | − | − | − | − | − | 1,437 | 1,866 | 3,452 |
 Mexico Mexico | − | − | − | − | − | 889 | 1,476 | 3,364 |
Support and accommodation
Migrants are supported/represented by the Immigrant Council of Ireland, Irish Refugee Council, Movement of Asylum Seekers in Ireland, Nasc and the state's Irish Naturalisation and Immigration Service.[28][29][30] They are managed by the International Protection Accommodation Service under the Department of Children, Equality, Disability, Integration and Youth (DCEDIY) as well being policed by the Garda National Immigration Bureau.[31] Some minor parties have voiced opposition to immigration in the country and its capability to continue to let refugees in; that "Ireland is full". They include the National Party and the Irish Freedom Party.[32][33] The DCEDIY projected a shortfall of 15,000 beds for refugees in December 2022 and admitted that there was mounting pressure to house 65,000 people.[34][35]
Approximately 7,400 refugee adults and children[36] were projected to be living in 38 "direct provision" centres across 17 counties in Ireland by the end of April 2020.[37] The government of Ireland have said that they project to end direct provision by 2024[38] and are looking towards alternative forms of accommodation.
Religion
Religions in Ireland (2022)[39]
Ireland is a predominantly Christian country. The majority are Catholic; however, the number of people who declare themselves Catholic has been declining in recent years. Irreligion has increased since 2016 with 14% declaring 'No Religion' in 2022, meaning this is the second largest religious affiliation in Ireland. Immigration has also brought other faiths, with Islam at 1.7%, or over 83,000 people. As well as Hinduism, with 33,043 Hindus in the state, an increase of over 250% from 2016.
Languages
English is the most commonly used language, with 84%[40] of the population calling it their mother tongue. Irish is the first official language of the state, with 11%[40] calling it their mother tongue. Irish is the main language of the Gaeltacht regions, where 102,973 people lived as of 2022. The main sign language used is Irish Sign Language.
Education
Literacy rate; definition: age 15 and over who can read and write
- total population: 99%
- male: 99%
- female: 99% (2003 est.)
School life expectancy (primary to tertiary education); total: 19 years
- male: 19 years
- female: 19 years (2016)
Employment and income
For November 2022 the seasonally adjusted unemployment rate was:
Unchanged at 4.3% for males from October 2022, and down from 5.3% in November 2021.
Unchanged at 4.6% for females from October 2022, and down from 5.2% in November 2021.
Unchanged at 12.1% for persons aged 15–24 years (youth unemployment rate) from a revised rate of 12.1% in October 2022.
Down to 3.3% for persons aged 25–74 years from 3.4% in October 2022.[41]
The median household disposable income in 2020 was €46,471, an increase of €2,556 (+5.8%) from the previous year. Disposable household income is gross household income less total tax, social insurance contributions, pension contributions and inter-household transfers paid.[42]
See also
- Demographics of Northern Ireland
- 2011 census of Ireland
- 2016 census of Ireland
- Historical population of Ireland
- Irish diaspora
- Stamp 4
Groups: