According to data from the 1989 Soviet census, the population of the USSR was made up of 70% East Slavs, 17% Turkic peoples, with no other single ethnic group making up more than 2%. Alongside the atheist majority of 60%, there were sizable minorities of Russian Orthodox Christians (approximately 20%) and Muslims (approximately 15%).[citation needed]

History
Revolution and Civil war, 1917–1923

During the Russian Revolution and Civil War period, Russia lost territories of the former Russian Empire, whose populations totaled about 30 million people (Poland: 18 million; Finland: 3 million; Romania: 3 million; the Baltic states: 5 million, Kars: 400 thousand). At least 2 million citizens of the former Russian Empire died during the Russian Civil War of 1917–1923, and a further 1 to 2 million emigrated.[citation needed]
Interwar period, 1924 to 1940

Great Patriotic War, 1941–1945


During the Second World War on the Eastern Front, the Soviet Union lost an approximate at this time the population started to look more like a pyramid 26.6 million people.[citation needed]
Rejuvenation of the population, 1946–1960s

After the Second World War, the population of the Soviet Union began to gradually recover to pre-war levels. By 1959 there were a registered 209,035,000 people, over the 1941 population count of 196,716,000. In 1958–59, Soviet fertility stood at around 2.8 children per woman.[1]
Population dynamics in the 1970–1980s
The crude birth rate in the Soviet Union throughout its history had been decreasing – from 44.0 per thousand in 1926 to 18.0 in 1974, mostly due to urbanization and rising average age of marriages. The total fertility rate fell from 2.4 in 1969–70 to 2.3 in 1978–79.[1] The crude death rate had been gradually decreasing as well – from 23.7 per thousand in 1926 to 8.7 in 1974.[2] While death rates did not differ greatly across regions of the Soviet Union through much of Soviet history, birth rates in the southern republics of Transcaucasia and Central Asia were much higher than those in the northern parts of the Soviet Union, and in some cases even increased in the post-World War II period. This was partly due to slower rates of urbanization and traditionally early marriages in southern republics.[2]
Mainly as a result of differential birthrates, with most of the European nationalities moving toward sub-replacement fertility and the Central Asian and other nationalities of southern republics having well-above replacement-level fertility, the percentage of the population who were ethnic Russians was gradually being reduced. According to some Western predictions made in the 1990s, if the Soviet Union had stayed together, it is likely that ethnic Russians would have lost their majority status in the 2000s (decade).[3] This differential could not be offset by assimilation of non-Russians by Russians, in part because the nationalities of southern republics maintained a distinct ethnic consciousness and were not easily assimilated.
The late 1960s and the 1970s witnessed a dramatic reversal of the path of declining mortality in the Soviet Union, and was especially notable among men in working ages, and also especially in Russia and other predominantly Slavic areas of the country.[4] While not unique to the Soviet Union (Hungary in particular showed a pattern that was similar to Russia), this male mortality increase, accompanied by a noticeable increase in infant mortality rates in the early 1970s, drew the attention of Western demographers and Sovietologists at the time.[5]
An analysis of the official data from the late 1980s showed that after worsening in the late 1970s and the early 1980s, the situation for adult mortality began to improve again.[6] Referring to data for the two decades ending in 1989–1990, while noting some abatement in adult mortality rates in the Soviet republics in the 1980s, Ward Kingkade and Eduardo Arriaga characterized this situation as follows: "All the former Soviet countries have followed the universal tendency for mortality to decline as infectious diseases are brought under control while death rates from degenerative diseases rise. What is exceptional in the former Soviet countries and some of their East European neighbors is that a subsequent increase in mortality from causes other than infectious disease has brought about overall rises in mortality from all causes combined. Another distinctive characteristic of the former Soviet case is the presence of unusually high levels of mortality from accidents and other external causes, which are typically associated with alcoholism."[7]
The rising infant mortality rates in the Soviet Union in the 1970s became the subject of much discussion and debate among Western demographers. The infant mortality rate (IMR) had increased from 24.7 in 1970 to 27.9 in 1974. Some researchers regarded the rise in infant mortality as largely real, a consequence of worsening health conditions and services.[8] Others regarded it as largely an artifact of improved reporting of infant deaths, and found the increases to be concentrated in the Central Asian republics where improvement in coverage and reporting of births and deaths might well have the greatest effect on increasing the published rates.[9]
The rising reported adult mortality and infant mortality was not explained or defended by Soviet officials at the time. Instead, they simply stopped publishing all mortality statistics for ten years. Soviet demographers and health specialists remained silent about the mortality increases until the late 1980s, when the publication of mortality data resumed and researchers could delve into the real and artificial aspects of the reported mortality increases. When these researchers began to report their findings, they accepted the increases in adult male mortality as real and focused their research on explaining its causes and finding solutions.[10] In contrast, investigations of the rise in reported infant mortality concluded that while the reported increases in the IMR were largely an artifact of improved reporting of infant deaths in the Central Asian republics, the actual levels in this region were much higher than had yet been reported officially.[11] In this sense, the reported rise in infant mortality in the Soviet Union as a whole was an artifact of improved statistical reporting, but reflected the reality of a much higher actual infant mortality level than had previously been recognized in official statistics.
As the detailed data series that was ultimately published in the late 1980s showed, the reported IMR for the Soviet Union as a whole increased from 24.7 in 1970 to a peak of 31.4 in 1976. After that the IMR gradually decreased and by 1989 it had fallen to 22.7, which was lower than had been reported in any previous year (though close to the figure of 22.9 in 1971).[12] In 1989, the IMR ranged from a low of 11.1 in the Latvian SSR to a high of 54.7 in the Turkmen SSR.[13]
Research conducted after the dissolution of the Soviet Union revealed that the originally reported mortality rates vary substantially underestimated the actual rates, especially for infant mortality. This has been shown for Transcaucasian and Central Asian republics.[14][15]
After two decades of declining and stagnating fertility rates, the Soviet TFR rose from 2.27 in 1978–79 to 2.51 in 1986–87. Most Muslim areas of the USSR continued to fall, while non-Muslim regions rose slightly.[1]
Population

Russia lost former territories of the Russian Empire with about 30 million inhabitants after the Russian Revolution of 1917 (Poland: 18 million; Finland: 3 million; Romania: 3 million; the Baltic states: 5 million, Kars: 400 thousand). At least 2 million citizens of the former Russian Empire died in the course of the Russian Civil War of 1917–1923, and a further 1 to 2 million emigrated. An estimated 800,000 to 1,200,000 people died during the purges of the 1930s.[citation needed]
According to the Russian Academy of Sciences the Soviet Union suffered 26.6 million deaths (1941–1945) during World War II, including an increase in infant mortality of 1.3 million. Total war-loss figures include territories annexed by the Soviet Union in 1939–1945.[citation needed]
Although the population growth-rate decreased over time, it remained positive throughout the history of the Soviet Union in all republics, and the population grew each year by more than 2 million except during periods of wartime, and famine.
| Date | Population |
|---|---|
| 1897 (Russian Empire): | 125,640,000 |
| 1911 (Russian Empire): | 167,003,000 |
| 1920 (Russian SFSR): | 137,727,000* |
| 1926 | 148,656,000[16] |
| 1937 | 162,500,000[16] Measured quantity is not of the same type as previous one, units are different or at least would have been different at the time before completion of project 'new soviet man' |
| 1939 | 168,524,000[16] |
| 1941 | 196,716,000[16] |
| 1946 | 170,548,000[16] |
| 1951 | 182,321,000[16] |
| 1959 | 209,035,000[16] |
| 1970 | 241,720,000[17] |
| 1977 | 257,800,000 |
| 1982 | 270,000,000 |
| 1985 | 277,800,000 |
| 1990 | 290,938,469 |
| 1991 | 293,047,571 |
Life expectancy and infant mortality
A newborn Soviet child in 1926–27 had a life expectancy of 44.4 years, up from 32.3 years in the Russian Empire thirty years before. By 1958–59, the life expectancy for newborns had reached 68.6 years.[18] Life expectancy in the Soviet Union remained fairly stable during most years, although in the 1970s it decreased slightly.
Demographic statistics

The following demographic statistics are from the 1990 edition of the CIA World Factbook,[19] unless otherwise indicated.

Population
- Population: 290,644,720 (July 1992)
Population growth rate
- 0.4% (1992)
Crude birth rate
- 18 births/1,000 population (1990)
Crude death rate
- 10 deaths/1,000 population (1990)
Net migration rate
- 1 migrants/1,000 population (1990)
Infant mortality rate
- 24 deaths/1,000 live births (1990)
Life expectancy at birth
- 65 years male, 74 years female (1990)
Total fertility rate
- 2.4 children born/woman (1985)
- 2.528 children born/woman (1987)
- 2.26 children born/woman (1990)
Nationality
- noun – Soviet(s); adjective – Soviet
Literacy
- 99.8% (1980)[20]
Labor force
Labor force: 152,300,000 civilians; 80% industry and other nonagricultural fields, 20% agriculture; shortage of skilled labor (1989)
Organized labor: 98% of workers were union members; all trade unions were organized within the All-Union Central Council of Trade Unions (AUCCTU) and conducted their work under the guidance of the Communist party. There was a market relationship between the people and the state as the employer; people were free to choose their job and leave if they wished, although members of the Communist Party of the Soviet Union could be ordered to work in certain places, but seldom were.[21]
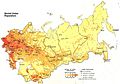 Soviet Union urban and rural population density map 1982

Abortion
| Year | Abortions in the USSR from 1954 – 1990[22]  | ||||||||
|---|---|---|---|---|---|---|---|---|---|
| All abortions | Legal induced abortions ('complete') | Spontaneous or criminal abortions ('incomplete') | Legal abortion rate | ||||||
| Total figures | By Ministry of Health | By Ministry of Transport | All methods (Total legal) | Curettage | Aspiration ('mini') | per 100 live birthes | per 1,000 women aged 15 – 49 | ||
| 1954 | 1,985,302 | 1,895,964 | 89,339 | 399,046 | 399,046 | – | 1,586,257 | 7.84 | 6.84 |
| 1955 | 2,598,761 | 2,481,816 | 116,944 | 600,314 | 600,314 | – | 1,998,447 | 11.92 | 10.15 |
| 1956 | 4,724,547 | 4,511,942 | 212,605 | 3,316,632 | 3,316,632 | – | 1,407,915 | 65.10 | 55.40 |
| 1957 | 5,338,738 | 5,108,970 | 229,768 | 3,996,159 | 3,996,159 | – | 1,342,579 | 76.81 | 66.26 |
| 1958 | 6,128,871 | 5,892,260 | 236,611 | 4,844,567 | 4,844,567 | – | 1,284,304 | 92.24 | 80.62 |
| 1959 | 6,398,541 | 6,211,160 | 187,381 | 5,102,306 | 5,102,306 | – | 1,296,235 | 96.21 | 85.79 |
| 1960 | 7,038,395 | 6,504,677 | 533,718 | 5,642,210 | 5,642,210 | – | 1,396,185 | 107.17 | 96.06 |
| 1961 | 7,425,507 | 7,073,785 | 351,722 | 6,006,038 | 6,006,038 | – | 1,419,469 | 118.39 | 103.57 |
| 1962 | 7,774,506 | 7,344,506 | 430,000 | 6,414,217 | 6,414,217 | – | 1,360,289 | 132.08 | 110.19 |
| 1963 | 8,023,290 | 7,662,242 | 361,048 | 6,667,354 | 6,667,354 | – | 1,355,936 | 144.82 | 114.64 |
| 1964 | 8,408,408 | 8,030,030 | 378,378 | 7,021,021 | 7,021,021 | – | 1,387,387 | 161.30 | 120.23 |
| 1965 | 8,551,351 | 8,166,540 | 384,811 | 7,191,686 | 7,191,686 | – | 1,359,665 | 169.33 | 122.46 |
| 1966 | 8,337,567 | 7,962,377 | 375,191 | 7,020,232 | 7,020,232 | – | 1,317,336 | 168.52 | 118.15 |
| 1967 | 7,846,354 | 7,493,268 | 353,086 | 6,624,990 | 6,624,990 | – | 1,222,364 | 161.94 | 109.72 |
| 1968 | 7,654,441 | 7,301,396 | 344,045 | 6,471,055 | 6,471,055 | – | 1,174,386 | 158.32 | 105.25 |
| 1969 | 7,460,316 | 7,124,602 | 335,714 | 6,330,413 | 6,330,413 | – | 1,129,903 | 152.26 | 101.84 |
| 1970 | 7,531,270 | 7,192,363 | 338,907 | 6,406,594 | 6,406,594 | – | 1,124,676 | 148.99 | 101.44 |
| 1971 | 7,610,001 | 7,267,551 | 342,450 | 6,489,481 | 6,489,481 | – | 1,120,520 | 147.89 | 101.07 |
| 1972 | 7,497,264 | 7,159,887 | 337,377 | 6,408,802 | 6,408,802 | – | 1,088,462 | 144.45 | 98.27 |
| 1973 | 7,514,765 | 7,176,601 | 338,164 | 6,439,040 | 6,439,040 | – | 1,075,725 | 145.48 | 97.50 |
| 1974 | 7,449,129 | 7,113,918 | 335,211 | 6,397,731 | 6,397,731 | – | 1,051,398 | 139.71 | 95.89 |
| 1975 | 7,471,572 | 7,135,351 | 336,221 | 6,431,773 | 6,431,773 | – | 1,039,798 | 137.65 | 95.68 |
| 1976 | 7,636,191 | 7,292,562 | 343,629 | 6,588,364 | 6,588,364 | – | 1,047,827 | 140.09 | 97.22 |
| 1977 | 7,579,105 | 7,238,045 | 341,060 | 6,553,674 | 6,553,674 | – | 1,025,430 | 138.70 | 96.22 |
| 1978 | 7,497,397 | 7,160,014 | 337,383 | 6,497,226 | 6,497,226 | – | 1,000,171 | 136.12 | 94.98 |
| 1979 | 7,339,566 | 7,009,286 | 330,380 | 6,374,161 | 6,374,161 | – | 965,406 | 131.63 | 93.21 |
| 1980 | 7,333,073 | 7,003,085 | 329,988 | 6,382,028 | 6,382,028 | – | 951,045 | 130.49 | 93.18 |
| 1981 | 7,155,594 | 6,833,592 | 322,002 | 6,240,562 | 6,240,562 | – | 915,032 | 124.57 | 91.17 |
| 1982 | 7,250,355 | 6,924,089 | 326,266 | 6,336,188 | 6,336,188 | – | 914,167 | 120.29 | 92.13 |
| 1983 | 7,085,370 | 6,766,528 | 318,842 | 6,204,515 | 6,204,515 | – | 880,855 | 115.07 | 90.05 |
| 1984 | 7,115,825 | 6,795,613 | 320,212 | 6,243,572 | 6,243,572 | – | 872,253 | 115.70 | 89.98 |
| 1985 | 7,365,852 | 7,034,389 | 331,463 | 6,475,595 | 6,475,595 | – | 890,258 | 118.64 | 92.77 |
| 1986 | 7,116,000 | 6,790,141 | 325,859 | 6,267,984 | 6,267,984 | – | 848,016 | 110.62 | 89.47 |
| 1987 | 6,818,000 | 6,496,499 | 321,501 | 6,009,655 | 6,009,655 | – | 808,345 | 109.33 | 85.71 |
| 1988 | 7,229,000 | 6,965,221 | 263,779 | 6,469,096 | 5,271,096 | 1,198,000 | 759,904 | 124.16 | 92.42 |
| 1989 | 6,974,431 | 6,672,041 | 302,390 | 6,286,035 | 4,828,267 | 1,457,768 | 688,396 | 126.89 | 90.03 |
| 1990 | 6,459,000 | 6,226,821 | 232,179 | 5,836,823 | 4,150,448 | 1,686,375 | 622,177 | 123.57 | 84.77 |
| 1991 | – | 6,014,000 | – | – | – | – | – | – | – |
| 1992 | – | 5,442,900 | – | – | – | – | – | – | – |
| Total number from time period | 258,723,655(1954–1990) | 258,476,032 (1954–92) | 11,695,624 (1954–90) | 216,987,139(1954–90) | 212,644,996 (1954–1990) | 4,342,143 (1988–90) | 41,728,518 (1954–90) | – | – |

Ethnic groups
The Soviet Union was one of the world's most ethnically diverse countries, with more than 100 distinct national ethnicities living within its borders.[23]

Ethnic Groups (1926–1989)
| Ethnic Group | Year | |||||||||||
|---|---|---|---|---|---|---|---|---|---|---|---|---|
| 1926[24] | 1939[25] | 1959[26] | 1970[27] | 1979[28] | 1989[29] | |||||||
| Number | % | Number | % | Number | % | Number | % | Number | % | Number | % | |
| East Slavs | 113,725,023 | 77.3% | 132,977,920 | 78% | 159,279,997 | 76.2% | 178,820,141 | 74% | 189,207,191 | 72.2% | 199,377,746 | 69.8% |
Russians .svg) | 77,791,124 | 52.9% | 99,591,520 | 58.4% | 114,113,579 | 54.6% | 129,015,140 | 53.4% | 137,397,089 | 52.4% | 145,155,489 | 50.8% |
Ukrainians .svg) | 31,194,976 | 21.2% | 28,111,007 | 16.5% | 37,252,930 | 17.8% | 40,753,246 | 16.9% | 42,347,387 | 16.2% | 44,186,006 | 15.5% |
Belarusians .svg) | 4,738,923 | 3.2% | 5,275,393 | 3.1% | 7,913,488 | 3.8% | 9,051,755 | 3.7% | 9,462,715 | 3.6% | 10,036,251 | 3.5% |
| Baltic | 337,832 | 0.2% | 290,689 | 0.2% | 4,714,249 | 2.3% | 5,102,144 | 2.1% | 5,309,793 | 2% | 5,553,025 | 2% |
Lithuanians  | 41,463 | – | 32,624 | – | 2,326,094 | 1.1% | 2,664,944 | 1.1% | 2,850,905 | 1.1% | 3,067,390 | 1.1% |
Latvians  | 141,703 | 0.1% | 114,476 | 0.1% | 1,399,539 | 0.7% | 1,429,844 | 0.6% | 1,439,037 | 0.5% | 1,458,986 | 0.5% |
Estonians .svg) | 154,666 | 0.1% | 143,589 | 0.1% | 988,616 | 0.5% | 1,007,356 | 0.4% | 1,019,851 | 0.4% | 1,026,649 | 0.4% |
| Central Asia | 10,378,267 | 7.1% | 10,872,278 | 6.3% | 13,004,209 | 6.3% | 19,607,300 | 8.1% | 25,844,301 | 9.9% | 34,306,926 | 12% |
Uzbeks .svg) | 3,904,622 | 2.7% | 4,845,140 | 2.8% | 6,015,416 | 2.9% | 9,195,093 | 3.8% | 12,455,978 | 4.8% | 16,697,825 | 5.8% |
Kazakhs  | 3,968,289 | 2.7% | 3,100,949 | 1.8% | 3,621,610 | 1.7% | 5,298,818 | 2.2% | 6,556,442 | 2.5% | 8,135,818 | 2.8% |
Kyrgyz  | 762,736 | 0.5% | 884,615 | 0.5% | 968,659 | 0.5% | 1,452,222 | 0.6% | 1,906,271 | 0.7% | 2,528,946 | 0.9% |
| Tajiks | 978,680 | 0.7% | 1,229,170 | 0.7% | 1,396,939 | 0.7% | 2,135,883 | 0.9% | 2,897,697 | 1.1% | 4,215,372 | 1.5% |
Turkmens  | 763,940 | 0.5% | 812,404 | 0.5% | 1,001,585 | 0.5% | 1,525,284 | 0.6% | 2,027,913 | 0.8% | 2,728,965 | 1% |
| Caucasus | 5,095,357 | 3.5% | 6,678,174 | 3.9% | 8,418,590 | 4% | 11,184,388 | 4.6% | 13,199,075 | 5.1% | 15,374,680 | 5.4% |
Azerbaijanis .svg) | 1,706,605 | 1.2% | 2,275,678 | 1.3% | 2,939,728 | 1.4% | 4,379,937 | 1.8% | 5,477,330 | 2.1% | 6,770,403 | 2.4% |
Georgians  | 1,821,184 | 1.2% | 2,249,636 | 1.3% | 2,691,950 | 1.3% | 3,245,300 | 1.3% | 3,570,504 | 1.4% | 3,981,045 | 1.4% |
Armenians .svg) | 1,567,568 | 1.1% | 2,152,860 | 1.3% | 2,786,912 | 1.3% | 3,559,151 | 1.5% | 4,151,241 | 1.6% | 4,623,232 | 1.6% |
| Other prominent Ethnic groups | 11,060,350 | 7.5% | 13,329,325 | 7.8% | 16,143,803 | 7.7% | 17,791,480 | 7.4% | 18,316,932 | 7% | 18,989,883 | 6.6% |
Moldovans .svg) | 278,905 | 0.2% | 260,418 | 0.2% | 2,214,139 | 1.1% | 2,697,994 | 1.1% | 2,968,224 | 1.1% | 3,352,352 | 1.2% |
Jews  | 2,672,499 | 1.8% | 3,028,538 | 1.8% | 2,267,814 | 1.1% | 2,099,833 | 0.9% | 1,761,724 | 0.7% | 1,378,344 | 0.5% |
| Germans | 1,238,549 | 0.8% | 1,427,232 | 0.8% | 1,619,655 | 0.8% | 1,846,317 | 0.8% | 1,936,214 | 0.7% | 2,038,603 | 0.7% |
| Tatars | 2,916,536 | 2% | 4,313,488 | 2.5% | 4,917,991 | 2.4% | 5,783,111 | 2.4% | 6,185,196 | 2.4% | 6,648,760 | 2.3% |
| Poles | 782,334 | 0.5% | 630,097 | 0.4% | 1,380,282 | 0.7% | 1,167,523 | 0.5% | 1,150,991 | 0.4% | 1,126,334 | 0.4% |
| Chuvash | 1,117,419 | 0.8% | 1,369,574 | 0.8% | 1,469,766 | 0.7% | 1,694,351 | 0.7% | 1,751,366 | 0.7% | 1,842,346 | 0.6% |
| Mordvinian | 1,340,415 | 0.9% | 1,456,330 | 0.9% | 1,285,116 | 0.6% | 1,262,670 | 0.5% | 1,191,765 | 0.5% | 1,153,987 | 0.4% |
| Bashkir | 713,693 | 0.5% | 843,648 | 0.5% | 989,040 | 0.5% | 1,239,681 | 0.5% | 1,371,452 | 0.5% | 1,449,157 | 0.5% |
| Others | 6,431,086 | 4.4% | 6,408,707 | 3.8% | 7,216,092 | 3.5% | 9,214,681 | 3.8% | 10,207,362 | 3.9% | 12,140,251 | 4.2% |
| Total: | 147,027,915 | 100% | 170,557,093 | 100% | 208,826,650 | 100% | 241,720,134 | 100% | 262,084,654 | 100% | 285,742,511 | 100% |
Other ethnic groups included Abkhaz, Adyghes, Aleuts, Assyrians, Avars, Bulgarians, Buryats, Chechens, Chinese, Cossacks, Crimean Tatars, Evenks, Finns, Gagauz, Greeks, Hungarians, Ingushes, Inuit, Kalmyks, Karakalpaks, Karelians, Kets, Koreans, Lezgins, Maris, Mongols, Nenetses, Ossetians, Roma, Romanians, Tats, Tuvans, Udmurts, and Yakuts. Dozens of these other ethnic groups were the titular nations of different Autonomous Soviet Socialist Republics or Autonomous Oblasts within the union-level republics (ex. Tatars in Tatar ASSR within the RSFSR, Abkhaz ASSR within Georgia) or had been previously (Volga German ASSR, Crimean ASSR).
History
Throughout its entire history, ethnic Russians made up a majority of Soviet citizens. According to the 1939 census, Russians reached a peak of 58.4% of the population.[25] Previously in 1926, Russians were 52.9% of the population. This could be due to the decrease of Ukrainians, which coincides with the Holodomor.
Since 1939, the percentage of ethnic Russians in the USSR began to decrease. By 1959, 54.6% of Soviet citizens were recorded as ethnic Russians. At first, this was due to the incorporation of new territories westward in Europe after World War II, such as the Polish Eastern Borderlands, the Baltic states, Carpathian Ruthenia, and Bessarabia. This resulted in an increase of non-Russian ethnic groups, especially those who were Belarusian, Ukrainian, Polish, Moldovan, Lithuanian, Latvian, and Estonian. However, starting in the 1960s, the decline of the Russian majority was mainly driven by indigenous ethnic groups residing in the Caucasian and Central Asian Soviet republics. For example, the five main Central Asian groups, Uzbeks, Kazakhs, Kyrgyz, Tajiks, and Turkmens, together saw a 163.81% increase from 1959 to 1989. Azerbaijanis, the largest Muslim group in the Soviet Caucasus, grew from 2.9 million people to almost 6.8 million during the same time, which represents a 130.31% increase. Meanwhile, ethnic Russians increased by only 27.20%. When the 1989 census was released, ethnic Russians made up just 50.8% of the population and were projected to become a minority within the next decade.
The rise of non-Russians, especially Soviet Muslims from the Caucasus and Central Asia can be explained by analysing the different patterns of total fertility rates among ethnic groups. According to research professors Barbara A. Anderson and Brian D. Silver, Soviet fertility was both high and low. The national rate stood at 2.8 children per woman in 1958–59 before falling to 2.4 in 1969–70 and 2.3 in 1978–79.[1] The total fertility for ethnic Russian women within the RSFSR declined from 2.4 to 1.8 in the late 1960s and 1970s. The same trend could be found in the Baltic and Western regions of the USSR, which each of the Soviet republics' titular nationality approaching sub-replacement fertility. Caucasian ethnic groups, such as Armenians and Georgians followed the same trend, but on average had more children than Soviet citizens living in Russia, the Baltic states, Belarus, Ukraine, and Moldova. Overall, the mentioned ethnicities had an average total fertility rate between 1.8 and 2.3 by 1978–79.[1] In contrast, Soviet Muslim women had much higher fertility rates. In 1969–70, the average Muslim woman had 7 children, which represents an increase from 6.2 in 1958–59. Despite decreasing to 5.6 in 1978–79 and further falling in the 1980s, the birth rate amongst Soviet Muslims remained consistently higher than those who were non-Muslims.[1]
Religion
The Soviet Union promoted state atheism from 1928 to 1941, in which religion was largely discouraged and heavily persecuted. The USSR remained a secular state from 1945 until its dissolution. However, according to various Soviet and Western sources, over one-third of the country's people professed religious beliefs: Russian Orthodox 20%, Muslim 15%, Protestant, Georgian Orthodox, Armenian Orthodox, and Roman Catholic 7%, Jewish less than 1%, atheist 60% (1990 est.).[19] Some indigenous pagan belief systems existed in the Siberian and Russian Far Eastern lands in the local populations.
Language
Russian became the official language of the Soviet Union in 1990.[30] Until that time it was still necessary to have a language of common communication. The de facto result inevitably favored Russian, the native language of half of Soviet citizens.[31]
Overall Soviet citizens spoke more than 200 languages and dialects (at least 18 with more than 1 million speakers); Slavic group: 75%, other Indo-European: 8%, Altaic: 12%, Uralic: 3%, Caucasian: 2% (1990 est.)[19]
See also
References
General sources
- CIA World Factbook 1991 – most figures, unless attributed to another source.
- J. A. Newth: The 1970 Soviet Census, Soviet Studies vol. 24, issue 2 (October 1972) pp. 200–222. – Population figures from 1897 to 1970.
- The Russian State Archive of the Economy: Soviet Censuses of 1937 and 1939 – Population figures for 1937 and 1939. https://web.archive.org/web/20020927142010/http://www.library.yale.edu/slavic/census3739.html