As of the 2021 census, the population of Russia was 147.2 million.[9] It is the most populous country in Europe, and the ninth-most populous country in the world, with a population density of 8.5 inhabitants per square kilometre (22 inhabitants/sq mi).[10] As of 2020, the overall life expectancy in Russia at birth was 71.54 years (66.49 years for males and 76.43 years for females).[1]
| Demographics of Russia | |
|---|---|
 Population pyramid of Russia as of 1 January 2024 | |
| Population | 144,699,673 |
| Growth rate | |
| Birth rate | |
| Death rate | |
| Life expectancy | |
| • male | |
| • female | |
| Fertility rate | |
| Infant mortality rate | |
| Net migration rate | 0.9 migrant(s)/1,000 population (2020)[1] |
| Age structure | |
| Under 18 years | ~23.21%[4] |
| 18–44 years | ~34.73%[4] |
| 45–64 years | 26.55%[4] |
| 65 and over | 15.6%[4] |
| Sex ratio | |
| Total | 0.86 male(s)/female (2009) |
| At birth | 1.06 male(s)/female |
| Under 15 | 1.06 male(s)/female (male 11,980,138/female 11,344,818) |
| 15–64 years | 0.925 male(s)/female (male 48,166,470/female 52,088,967) |
| 65 and over | 0.44 male(s)/female (male 5,783,983/female 13,105,896) |
| Nationality | |
| Nationality | noun: Russian(s) adjective: Russian |
| Major ethnic | Russians |
| Language | |
| Spoken | Russian, others |
| Year | Pop. | ±% p.a. |
|---|---|---|
| 0 | 9,000,000 | — |
| 1000 | 9,000,000 | +0.00% |
| 1200 | 14,500,000 | +0.24% |
| 1500 | 14,700,000 | +0.00% |
| 1600 | 18,000,000 | +0.20% |
| 1700 | 18,000,000 | +0.00% |
| 1800 | 25,000,000 | +0.33% |
| 1900 | 73,000,000 | +1.08% |
| 1926 | 93,000,000 | +0.94% |
| 1930 | 100,000,000 | +1.83% |
| 1960 | 119,000,000 | +0.58% |
| 1970 | 130,079,000 | +0.89% |
| 1979 | 137,552,000 | +0.62% |
| 1989 | 147,386,000 | +0.69% |
| 2000 | 146,597,000 | −0.05% |
| 2010 | 142,849,000 | −0.26% |
| 2021 | 144,700,000 | +0.12% |
| Source:[5][6][7][failed verification][8] | ||
From 1992 to 2012, and again since 2016, Russia's death rate has exceeded its birth rate, which has been called a demographic crisis by analysts.[11] Subsequently, the nation has an ageing population, with the median age of the country being 40.3 years.[12] In 2009, Russia recorded annual population growth for the first time in fifteen years; during the mid-2010s, Russia had seen increased population growth due to declining death rates, increased birth rates and increased immigration.[13] Between 2020 and 2021, prior to the Russian invasion of Ukraine, Russia's population had undergone its largest peacetime decline in recorded history, due to excess deaths from the COVID-19 pandemic.[14] In addition, at least 1 million Russians fled the country to avoid military service in the war.
Russia is a multinational state,[15] home to over 193 ethnic groups nationwide. In the 2021 Census, nearly 72% of the population were ethnic Russians and approximately 19% of the population were ethnic minorities.[fn 1][16] According to the United Nations, Russia's immigrant population is the world's third largest, numbering over 11.6 million; most of whom are from other post-Soviet states.[17]
Population
Demographic statistics according to the latest Rosstat vital statistics[18] and the World Population Review in 2019.[19]
- One birth every 22 seconds[18]
- One death every 13 seconds[18]
- Net loss of one person every 30 seconds[18]
Demographic crisis


After having peaked at 148,689,000 in 1991, the population then decreased, falling to 142,737,196 by 2008.[21] Russia has become increasingly reliant on immigration to maintain its population; 2021 had the highest net immigration since 1994,[22] despite which there was a small overall decline from 146.1 million to 145.4 million in 2021, the largest decline in over a decade.[23]
The natural population had declined by 997,000 between October 2020 and September 2021 (the difference between the number of births and the number of deaths over a period).[24] The natural death rate in January 2020, 2021, and 2022 have each been nearly double the natural birth rate.[25]
Following the Russian invasion of Ukraine in 2022, the demographic crisis in the country has deepened,[26] as the country has reportedly suffered high military fatalities while facing renewed brain drain and human capital flight caused by Western mass-sanctions and boycotts.[27] Many commentators predict that the situation will be worse than during the 1990s.[28]
In March 2023, The Economist reported that "Over the past three years the country has lost around 2 million more people than it would ordinarily have done, as a result of war [in Ukraine], disease and exodus."[29]
The UN is projecting that the decline that started in 2021 will continue, and if current demographic conditions persist, Russia’s population would be 120 million in fifty years, a decline of about 17%.[30][29]
Fertility

Between 1993 and 2008, there was a great decrease in the country's population from 148 to 143 million.[31] There was a huge 50% decrease in the number of births per year from 2.5 million in 1987 to 1.2 million since 1997, but the current 1.42 fertility rate is still higher than that of the 1990s.[31]
At the beginning of 2022, 320,400 babies were born between January and March, 16,600 fewer than January–March 2021. There were nearly twice as many deaths (584,700) as births.[31] The crude birth rate - 8.9 per 100,000 inhabitants - was the lowest since the year 2000.[31]
Russia has one of the lowest fertility rates in the world with 1.42 children per woman in 2022, below 2.1 children per woman, which must be the number reached in order to maintain its population.[31] As a result of their low fertility for decades, the Russian population is one of the oldest in the world with an average of 40.3 years.[31]
Historical fertility rates
The total fertility rate is the number of children born to each woman. It is based on fairly good data for the entire period. Sources: Our World In Data and Gapminder Foundation.[32]

In many of the years from 1843 to 1917, Russia had the highest total fertility rate in the world.[32] These elevated fertility rates did not lead to population growth due to high mortality rate, the casualties of the Russian Revolution, the two world wars and to a lesser extent the political killings.
| TFR | Years | |||||||||
|---|---|---|---|---|---|---|---|---|---|---|
| 1840 | 1841 | 1842 | 1843 | 1844 | 1845 | 1846 | 1847 | 1848 | 1849[32] | |
| 7 | 7 | 7 | 7.01 | 7.02 | 7.03 | 7.05 | 7.06 | 7.08 | 7.08 | |
| 1850 | 1851 | 1852 | 1853 | 1854 | 1855 | 1856 | 1857 | 1858 | 1859[32] | |
| 7.07 | 7.07 | 7.07 | 7.06 | 7.05 | 7.03 | 7.01 | 7 | 6.98 | 6.97 | |
| 1860 | 1861 | 1862 | 1863 | 1864 | 1865 | 1866 | 1867 | 1868 | 1869[32] | |
| 6.95 | 6.93 | 6.95 | 6.96 | 6.98 | 6.99 | 7.01 | 7.02 | 6.51 | 6.87 | |
| 1870 | 1871 | 1872 | 1873 | 1874 | 1875 | 1876 | 1877 | 1878 | 1879[32] | |
| 6.74 | 7.03 | 6.85 | 7.24 | 7.17 | 7.15 | 7.02 | 6.87 | 6.58 | 6.98 | |
| 1880 | 1881 | 1882 | 1883 | 1884 | 1885 | 1886 | 1887 | 1888 | 1889[32] | |
| 6.8 | 6.66 | 7.03 | 6.89 | 6.83 | 6.74 | 6.47 | 6.61 | 6.96 | 6.8 | |
| 1890 | 1891 | 1892 | 1893 | 1894 | 1895 | 1896 | 1897 | 1898 | 1899[32] | |
| 6.71 | 7.44 | 6.57 | 7.17 | 7.18 | 7.34 | 7.43 | 7.52 | 7.28 | 7.36 | |
| 1900 | 1901 | 1902 | 1903 | 1904 | 1905 | 1906 | 1907 | 1908 | 1909[32] | |
| 7.36 | 7.2 | 7.36 | 7.2 | 7.24 | 6.72 | 7.04 | 7.08 | 7.44 | 7.12 | |
| 1910 | 1911 | 1912 | 1913 | 1914 | 1915 | 1916 | 1917 | 1918 | 1919[32] | |
| 7.2 | 7.2 | 7.2 | 6.96 | 6.88 | 3.36 | 5.2 | 5.04 | 5.72 | 3.44 | |
| 1920 | 1921 | 1922 | 1923 | 1924 | 1925 | 1926[32] | ||||
| 6.72 | 4.72 | 6 | 6.48 | 6.72 | 6.8 | 6.72 | ||||
| Years | 1941 | 1942 | 1943 | 1944 | 1945[32] |
|---|---|---|---|---|---|
| 4.60 | 2.96 | 1.68 | 1.72 | 1.92 |

Historical crude birth rates

| Years | 1801–1810 | 1811–1820 | 1821–1830 | 1831–1840 | 1841–1850 | 1851–1860[33] |
|---|---|---|---|---|---|---|
| Crude birth rates of Russia | 43.7 | 40.0 | 42.7 | 45.6 | 49.7 | 52.4 |
| Years | 1861–1870 | 1871–1880 | 1881–1890 | 1891–1900 | 1901–1910 | 1911–1914 | 18th century (only Orthodox) | 1801–1860 (only Orthodox)[33] |
|---|---|---|---|---|---|---|---|---|
| Crude birth rates of Russia | 50.3 | 50.4 | 50.4 | 49.2 | 46.8 | 43.9 | 51.0 | 50.0 |
Age structure
 Population pyramid in 1927
 Population pyramid in 1941
 Population pyramid in 1946
 Population pyramid in 2015
 Population pyramid in 2021
 Russia animated population pyramid 1946-2023
_on_01_January,_1927.png)


| Age Group | Male | Female | Total | % |
|---|---|---|---|---|
| Total | 66 264 910 | 76 936 820 | 143 201 730 | 100 |
| 0–4 | 4 377 526 | 4 155 682 | 8 533 208 | 5.97 |
| 5–9 | 3 762 806 | 3 588 032 | 7 350 838 | 5.13 |
| 10–14 | 3 396 364 | 3 231 761 | 6 628 125 | 4.63 |
| 15–19 | 3 776 026 | 3 615 840 | 7 391 866 | 5.16 |
| 20–24 | 5 708 187 | 5 515 543 | 11 223 730 | 7.84 |
| 25–29 | 6 262 379 | 6 179 628 | 12 442 007 | 8.69 |
| 30–34 | 5 583 513 | 5 647 636 | 11 231 149 | 7.84 |
| 35–39 | 5 087 565 | 5 331 818 | 10 419 383 | 7.28 |
| 40–44 | 4 589 504 | 4 861 983 | 9 451 487 | 6.60 |
| 45–49 | 4 632 279 | 5 151 813 | 9 784 092 | 6.83 |
| 50–54 | 5 279 364 | 6 219 077 | 11 498 441 | 8.03 |
| 55–59 | 4 480 855 | 5 817 559 | 10 298 414 | 7.19 |
| 60–64 | 3 523 990 | 5 010 867 | 8 534 857 | 5.96 |
| 65-69 | 1 602 839 | 2 571 671 | 4 174 510 | 2.92 |
| 70-74 | 1 989 724 | 3 975 348 | 5 965 072 | 4.17 |
| 75-79 | 1 179 476 | 2 709 384 | 3 888 860 | 2.72 |
| 80-84 | 722 151 | 2 073 803 | 2 795 954 | 1.95 |
| 85-89 | 253 028 | 1 008 627 | 1 261 655 | 0.88 |
| 90-94 | 46 736 | 219 427 | 266 163 | 0.19 |
| 95-99 | 8 634 | 43 988 | 52 622 | 0.04 |
| 100+ | 1 964 | 7 333 | 9 297 | 0.01 |
| Age group | Male | Female | Total | Percent |
| 0–14 | 11 536 696 | 10 975 475 | 22 512 171 | 15.72 |
| 15–64 | 48 923 662 | 53 351 764 | 102 275 426 | 71.42 |
| 65+ | 5 804 552 | 12 609 581 | 18 414 133 | 12.86 |
Median age

- total: 40.7 years. Country comparison to the world: 51st
- male: 37.6 years
- female: 43.5 years (2021 est.)
Life expectancy
_-diff.png)
- total population: 70.06 years for a child born in 2021, decreasing from 73.34 in 2019[1]
- male: 65.51 years (2021)
- female: 74.51 years (2021)
Infant mortality rate
- total: 4.5 deaths/1,000 live births (2020)[1]
- male: 5.0 deaths/1,000 live births (2020)
- female: 3.9 deaths/1,000 live births (2020)
Vital statistics
Before WW2
| Average population[35] | Live births | Deaths | Natural change | Crude birth rate (per 1,000) | Crude death rate (per 1,000) | Natural change (per 1,000) | Total fertility rates | Life Expectancy (male) | Life Expectancy (female) | |
|---|---|---|---|---|---|---|---|---|---|---|
| 1927 | 94,596,000 | 4,688,000 | 2,705,000 | 1,983,000 | 49.6 | 28.6 | 21.0 | 6.73 | 33.7 | 37.9 |
| 1928 | 96,654,000 | 4,723,000 | 2,589,000 | 2,134,000 | 48.9 | 26.8 | 22.1 | 6.56 | 35.9 | 40.4 |
| 1929 | 98,644,000 | 4,633,000 | 2,819,000 | 1,814,000 | 47.0 | 28.6 | 18.4 | 6.23 | 33.7 | 38.2 |
| 1930 | 100,419,000 | 4,413,000 | 2,738,000 | 1,675,000 | 43.9 | 27.3 | 16.7 | 5.83 | 34.6 | 38.7 |
| 1931 | 101,948,000 | 4,412,000 | 3,090,000 | 1,322,000 | 43.3 | 30.3 | 13.0 | 5.63 | 30.7 | 35.5 |
| 1932 | 103,136,000 | 4,058,000 | 3,077,000 | 981,000 | 39.3 | 29.8 | 9.5 | 5.09 | 30.5 | 35.7 |
| 1933 | 102,706,000 | 3,313,000 | 5,239,000 | -1,926,000 | 32.3 | 51.0 | -18.8 | 4.15 | 15.2 | 19.5 |
| 1934 | 102,922,000 | 2,923,000 | 2,659,000 | 264,000 | 28.7 | 26.1 | 2.6 | 3.57 | 30.5 | 35.7 |
| 1935 | 102,684,000 | 3,577,000 | 2,421,000 | 1,156,000 | 34.8 | 23.6 | 11.3 | 4.31 | 33.1 | 38.4 |
| 1936 | 103,904,000 | 3,899,000 | 2,719,000 | 1,180,000 | 37.5 | 26.2 | 11.4 | 4.54 | 30.4 | 35.7 |
| 1937 | 105,358,000 | 4,377,000 | 2,760,000 | 1,617,000 | 41.5 | 26.2 | 15.3 | 5.08 | 30.5 | 40.0 |
| 1938 | 107,044,000 | 4,379,000 | 2,739,000 | 1,640,000 | 40.9 | 25.6 | 15.3 | 4.99 | 31.7 | 42.5 |
| 1939 | 108,785,000 | 4,329,000 | 2,600,000 | 1,729,000 | 39.8 | 23.9 | 15.9 | 4.91 | 34.9 | 42.6 |
| 1940 | 110,333,000 | 3,814,000 | 2,561,000 | 1,253,000 | 34.6 | 23.2 | 11.4 | 4.26 | 35.7 | 41.9 |
After WW2
| Total average population (January 1, 1993 onwards) | Live births | Deaths | Natural change | Crude birth rate (per 1,000) | Crude death rate (per 1,000) | Natural change (per 1,000) | Crude migration change (per 1,000) | Total fertility rates[fn 2] | Urban fertility | Rural fertility | Life Expectancy (male) | Life Expectancy (female) | Life Expectancy (total) | Abortions (including miscarriages) reported | |
|---|---|---|---|---|---|---|---|---|---|---|---|---|---|---|---|
| 1946 | 98,028,000 | 2,546,000 | 1,210,000 | 1,336,000 | 26.0 | 12.3 | 13.6 | -5.4 | 2.81 | 46.6 | 55.3 | ||||
| 1947 | 98,834,000 | 2,715,000 | 1,680,000 | 1,035,000 | 27.5 | 17.0 | 10.5 | -1.7 | 2.94 | 39.9 | 49.8 | ||||
| 1948 | 99,706,000 | 2,516,000 | 1,310,000 | 1,206,000 | 25.2 | 13.1 | 12.1 | 2.5 | 2.60 | 47.0 | 56.0 | ||||
| 1949 | 101,160,000 | 3,089,000 | 1,187,000 | 1,902,000 | 30.5 | 11.7 | 18.8 | -2.3 | 3.21 | 51.0 | 59.8 | ||||
| 1950 | 102,833,000 | 2,859,000 | 1,180,000 | 1,679,000 | 27.8 | 11.5 | 16.3 | -0.7 | 2.89 | 52.3 | 61.0 | ||||
| 1951 | 104,439,000 | 2,938,000 | 1,210,000 | 1,728,000 | 28.1 | 11.6 | 16.5 | 0 | 2.92 | 52.3 | 60.6 | ||||
| 1952 | 106,164,000 | 2,928,000 | 1,138,000 | 1,790,000 | 27.6 | 10.7 | 16.9 | -1.2 | 2.87 | 54.6 | 62.9 | ||||
| 1953 | 107,828,000 | 2,822,000 | 1,118,000 | 1,704,000 | 26.2 | 10.4 | 15.8 | 1.0 | 2.73 | 55.5 | 63.9 | ||||
| 1954 | 109,643,000 | 3,048,000 | 1,133,000 | 1,915,000 | 27.8 | 10.3 | 17.5 | 0.1 | 2.97 | 55.9 | 64.1 | ||||
| 1955 | 111,572,000 | 2,942,000 | 1,037,000 | 1,905,000 | 26.4 | 9.3 | 17.1 | -1.4 | 2.82 | 58.3 | 66.6 | ||||
| 1956 | 113,327,000 | 2,827,000 | 956,000 | 1,871,000 | 24.9 | 8.4 | 16.5 | -1.4 | 2.73 | 60.1 | 68.8 | ||||
| 1957 | 115,035,000 | 2,880,000 | 1,017,000 | 1,863,000 | 25.0 | 8.8 | 16.2 | -1.3 | 2.75 | 59.7 | 68.4 | 3,407,398 | |||
| 1958 | 116,749,000 | 2,861,000 | 931,000 | 1,930,000 | 24.5 | 8.0 | 16.5 | -3.2 | 2.69 | 61.8 | 70.4 | 3,939,362 | |||
| 1959 | 118,307,000 | 2,796,228 | 920,225 | 1,876,003 | 23.6 | 7.8 | 15.9 | -2.4 | 2.58 | 2.03 | 3.34 | 62.84 | 71.14 | 67.65 | 4,174,111 |
| 1960 | 119,906,000 | 2,782,353 | 886,090 | 1,896,263 | 23.2 | 7.4 | 15.8 | -1.8 | 2.56 | 2.06 | 3.26 | 63.67 | 72.31 | 68.67 | 4,373,042 |
| 1961 | 121,586,000 | 2,662,135 | 901,637 | 1,760,498 | 21.9 | 7.4 | 14.5 | -1.8 | 2.47 | 2.04 | 3.08 | 63.91 | 72.63 | 68.92 | 4,759,040 |
| 1962 | 123,128,000 | 2,482,539 | 949,648 | 1,532,891 | 20.2 | 7.7 | 12.4 | -1.1 | 2.36 | 1.98 | 2.92 | 63.67 | 72.27 | 68.58 | 4,925,124 |
| 1963 | 124,514,000 | 2,331,505 | 932,055 | 1,399,450 | 18.7 | 7.5 | 11.2 | -1.3 | 2.31 | 1.93 | 2.87 | 64.12 | 72.78 | 69.05 | 5,134,100 |
| 1964 | 125,744,000 | 2,121,994 | 901,751 | 1,220,243 | 16.9 | 7.2 | 9.7 | -1.7 | 2.19 | 1.88 | 2.66 | 64.89 | 73.58 | 69.85 | 5,376,200 |
| 1965 | 126,749,000 | 1,990,520 | 958,789 | 1,031,731 | 15.7 | 7.6 | 8.1 | -1.3 | 2.14 | 1.82 | 2.58 | 64.37 | 73.33 | 69.44 | 5,463,300 |
| 1966 | 127,608,000 | 1,957,763 | 974,299 | 983,464 | 15.3 | 7.6 | 7.7 | -1.8 | 2.13 | 1.85 | 2.58 | 64.29 | 73.55 | 69.51 | 5,322,500 |
| 1967 | 128,361,000 | 1,851,041 | 1,017,034 | 834,007 | 14.4 | 7.9 | 6.5 | -1.2 | 2.03 | 1.79 | 2.46 | 64.02 | 73.43 | 69.30 | 5,005,000 |
| 1968 | 129,037,000 | 1,816,509 | 1,040,096 | 776,413 | 14.1 | 8.1 | 6.0 | -1.2 | 1.98 | 1.75 | 2.44 | 63.73 | 73.56 | 69.26 | 4,872,900 |
| 1969 | 129,660,000 | 1,847,592 | 1,106,640 | 740,952 | 14.2 | 8.5 | 5.7 | -1.1 | 1.99 | 1.78 | 2.44 | 63.07 | 73.29 | 68.74 | 4,751,100 |
| 1970 | 130,252,000 | 1,903,713 | 1,131,183 | 772,530 | 14.6 | 8.7 | 5.9 | -0.7 | 2.00 | 1.77 | 2.52 | 63.07 | 73.44 | 68.86 | 4,837,700 |
| 1971 | 130,934,000 | 1,974,637 | 1,143,359 | 831,278 | 15.1 | 8.7 | 6.3 | -0.5 | 2.02 | 1.80 | 2.60 | 63.24 | 73.77 | 69.12 | 4,838,749 |
| 1972 | 131,687,000 | 2,014,638 | 1,181,802 | 832,836 | 15.3 | 9.0 | 6.3 | -0.6 | 2.03 | 1.81 | 2.59 | 63.24 | 73.62 | 69.02 | 4,765,900 |
| 1973 | 132,434,000 | 1,994,621 | 1,214,204 | 780,417 | 15.1 | 9.2 | 5.9 | 0 | 1.96 | 1.75 | 2.55 | 63.28 | 73.56 | 69.00 | 4,747,037 |
| 1974 | 133,217,000 | 2,079,812 | 1,222,495 | 857,317 | 15.6 | 9.2 | 6.4 | 0.2 | 2.00 | 1.78 | 2.63 | 63.12 | 73.77 | 68.99 | 4,674,050 |
| 1975 | 134,092,000 | 2,106,147 | 1,309,710 | 796,437 | 15.7 | 9.8 | 5.9 | 1.1 | 1.97 | 1.76 | 2.64 | 62.48 | 73.23 | 68.35 | 4,670,700 |
| 1976 | 135,026,000 | 2,146,711 | 1,352,950 | 793,761 | 15.9 | 10.0 | 5.9 | 1.2 | 1.96 | 1.74 | 2.62 | 62.19 | 73.04 | 68.10 | 4,757,055 |
| 1977 | 135,979,000 | 2,156,724 | 1,387,986 | 768,738 | 15.9 | 10.2 | 5.7 | 1.2 | 1.92 | 1.72 | 2.58 | 61.82 | 73.19 | 67.97 | 4,686,063 |
| 1978 | 136,922,000 | 2,179,030 | 1,417,377 | 761,653 | 15.9 | 10.4 | 5.6 | 0.5 | 1.90 | 1.70 | 2.55 | 61.83 | 73.23 | 68.01 | 4,656,057 |
| 1979 | 137,758,000 | 2,178,542 | 1,490,057 | 688,485 | 15.8 | 10.8 | 5.0 | 0.3 | 1.87 | 1.67 | 2.54 | 61.49 | 73.02 | 67.73 | 4,544,040 |
| 1980 | 138,483,000 | 2,202,779 | 1,525,755 | 677,024 | 15.9 | 11.0 | 4.9 | 0.4 | 1.87 | 1.68 | 2.51 | 61.38 | 72.96 | 67.70 | 4,506,249 |
| 1981 | 139,221,000 | 2,236,608 | 1,524,286 | 712,322 | 16.1 | 10.9 | 5.1 | 1.0 | 1.88 | 1.69 | 2.55 | 61.61 | 73.18 | 67.92 | 4,400,676 |
| 1982 | 140,067,420 | 2,328,044 | 1,504,200 | 823,844 | 16.6 | 10.7 | 5.9 | 1.2 | 1.96 | 1.76 | 2.63 | 62.24 | 73.64 | 68.38 | 4,462,825 |
| 1983 | 141,056,000 | 2,478,322 | 1,563,995 | 914,327 | 17.6 | 11.1 | 6.5 | 0.6 | 2.11 | 1.89 | 2.76 | 62.15 | 73.41 | 68.15 | 4,317,729 |
| 1984 | 142,061,000 | 2,409,614 | 1,650,866 | 758,748 | 17.0 | 11.6 | 5.3 | 1.5 | 2.06 | 1.86 | 2.69 | 61.71 | 72.96 | 67.67 | 4,361,959 |
| 1985 | 143,033,000 | 2,375,147 | 1,625,266 | 749,881 | 16.6 | 11.4 | 5.2 | 2.7 | 2.05 | 1.87 | 2.68 | 62.72 | 73.23 | 68.33 | 4,552,443 |
| 1986 | 144,156,000 | 2,485,915 | 1,497,975 | 987,940 | 17.2 | 10.4 | 6.9 | 1.0 | 2.18 | 1.98 | 2.83 | 64.77 | 74.22 | 69.95 | 4,579,400 |
| 1987 | 145,386,000 | 2,499,974 | 1,531,585 | 968,389 | 17.2 | 10.5 | 6.7 | 1.0 | 2.22 | 1.974 | 3.187 | 64.83 | 74.26 | 69.96 | 4,385,627 |
| 1988 | 146,505,000 | 2,348,494 | 1,569,112 | 779,382 | 16.0 | 10.7 | 5.3 | 0.4 | 2.13 | 1.90 | 3.06 | 64.61 | 74.25 | 69.81 | 4,608,953 |
| 1989 | 147,342,000 | 2,160,559 | 1,583,743 | 576,816 | 14.7 | 10.7 | 3.9 | 0.4 | 2.01 | 1.83 | 2.63 | 64.20 | 74.50 | 69.73 | 4,427,713 |
| 1990 | 147,969,000 | 1,988,858 | 1,655,993 | 332,865 | 13.4 | 11.2 | 2.2 | 0.7 | 1.892 | 1.698 | 2.600 | 63.76 | 74.32 | 69.36 | 4,103,425 |
| 1991 | 148,394,000 | 1,794,626 | 1,690,657 | 103,969 | 12.1 | 11.4 | 0.7 | 0.3 | 1.732 | 1.531 | 2.447 | 63.41 | 74.23 | 69.11 | 3,608,421 |
| 1992 | 148,538,000 | 1,587,644 | 1,807,441 | -219,797 | 10.7 | 12.2 | -1.5 | 1.7 | 1.547 | 1.351 | 2.219 | 61.96 | 73.71 | 67.98 | 3,436,695 |
| 1993 | 148,561,694 [46] | 1,378,983 | 2,129,339 | -750,356 | 9.3 | 14.3 | -5.1 | 3.7 | 1.369 | 1.200 | 1.946 | 58.80 | 71.85 | 65.24 | 3,243,957 |
| 1994 | 148,355,867 | 1,408,159 | 2,301,366 | -893,207 | 9.5 | 15.5 | -6.0 | 6.7 | 1.394 | 1.238 | 1.917 | 57.38 | 71.07 | 63.93 | 3,060,237 |
| 1995 | 148,459,937 | 1,363,806 | 2,203,811 | -840,005 | 9.2 | 14.9 | -5.7 | 4.6 | 1.337 | 1.193 | 1.813 | 58.11 | 71.60 | 64.62 | 2,766,362 |
| 1996 | 148,291,638 | 1,304,638 | 2,082,249 | -777,611 | 8.8 | 14.1 | -5.2 | 3.4 | 1.270 | 1.140 | 1.705 | 59.61 | 72.41 | 65.89 | 2,652,038 |
| 1997 | 148,028,613 | 1,259,943 | 2,015,779 | -755,836 | 8.5 | 13.6 | -5.1 | 3.6 | 1.218 | 1.097 | 1.624 | 60.84 | 72.85 | 66.79 | 2,498,716 |
| 1998 | 147,802,133 | 1,283,292 | 1,988,744 | -705,452 | 8.7 | 13.5 | -4.8 | 3.0 | 1.232 | 1.109 | 1.643 | 61.19 | 73.12 | 67.14 | 2,346,138 |
| 1999 | 147,539,426 | 1,214,689 | 2,144,316 | -929,627 | 8.3 | 14.6 | -6.3 | 1.9 | 1.157 | 1.045 | 1.534 | 59.86 | 72.42 | 65.99 | 2,181,153 |
| 2000 | 146,890,128 | 1,266,800 | 2,225,332 | -958,532 | 8.6 | 15.2 | -6.5 | 2.5 | 1.195 | 1.089 | 1.554 | 58.99 | 72.25 | 65.38 | 2,138,800 |
| 2001 | 146,303,611 | 1,311,604 | 2,254,856 | -943,252 | 9.0 | 15.4 | -6.5 | 2.0 | 1.223 | 1.124 | 1.564 | 58.88 | 72.16 | 65.30 | 2,114,700 |
| 2002 | 145,649,334 | 1,396,967 | 2,332,272 | -935,305 | 9.6 | 16.1 | -6.4 | 1.7 | 1.286 | 1.189 | 1.633 | 58.68 | 71.90 | 64.95 | 1,944,481 |
| 2003 | 144,963,650 | 1,477,301 | 2,365,826 | -888,525 | 10.2 | 16.4 | -6.1 | 1.8 | 1.319 | 1.223 | 1.666 | 58.53 | 71.85 | 64.84 | 1,864,647 |
| 2004 | 144,333,586 | 1,502,477 | 2,295,402 | -792,925 | 10.4 | 15.9 | -5.5 | 1.8 | 1.344 | 1.253 | 1.654 | 58.91 | 72.36 | 65.31 | 1,797,567 |
| 2005 | 143,801,046 | 1,457,376 | 2,303,935 | -846,559 | 10.2 | 16.1 | -5.9 | 2.0 | 1.294 | 1.207 | 1.576 | 58.92 | 72.47 | 65.37 | 1,675,693 |
| 2006 | 143,236,582 | 1,479,637 | 2,166,703 | -687,066 | 10.3 | 15.1 | -4.8 | 2.2 | 1.305 | 1.210 | 1.601 | 60.43 | 73.34 | 66.69 | 1,582,398 |
| 2007 | 142,862,692 | 1,610,122 | 2,080,445 | -470,323 | 11.3 | 14.6 | -3.3 | 2.5 | 1.416 | 1.294 | 1.798 | 61.46 | 74.02 | 67.61 | 1,479,010 |
| 2008 | 142,742,368 | 1,713,947 | 2,075,954 | -362,007 | 12.0 | 14.5 | -2.6 | 2.5 | 1.502 | 1.372 | 1.912 | 61.92 | 74.28 | 67.99 | 1,385,600 |
| 2009 | 142,785,344 | 1,761,687 | 2,010,543 | -248,856 | 12.3 | 14.1 | -1.7 | 2.4 | 1.542 | 1.415 | 1.941 | 62.87 | 74.79 | 68.78 | 1,292,389 |
| 2010 | 142,849,472 | 1,788,948 | 2,028,516 | -239,568 | 12.5 | 14.2 | -1.7 | 1.9 | 1.567 | 1.439 | 1.983 | 63.09 | 74.88 | 68.94 | 1,186,108 |
| 2011 | 142,860,908 | 1,796,629 | 1,925,720 | -129,091 | 12.6 | 13.5 | -0.9 | 2.2 | 1.582 | 1.442 | 2.056 | 64.04 | 75.61 | 69.83 | 1,124,880 |
| 2012 | 143,056,383 | 1,902,084 | 1,906,335 | -4,251 | 13.3 | 13.3 | 0.0 | 2.0 | 1.691 | 1.541 | 2.215 | 64.56 | 75.86 | 70.24 | 1,063,982 |
| 2013 | 143,347,959 | 1,895,822 | 1,871,809 | 24,013 | 13.3 | 13.0 | 0.2 | 2.0 | 1.707 | 1.551 | 2.264 | 65.14 | 76.31 | 70.77 | 1,012,399 |
| 2014[a] | 143,666,931 | 1,942,683 | 1,912,347 | 30,336 | 13.3 | 13.0 | 0.3 | 17.8 | 1.750 | 1.588 | 2.318 | 65.29 | 76.49 | 70.93 | 929,963 |
| 2015 | 146,267,288 | 1,940,579 | 1,908,541 | 32,038 | 13.3 | 13.1 | 0.2 | 1.7 | 1.777 | 1.678 | 2.111 | 65.92 | 76.71 | 71.39 | 848,180 |
| 2016 | 146,544,710 | 1,888,729 | 1,891,015 | -2,286 | 12.9 | 12.9 | 0.0 | 1.8 | 1.762 | 1.672 | 2.056 | 66.50 | 77.06 | 71.87 | 836,611 |
| 2017 | 146,804,374 | 1,690,307 | 1,826,125 | -135,818 | 11.5 | 12.4 | -0.9 | 1.4 | 1.621 | 1.527 | 1.923 | 67.51 | 77.64 | 72.70 | 779,848 |
| 2018 | 146,880,432 | 1,604,344 | 1,828,910 | -224,566 | 10.9 | 12.5 | -1.6 | 0.9 | 1.579 | 1.489 | 1.870 | 67.75 | 77.81 | 72.91 | 661,045 |
| 2019 | 146,780,720 | 1,481,074 | 1,798,307 | -317,233 | 10.1 | 12.3 | -2.2 | 2.0 | 1.504 | 1.427 | 1.754 | 68.24 | 78.17 | 73.34 | 621,652 |
| 2020 | 146,170,015 | 1,436,514 | 2,138,586 | -702,072 | 9.8 | 14.6 | -4.8 | 0.9 | 1.505 | 1.433 | 1.739 | 66.49 | 76.43 | 71.54 | 553,500 |
| 2021 | 145,557,576 | 1,398,253 | 2,441,594 | -1,043,341 | 9.6 | 16.8 | -7.2 | 3.0 | 1.505 | 1.436 | 1.734 | 65.51 | 74.51 | 70.06 | 490,419 |
| 2022 | 146,424,729 | 1,304,087 | 1,898,644 | -594,557 | 8.9 | 13.0 | -4.1 | 10.4 | 1.416 | 1.36 | 1.59 | 67.60 | 77.79 | 72.76 | |
| 2023 | 146,325,519 | 1,264,938 | 1,760,172 | -495,234 | 8.6 | 12.0 | -3.4 | 68.04 | 78.74 | 73.41 |
| Urban live births | Urban deaths | Urban natural change | Urban crude birth rate (per 1,000) | Urban crude death rate (per 1,000) | Urban natural change (per 1,000) | Rural live births | Rural deaths | Rural natural change | Rural crude birth rate (per 1,000) | Rural crude death rate (per 1,000) | Rural natural change (per 1,000) | |
|---|---|---|---|---|---|---|---|---|---|---|---|---|
| 1950 | 1,171,250 | 436,792 | 734,458 | 26.1 | 9.7 | 16.4 | 1,574,747 | 594,218 | 980,529 | 27.5 | 10.4 | 17.1 |
| 1960 | 1,332,812 | 436,709 | 896,103 | 20.4 | 6.7 | 13.7 | 1,449,541 | 449,831 | 1,000,160 | 26.5 | 8.2 | 18.3 |
| 1970 | 1,205,207 | 646,129 | 559,078 | 14.8 | 7.9 | 6.9 | 698,506 | 485,054 | 213,452 | 14.3 | 10.0 | 4.3 |
| 1980 | 1,535,723 | 970,256 | 565,467 | 15.8 | 10.0 | 5.8 | 667,056 | 555,499 | 111,557 | 16.1 | 13.4 | 2.7 |
| 1990 | 1,386,247 | 1,140,613 | 245,634 | 12.7 | 10.5 | 2.2 | 602,611 | 515,380 | 87,231 | 15.5 | 13.2 | 2.3 |
| 1995 | 933,460 | 1,554,182 | –620,722 | 8.7 | 14.4 | –5.7 | 430,346 | 649,269 | –219,283 | 10.9 | 16.5 | –5.6 |
| 2000 | 886,908 | 1,564,034 | –677,126 | 8.3 | 14.6 | –6.3 | 379,892 | 661,298 | –281,406 | 9.8 | 17.1 | –7.3 |
| 2001 | 928,642 | 1,592,254 | –663,612 | 8.7 | 14.9 | –6.2 | 382,962 | 662,602 | –279,640 | 10.0 | 17.3 | –7.3 |
| 2002 | 998,056 | 1,638,822 | –640,766 | 9.4 | 15.4 | –6.0 | 398,911 | 693,450 | –294,539 | 10.5 | 18.2 | –7.7 |
| 2003 | 1,050,565 | 1,657,569 | –607,004 | 9.9 | 15.6 | –5.7 | 426,736 | 708,257 | –281,521 | 11.1 | 18.4 | –7.3 |
| 2004 | 1,074,247 | 1,606,894 | –532,647 | 10.1 | 15.2 | –5.1 | 428,230 | 688,508 | –260,278 | 11.2 | 18.1 | –6.9 |
| 2005 | 1,036,870 | 1,595,762 | –558,892 | 9.8 | 15.1 | –5.3 | 420,506 | 708,173 | –287,667 | 11.0 | 18.6 | –7.6 |
| 2006 | 1,044,540 | 1,501,245 | –456,705 | 10.0 | 14.3 | –4.3 | 435,097 | 665,458 | –230,361 | 11.4 | 17.4 | –6.0 |
| 2007 | 1,120,741 | 1,445,411 | –324,670 | 10.7 | 13.8 | –3.1 | 489,381 | 635,034 | –145,653 | 12.9 | 16.7 | –3.8 |
| 2008 | 1,194,820 | 1,443,529 | –248,709 | 11.4 | 13.8 | –2.4 | 519,127 | 632,425 | –113,298 | 13.7 | 16.7 | –3.0 |
| 2009 | 1,237,615 | 1,397,591 | –159,976 | 11.8 | 13.3 | –1.5 | 524,072 | 612,952 | –88,880 | 13.9 | 16.3 | –2.4 |
| 2010 | 1,263,893 | 1,421,734 | –157,841 | 12.0 | 13.5 | –1.5 | 520,055 | 606,782 | –81,727 | 14.0 | 16.1 | –2.1 |
| 2011 | 1,270,047 | 1,356,696 | –88,649 | 12.0 | 12.8 | –0.8 | 526,582 | 569,024 | –42,442 | 14.1 | 15.2 | –1.1 |
| 2012 | 1,355,674 | 1,353,635 | 2,039 | 12.8 | 12.8 | 0.0 | 546,410 | 552,700 | –6,290 | 14.7 | 14.8 | –0.1 |
| 2013 | 1,357,310 | 1,332,505 | 24,805 | 12.8 | 12.5 | 0.3 | 538,512 | 539,304 | –792 | 14.5 | 14.5 | –0.0 |
| 2014 | 1,394,860 | 1,362,810 | 32,050 | 12.9 | 12.6 | 0.3 | 547,823 | 549,537 | –1,714 | 14.4 | 14.5 | –0.1 |
| 2015 | 1,455,283 | 1,361,891 | 93,392 | 13.4 | 12.6 | 0.8 | 485,296 | 546,650 | –61,354 | 12.8 | 14.4 | –1.6 |
| 2016 | 1,426,591 | 1,354,944 | 71,597 | 13.1 | 12.4 | 0.7 | 462,138 | 536,071 | –73,933 | 12.2 | 14.2 | –2.0 |
| 2017 | 1,269,527 | 1,310,235 | –40,708 | 11.6 | 12.0 | –0.4 | 420,780 | 515,890 | –95,110 | 11.2 | 13.7 | –2.5 |
| 2018 | 1,205,231 | 1,317,703 | –112,472 | 11.0 | 12.0 | –1.0 | 399,113 | 511,207 | –112,094 | 10.6 | 13.6 | –3.0 |
| 2019 | 1,115,337 | 1,301,650 | −186,313 | 10.2 | 11.9 | –1.7 | 365,737 | 496,657 | −130,920 | 9.8 | 13.3 | –3.5 |
| 2020 | 1,079,887 | 1,568,773 | −488,886 | 9.9 | 14.4 | –4.5 | 356,627 | 569,813 | −213,186 | 9.6 | 15.3 | –5.7 |
| 2021 | 1,047,736 | 1,799,381 | −751,645 | 9.6 | 16.5 | –6.9 | 350,522 | 642,218 | −291,696 | 9.5 | 17.5 | –7.9 |
Current vital statistics
| Period | Live births | Deaths | Natural increase |
|---|---|---|---|
| January - February 2023 | 199,295 | 301,227 | -101,932 |
| January - February 2024 | 201,345 | 331,083 | -129,738 |
| Difference | |||
| Source:[18] | |||
All numbers for the Russian Federation in this section do not include the Ukrainian regions of Kherson, Zaporizhzhia, Donetsk and Luhansk, which Russia annexed in September 2022 and which are currently partly under Russian military control. The annexation is internationally recognized only by North Korea.
Immigration
In 2006, in a bid to compensate for the country's demographic decline, the Russian government started simplifying immigration laws.[citation needed] New citizenship rules introduced in April 2014 allowing eligible citizens from former Soviet republics to obtain Russian citizenship, have gained strong interest among Russian-speaking residents of those countries (i.e. Russians, Germans, Belarusians and Ukrainians).[47][48]
There are an estimated four million undocumented immigrants from the ex-Soviet states in Russia.[49] In 2012, the Russian Federal Security Service's Border Service stated there had been an increase in undocumented migration from the Middle East and Southeast Asia (Note that these were Temporary Contract Migrants)[50] Under legal changes made in 2012, undocumented immigrants who are caught will be banned from reentering the country for 10 years.[51][52]
Since the collapse of the USSR, most immigrants have come from Ukraine, Uzbekistan, Tajikistan, Azerbaijan, Armenia, Kyrgyzstan, Moldova, Kazakhstan, Turkmenistan, Belarus, from poor areas of China, and from Vietnam and Laos.[53]
Worker migration
Temporary migrant workers in Russia consists of about 7 million people. Most of the temporary workers come from Central Asia (mostly from Uzbekistan, Tajikistan and Kyrgyzstan), the South Caucasus (mostly from Armenia and Azerbaijan), and East Asia (mostly from poor areas of China, from Vietnam and Laos). Most of them work in the construction, cleaning and in the household industries. They primarily live in cities such as Moscow, Sochi and Blagoveshchensk. The mayor of Moscow said that Moscow cannot do without worker migrants. New laws are in place that require worker migrants to be fluent in Russian, know Russian history and laws.
Emigration
The 2022 Russian invasion of Ukraine has led to considerable emigration, with over 300,000 Russian citizens and residents are estimated to have left Russia by mid-March 2022, at least 500,000 by the end of August 2022,[54] and an additional 400,000 by early October. The total number of political refugees, economic migrants, and conscientious objectors[55][56][57][58][59] is thought to be more than 900,000. In addition to evading criminal prosecution for opposing the invasion, and fear of being conscripted after President Vladimir Putin's 21 September 2022 announcement of partial mobilization, those fleeing voiced reasons such as disagreement with the war, the uselessness and cruelty of the war, sympathy for Ukraine, disagreement with the political roots of the war with Ukraine, the rejection of killing, and an assessment that Russia is no longer the place for their family.[60]
Occupied and annexed regions
Russia has encouraged or even forced people in occupied or annexed regions to become Russian citizens, a procedure known as passportization. This includes the Donetsk, Kherson, Luhansk and Zaporizhzhia oblasts of Ukraine,[61] and South Ossetia and Abkhazia in Georgia.[62]
Employment and income
- Unemployment, youth ages 15–24
- total: 12%. Country comparison to the world: 72nd
- male: 15.3%
- female: 16.9% (2015 est.)
Health

Russia's constitution guarantees free, universal health care for all Russian citizens, through a compulsory state health insurance program.[64] The Ministry of Health of the Russian Federation oversees the Russian public healthcare system, and the sector employs more than two million people. Federal regions also have their own departments of health that oversee local administration. A separate private health insurance plan is needed to access private healthcare in Russia.[65]
Russia spent 5.32% of its GDP on healthcare in 2018.[66] Its healthcare expenditure is notably lower than other developed nations.[67] Russia has one of the world's most female-biased sex ratios, with 0.859 males to every female,[12] due to its high male mortality rate.[68] In 2019, the overall life expectancy in Russia at birth was 73.2 years (68.2 years for males and 78.0 years for females),[69] and it had a very low infant mortality rate (5 per 1,000 live births).[70]
The principal causes of death in Russia are cardiovascular diseases.[71] Obesity is a prevalent health issue in Russia; 61.1% of Russian adults were overweight or obese in 2016.[72] However, Russia's historically high alcohol consumption rate is the biggest health issue in the country,[73][74] as it remains one of the world's highest, despite a stark decrease in the last decade.[75] Smoking is another health issue in the country.[76] The country's high suicide rate, although on the decline,[77] remains a significant social issue.[78]
COVID-19 pandemic
Russia had one of the highest number of confirmed cases in the world. Analysis of excess deaths from official government demographic statistics, based on births and deaths and excluding migration, showed that Russia had its biggest ever annual population drop in peacetime, with the population declining by 997,000 between October 2020 and September 2021, which demographer Alexei Raksha interpreted as being primarily due to the COVID-19 pandemic.[24]
Ethnic groups

.png)
Russia is a multinational state, with many subnational entities associated with different minorities.[15] There are over 193 ethnic groups nationwide. In the 2021 census, nearly 71.73% of the population identified as ethnic Russians, and while approximately 19% of the total population identified with various ethnic minority groups.[79][80] The percentage of total Russian population that did not publicly indicate any ethnic identity in the census increased from 3.94% in 2010 to 11.27% in 2021.[81]
According to the 2021 Russian census, the number of ethnic Russians decreased by nearly 5.43 million, from roughly 111 million people in 2010 to approximately 105.5 million in 2021.[82] In 2010, four-fifths of Russia's population originated from West of the Ural Mountains — of which the vast majority were Slavs,[83] with a substantial minority of Finno-Ugric and Germanic peoples.[84][85] Turkic peoples form a large minority, and are spread around pockets across the vast nation.[86] Various distinct ethnic groups also inhabit the North Caucasus.[87] Other minorities include Mongolian peoples (Buryats and Kalmyks),[88][89] the Indigenous peoples of Siberia,[90] a historical Jewish population,[91] and the Koryo-saram (including Sakhalin Koreans).[92]
According to the United Nations, Russia's immigrant population is the third-largest in the world, numbering over 11.6 million in 2016;[17] most of which are from post-Soviet states, mainly from Central Asia.[93] There are 22 republics in Russia, who have their own ethnicities, cultures, and languages. In 12 of them in 2021, ethnic Russians constitute a minority:
| Ethnic Russian-minority regions in Russia in 2021 | |
|---|---|
| Republic | ethnic Russians (%) |
 Bashkortostan Bashkortostan | 37.5% |
 Chechnya Chechnya | 1.2% |
 Chuvashia Chuvashia | 30.7% |
 Dagestan Dagestan | 3.3% |
 Ingushetia Ingushetia | 0.7% |
 Kabardino-Balkaria Kabardino-Balkaria | 19.8% |
 Kalmykia Kalmykia | 25.7% |
 Karachay-Cherkessia Karachay-Cherkessia | 27.5% |
 North Ossetia–Alania North Ossetia–Alania | 18.9% |
 Sakha (Yakutia) Sakha (Yakutia) | 32.6% |
 Tatarstan Tatarstan | 40.3% |
 Tuva Tuva | 10.1% |
Languages
.png)

Russian is the official and the predominantly spoken language in Russia. It is the most spoken native language in Europe, the most geographically widespread language of Eurasia, as well as the world's most widely spoken Slavic language.[96] Russian is the fifth-most used language on the Internet,[97] and is one of two official languages aboard the International Space Station,[98] as well as one of the six official languages of the United Nations.[96]
Russia is a multilingual nation; approximately 100–150 minority languages are spoken across the country.[99][100] According to the Russian Census of 2002, 142.6 million across the country spoke Russian, 5.3 million spoke Tatar, and 1.8 million spoke Ukrainian.[101] The constitution allows the country's individual republics the right to establish their own state languages in addition to Russian, as well as guarantee its citizens the right to preserve their native language and to create conditions for its study and development.[102] However, various experts have claimed Russia's linguistic diversity is rapidly declining.[103][104]
Religion
Religion in Russia (2012)[105]

Russia is a secular state by constitution, and its largest religion is Christianity. It has the world's largest Orthodox population.[106][107] As of different sociological surveys on religious adherence, between 41% and over 80% of the total population of Russia adhere to the Russian Orthodox Church.[108][109][110] Other branches of Christianity present in Russia include Catholicism (approx. 1%), Baptists, Pentecostals, Lutherans and other Protestant churches (together totalling about 0.5% of the population) and Old Believers.[111][112] There is some presence of Judaism, Buddhism, and Hinduism; pagan beliefs are also present to some extent in remote areas, sometimes syncretized with one of the mainstream religions.
In 2017, a survey made by the Pew Research Center showed that 73% of Russians declared themselves as Christians—out of which 71% were Orthodox, 1% were Catholic, and 2% were Other Christians, while 15% were unaffiliated, 10% were Muslims, and 1% followed other religions.[113] According to various reports, the proportion of Atheists in Russia is between 16% and 48% of the population.[114]
Islam is the second-largest religion in Russia, and it is the traditional religion amongst most peoples of the North Caucasus, and amongst some Turkic peoples scattered along the Volga-Ural region.[115] Buddhists have a sizable population in three Siberian republics: Buryatia, Tuva, and Zabaykalsky Krai, and in Kalmykia, the only region in Europe where Buddhism is the most practised religion.[116]
Education

Russia has an adult literacy rate of 100%.[118] It grants free education to its citizens under its constitution.[119] The Ministry of Education of Russia is responsible for primary and secondary education, as well as vocational education; while the Ministry of Education and Science of Russia is responsible for science and higher education.[120] Regional authorities regulate education within their jurisdictions within the prevailing framework of federal laws. Russia is among the world's most educated countries, and has the third-highest proportion of tertiary-level graduates in terms of percentage of population, at 62%.[121] It spent roughly 4.7% of its GDP on education in 2018.[122]
Russia has compulsory education for a duration of 11 years, exclusively for children aged 7 to 17–18.[120] Its pre-school education system is highly developed and optional,[123] some four-fifths of children aged 3 to 6 attend day nurseries or kindergartens. Primary school is compulsory for 11 years, starting from age 6 to 7, and leads to a basic general education certificate.[120] An additional two or three years of schooling are required for the secondary-level certificate, and some seven-eighths of Russians continue their education past this level. Admission to an institute of higher education is selective and highly competitive:[119] first-degree courses usually take five years.[124] The oldest and largest universities in Russia are Moscow State University and Saint Petersburg State University.[125] There are ten highly prestigious federal universities across the country. Russia was the world's fifth-leading destination for international students in 2019, hosting roughly 300,000.[126]
Urbanized areas
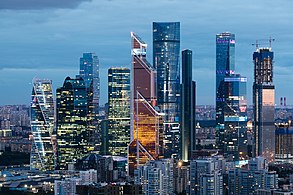 Moscow, the capital and largest city of Russia
 Saint Petersburg, the cultural capital and the second-largest city
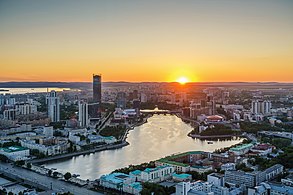 Yekaterinburg, the fourth-largest city in the country.


Russia is one of the world's most urbanized countries, with roughly 75% of its total population living in urban areas.[12] Moscow, the capital and largest city, has a population estimated at 12.4 million residents within the city limits,[127] while over 17 million residents in the urban area,[128] and over 20 million residents in the metropolitan area.[129] Moscow is among the world's largest cities, being the most populous city entirely within Europe, the most populous urban area in Europe,[128] the most populous metropolitan area in Europe,[129] and also the largest city by land area on the European continent.[130] Saint Petersburg, the cultural capital, is the second-largest city, with a population of roughly 5.4 million inhabitants.[131] Other major urban areas are Yekaterinburg, Novosibirsk, Kazan, Nizhny Novgorod, and Chelyabinsk.
| Rank | Name | Federal subject | Pop. | Rank | Name | Federal subject | Pop. | ||
|---|---|---|---|---|---|---|---|---|---|
| 1 | Moscow | Moscow | 13,149,803 | 11 | Rostov-on-Don | Rostov Oblast | 1,140,487 | ||
| 2 | Saint Petersburg | Saint Petersburg | 5,597,763 | 12 | Krasnodar | Krasnodar Krai | 1,138,654 | ||
| 3 | Novosibirsk | Novosibirsk Oblast | 1,633,851 | 13 | Omsk | Omsk Oblast | 1,104,485 | ||
| 4 | Yekaterinburg | Sverdlovsk Oblast | 1,536,183 | 14 | Voronezh | Voronezh Oblast | 1,046,425 | ||
| 5 | Kazan | Tatarstan | 1,318,604 | 15 | Perm | Perm Krai | 1,026,908 | ||
| 6 | Krasnoyarsk | Krasnoyarsk Krai | 1,205,473 | 16 | Volgograd | Volgograd Oblast | 1,018,898 | ||
| 7 | Nizhny Novgorod | Nizhny Novgorod Oblast | 1,204,985 | 17 | Saratov | Saratov Oblast | 887,365 | ||
| 8 | Chelyabinsk | Chelyabinsk Oblast | 1,177,058 | 18 | Tyumen | Tyumen Oblast | 861,098 | ||
| 9 | Ufa | Bashkortostan | 1,163,304 | 19 | Tolyatti | Samara Oblast | 667,956 | ||
| 10 | Samara | Samara Oblast | 1,158,952 | 20 | Makhachkala | Dagestan | 622,091 | ||
See also
- Demographic history of Russia
- Demographics of Siberia
- Demographic crisis of Russia
- List of federal subjects of Russia by total fertility rate
- List of federal subjects of Russia by life expectancy
- Genetic studies on Russians
- Health in Russia
- Indigenous small-numbered peoples of the North, Siberia and the Far East
- Russian cross
- Russian nationality law
Census information:
Notes
References
Further reading
- Gavrilova N.S., Gavrilov L.A. Aging Populations: Russia/Eastern Europe. In: P. Uhlenberg (Editor), International Handbook of the Demography of Aging, New York: Springer-Verlag, 2009, pp. 113–131.
- Gavrilova N.S., Semyonova V.G., Dubrovina E., Evdokushkina G.N., Ivanova A.E., Gavrilov L.A. Russian Mortality Crisis and the Quality of Vital Statistics. Population Research and Policy Review, 2008, 27: 551–574.
- Gavrilova, N.S., Gavrilov, L.A., Semyonova, V.G., Evdokushkina, G.N., Ivanova, A.E. 2005. Patterns of violent crime in Russia. In: Pridemore, W.A. (ed.). Ruling Russia: Law, Crime, and Justice in a Changing Society. Boulder, Colorado: Rowman & Littlefield Publ., Inc, 117–145
- Gavrilova, N.S., Semyonova, V.G., Evdokushkina G.N., Gavrilov, L.A. The response of violent mortality to economic crisis in Russia. Population Research and Policy Review, 2000, 19: 397–419.
- Kamenskii, Aleksander (2014). "Do we know the composition of the 18th century Russian society?". Cahier du MONDE RUSSE. 55 (1–2): 135–148. doi:10.4000/monderusse.7989. ISBN 9782713224409. ISSN 1777-5388.
External links
- Igor Beloborodov, Demographic situation in Russia in 1992–2010 Archived 14 October 2022 at the Wayback Machine (report at the Moscow Demographic Summit — June 2011)
- Nicholas Eberstadt, Russia's Peacetime Demographic Crisis: Dimensions, Causes, Implications (National Bureau of Asian Research Project Report, May 2010)
- Edited by Julie DaVanzo, Gwen Farnsworth Russia's Demographic "Crisis" 1996 RAND ISBN 0-8330-2446-9
- Jessica Griffith The Regional Consequences of Russia's Demographic Crisis Archived 12 April 2012 at the Wayback Machine University of Leicester
- Results of population policy and current demographic situation (2008)
- Interactive statistics for all countries, site of United States Census Bureau.
- 2009 World Population Data Sheet Archived 8 June 2017 at the Wayback Machine by the Population Reference Bureau
- Population density and distribution maps (text is in Russian; the topmost map shows population density based on 1996 data)
- Ethnic groups of Russia
- Problems with mortality data in Russia
- V. Borisov "Demographic situation in Russia and the role of mortality in reproduction of population" Archived 14 October 2022 at the Wayback Machine, 2005 (in English)
- Choice between mass migration and birth rate increase as possible solutions of depopulation problem in Russia (in Russian)