File:LimSup.png
Size of this preview: 800 × 409 pixels. Other resolutions: 320 × 164 pixels | 640 × 327 pixels | 996 × 509 pixels.
Original file (996 × 509 pixels, file size: 46 KB, MIME type: image/png)
Summary
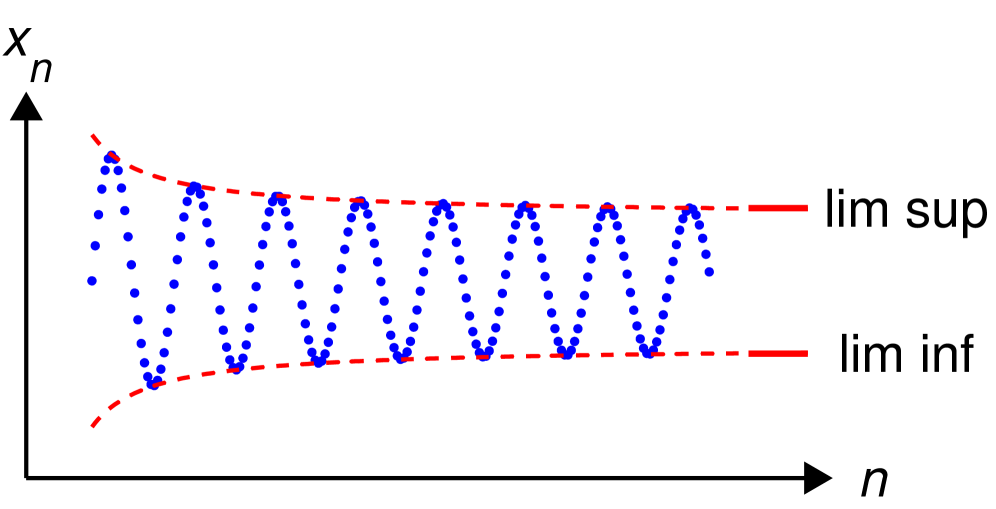
Made by myself with matlab.
 | File:LimSup.svg is a vector version of this file. It should be used in place of this PNG file when not inferior. File:LimSup.png → File:LimSup.svg For more information, see Help:SVG. |  |
Licensing
| I, the copyright holder of this work, release this work into the public domain. This applies worldwide. In some countries this may not be legally possible; if so: I grant anyone the right to use this work for any purpose, without any conditions, unless such conditions are required by law. |
Source code (MATLAB)
function main() % draw an illustration for limit superior and limit inferior% prepare the screen and define some parameters clf; hold on; axis equal; axis off; fontsize=25; thick_line=3; thin_line=2;black=[0, 0, 0]; red=[1, 0, 0]; blue=[0, 0, 1];arrowsize=0.5; arrow_type=1; arrow_angle=30; % (angle in degrees)circrad=0.07; % radius of ball showing up in placesB=9.4;X=0:0.05:B;f=inline('(X+2)./(X+0.9)', 'X');Y=sin(5*X).*f(X);for i=1:length(X) ball(X(i), Y(i), circrad, blue);endK=1.5;X=0:0.05:(B+K);Z=f(X);plot(X, Z, 'r--', 'linewidth', thin_line)plot(X, -Z, 'r--', 'linewidth', thin_line)L=f(B); plot([B+0.4*K B+K], [L, L], 'linestyle', '-', 'linewidth', thick_line, 'color', red);plot([B+0.4*K B+K], [-L, -L], 'linestyle', '-', 'linewidth', thick_line, 'color', red);shift=2*K;H=text(B+shift, L, 'lim sup'); set(H, 'fontsize', fontsize, 'HorizontalAlignment', 'c')H=text(B+shift, -L, 'lim inf'); set(H, 'fontsize', fontsize, 'HorizontalAlignment', 'c')shift=-3;K1=1.2; K2=2.6; arrow([-1 shift], [K1*B, shift], thin_line, arrowsize, arrow_angle, arrow_type, black) arrow([-1, shift], [-1, K2*L], thin_line, arrowsize, arrow_angle, arrow_type, black) axis ([-0.2*B, K1*B+1, -2*L+shift, K2*L]);H=text(K1*B+0.6, shift, '\it{n}'); set(H, 'fontsize', fontsize, 'HorizontalAlignment', 'c')H=text(-1, K2*L+0.5, '\it{x_n}'); set(H, 'fontsize', fontsize, 'HorizontalAlignment', 'c')saveas(gcf, 'LimSup.eps', 'psc2') % export to epsfunction ball(x, y, r, color) Theta=0:0.1:2*pi; X=r*cos(Theta)+x; Y=r*sin(Theta)+y; H=fill(X, Y, color); set(H, 'EdgeColor', 'none');function arrow(start, stop, thickness, arrow_size, sharpness, arrow_type, color) % Function arguments:% start, stop: start and end coordinates of arrow, vectors of size 2% thickness: thickness of arrow stick% arrow_size: the size of the two sides of the angle in this picture ->% sharpness: angle between the arrow stick and arrow side, in degrees% arrow_type: 1 for filled arrow, otherwise the arrow will be just two segments% color: arrow color, a vector of length three with values in [0, 1] % convert to complex numbers i=sqrt(-1); start=start(1)+i*start(2); stop=stop(1)+i*stop(2); rotate_angle=exp(i*pi*sharpness/180);% points making up the arrow tip (besides the "stop" point) point1 = stop - (arrow_size*rotate_angle)*(stop-start)/abs(stop-start); point2 = stop - (arrow_size/rotate_angle)*(stop-start)/abs(stop-start); if arrow_type==1 % filled arrow % plot the stick, but not till the end, looks bad t=0.5*arrow_size*cos(pi*sharpness/180)/abs(stop-start); stop1=t*start+(1-t)*stop; plot(real([start, stop1]), imag([start, stop1]), 'LineWidth', thickness, 'Color', color); % fill the arrow H=fill(real([stop, point1, point2]), imag([stop, point1, point2]), color); set(H, 'EdgeColor', 'none') else % two-segment arrow plot(real([start, stop]), imag([start, stop]), 'LineWidth', thickness, 'Color', color); plot(real([stop, point1]), imag([stop, point1]), 'LineWidth', thickness, 'Color', color); plot(real([stop, point2]), imag([stop, point2]), 'LineWidth', thickness, 'Color', color); endFile history
Click on a date/time to view the file as it appeared at that time.
| Date/Time | Thumbnail | Dimensions | User | Comment | |
|---|---|---|---|---|---|
| current | 17:02, 24 February 2007 | | 996 × 509 (46 KB) | Oleg Alexandrov | Made by myself with matlab. |
File usage
The following page uses this file:
Global file usage
The following other wikis use this file:
- Usage on ary.wikipedia.org
- Usage on de.wikipedia.org
- Usage on or.wikipedia.org
🔥 Top keywords: Main PageSpecial:Search0Slash (punctuation)BlackSpecial:RecentChanges4 (number)DavidSOLID (object-oriented design)Wikipedia:AboutFile:Sexual intercourse with internal ejaculation.webmHelp:ContentsHelp:IntroductionLisa Sparxxx2023 UEFA Champions League FinalColour24-hour clockAdolf Hitler UunonaBismillahir Rahmanir Raheem6 (number)T. N. SeshanFile:ASCII-Table-wide.svg20 (number)Poor Things (movie)United StatesCristiano RonaldoList of people who have walked on the MoonAli Malikov50 (number)17 (number)The Valley (2024 TV series)GrassList of mathematical symbolsList of U.S. states and territories by time zone8 (number)List of countries by areaWikipedia:Simple talkList of largest Hindu templesRama