

ดูภาพที่มีความละเอียดสูงกว่า (3,000 × 2,438 พิกเซล, ขนาดไฟล์: 5.85 เมกะไบต์, ชนิดไมม์: image/png)
| รูปภาพหรือไฟล์เสียงนี้ ต้นฉบับอยู่ที่ คอมมอนส์ รายละเอียดด้านล่าง เป็นข้อความที่แสดงผลจาก ไฟล์ต้นฉบับในคอมมอนส์ |
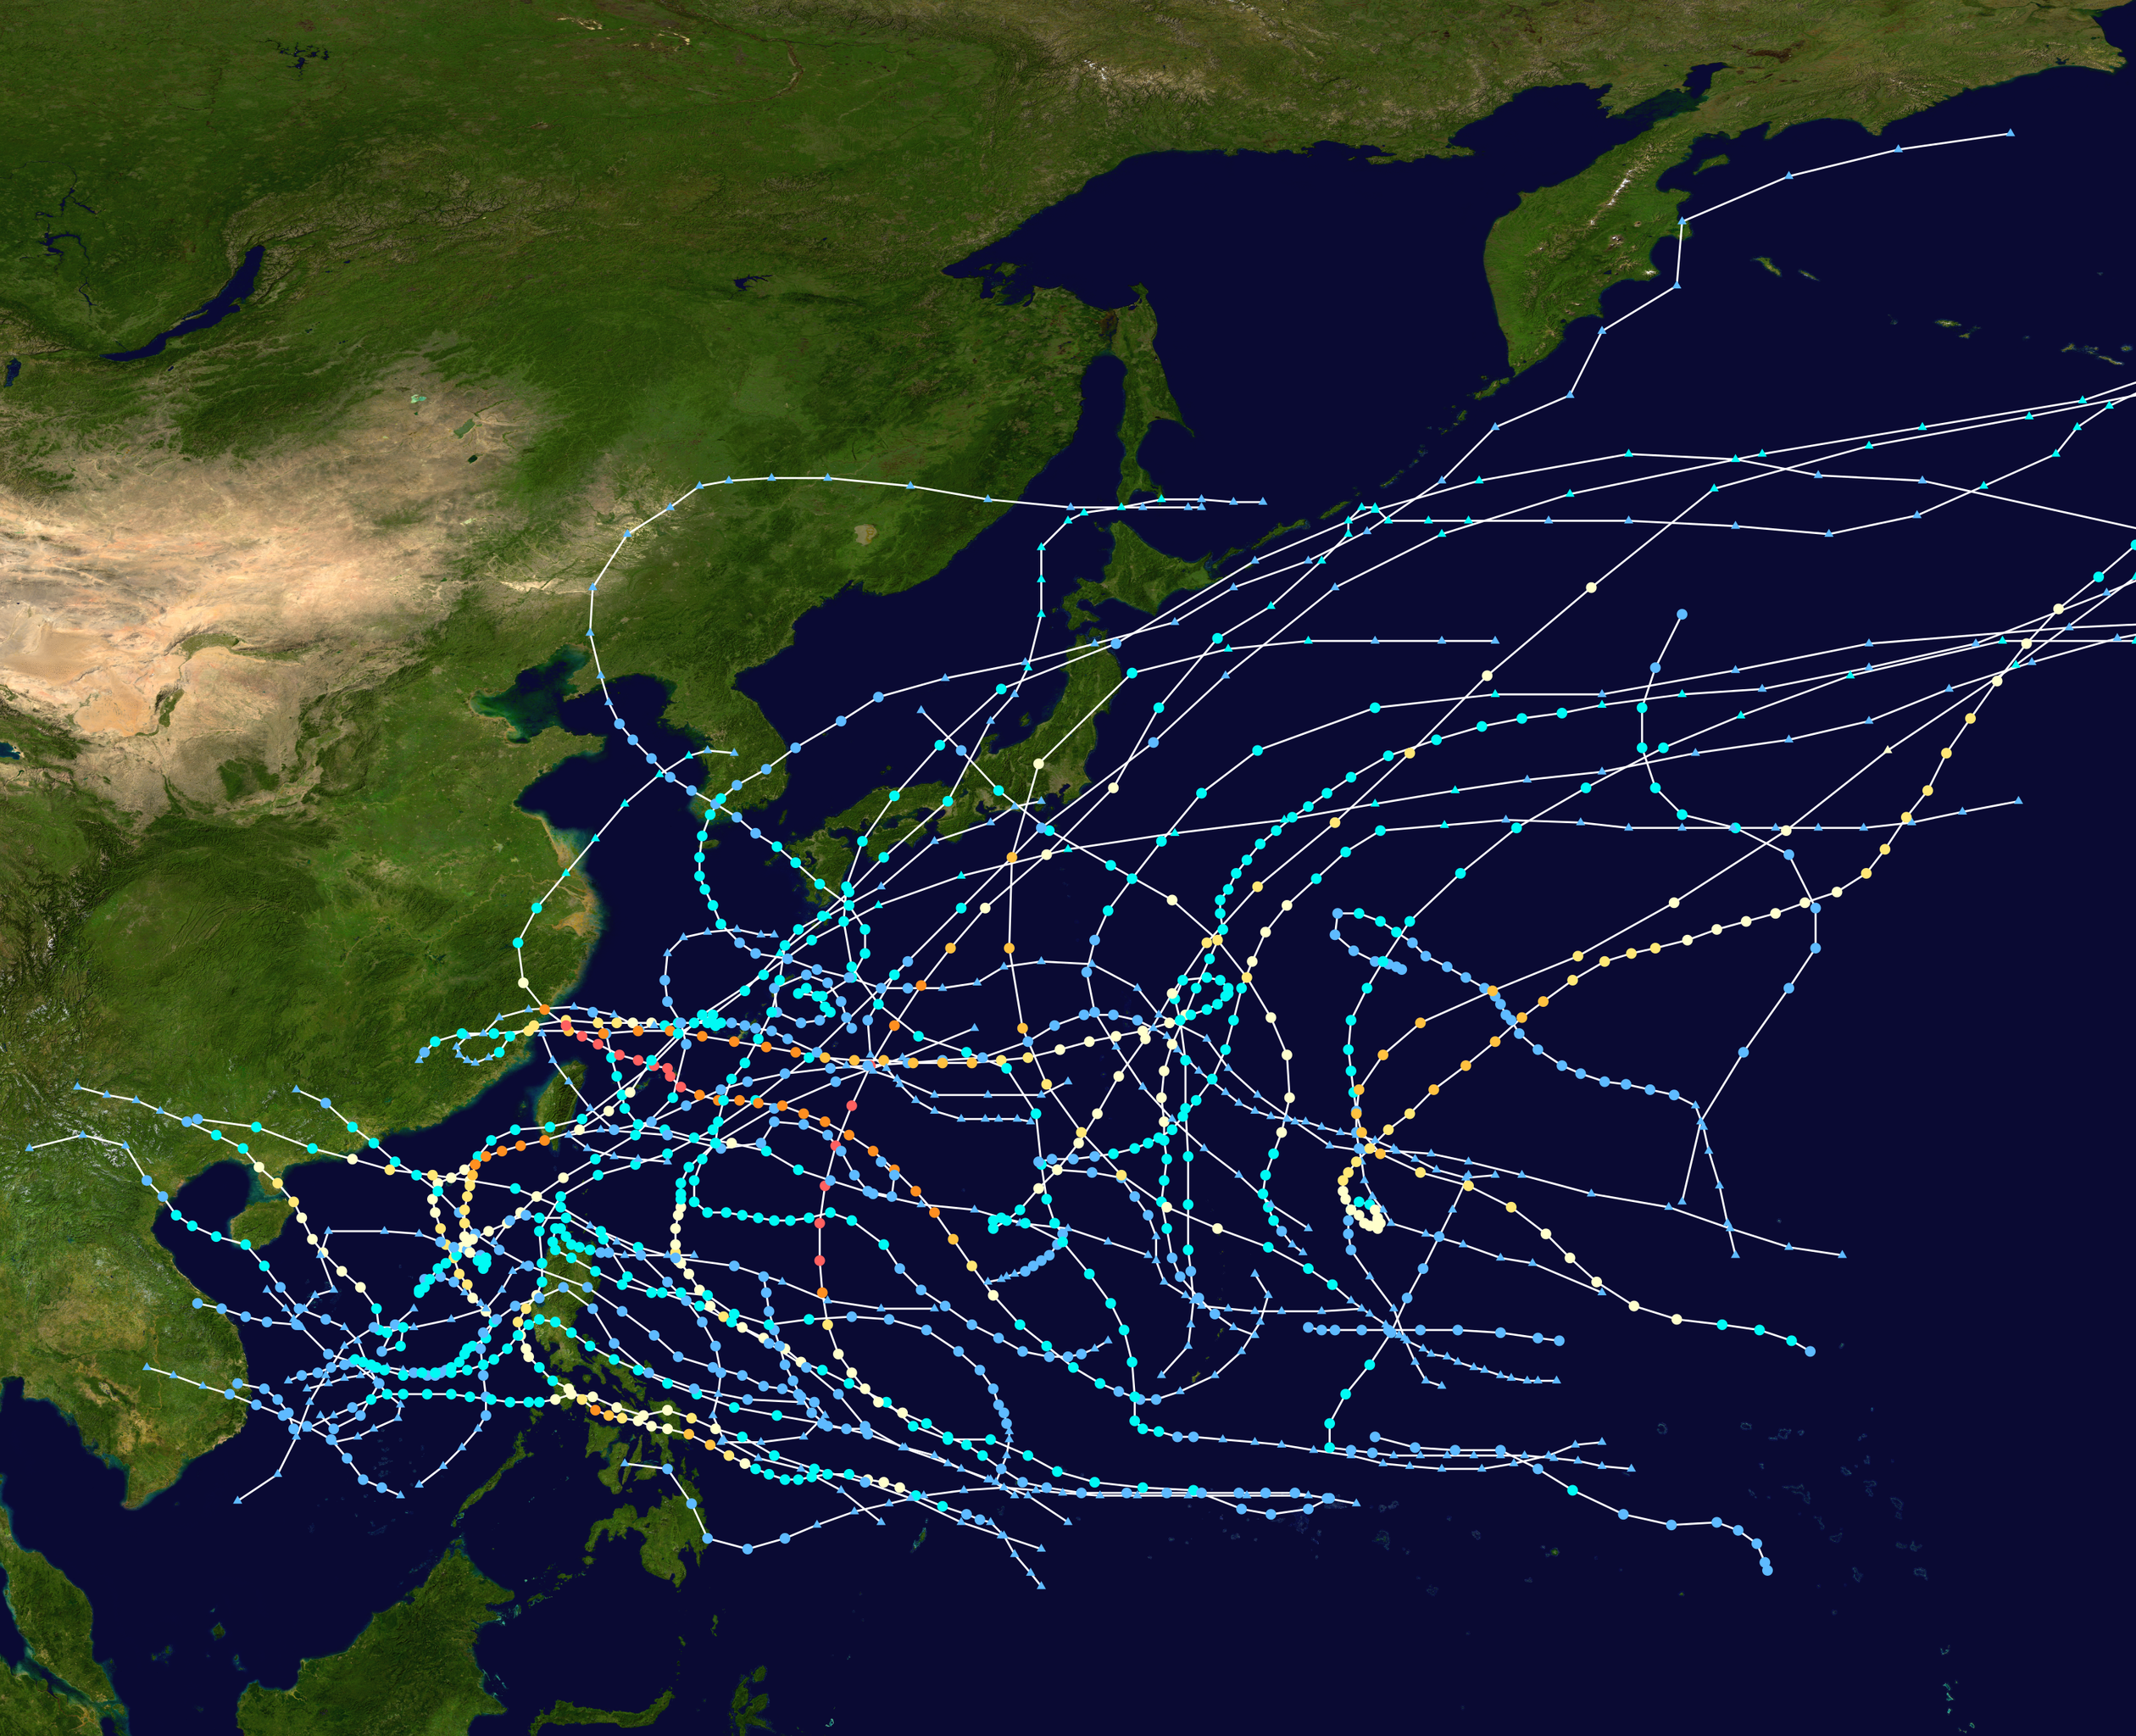
| คำอธิบาย1966 Pacific typhoon season summary map.png | English: This map shows the tracks of all tropical cyclones in the 1966 Pacific typhoon season. The points show the location of each storm at 6-hour intervals. The colour represents the storm's maximum sustained wind speeds as classified in the Saffir-Simpson Hurricane Scale (see below), and the shape of the data points represent the type of the storm. Storm type |
| แหล่งที่มา | Created using Wikipedia:WikiProject Tropical cyclones/Tracks. The background image is from NASA [1]. The tracking data |
| ผู้สร้างสรรค์ | Supportstorm |
 | This file may be updated to reflect new information. If you wish to use a specific version of the file without new updates being mirrored, please upload the required version as a separate file. |
| Public domainPublic domainfalsefalse |
| งานนี้ได้ถูกเผยแพร่สู่สาธารณสมบัติโดยเจ้าของ Supportstorm ซึ่งมีผลทั่วโลก ในบางประเทศ การกระทำดังกล่าวอาจไม่สามารถทำได้ตามกฎหมาย Supportstorm อนุญาตให้ทุกคนมีสิทธิ์ในการใช้ไฟล์นี้ในทุกเหตุผลการใช้ โดยไม่มีมีเงื่อนไข เว้นแต่กฎหมายไม่อนุญาตให้ทำเช่นนั้น |
คลิกวันที่/เวลาเพื่อดูไฟล์ที่ปรากฏในขณะนั้น
| วันที่/เวลา | รูปย่อ | ขนาด | ผู้ใช้ | ความเห็น | |
|---|---|---|---|---|---|
| ปัจจุบัน | 10:29, 12 มกราคม 2558 | | 3,000 × 2,438 (5.85 เมกะไบต์) | Supportstorm | {{Hurricane season auto track map|start=|end=|source=IBTrACS|type=typhoon|basin=Pacific|year=1966|author=Supportstorm}} |
หน้าต่อไปนี้ โยงมาที่ภาพนี้:
วิกิอื่นต่อไปนี้ใช้ไฟล์นี้: