The demographics of Japan include Japanese population, birth and death rates, age distribution, population density, ethnicity, education level, healthcare system of the populace, economic status, religious affiliations, and other aspects regarding the population. According to the United Nations, the population of Japan was roughly 124.9 million people (as of January 2021), which peaked at 128.1 million people in 2010.[4] It the 6th-most populous country in Asia, and the 11th-most populous country in the world.
| Demographics of Japan | |
|---|---|
 Population pyramid, 2021 | |
| Population | 123,990,000[1] (11th) |
| Growth rate | -0.7% (2020 est.) |
| Birth rate | 6.6 births/1,000 population (2023 est.) |
| Death rate | 11.7 deaths/1,000 population (2023 est.) |
| Life expectancy | 84.83 years |
| • male | 81 years |
| • female | 87 years |
| Fertility rate | |
| Infant mortality rate | 1.9 deaths/1,000 live births |
| Net migration rate | 0.74 migrant(s)/1,000 population |
| Age structure | |
| 0–14 years | |
| 15–64 years | |
| 65 and over | |
| Sex ratio | |
| Total | 0.95 male(s)/female (2022 est.) |
| At birth | 1.06 male(s)/female |
| Nationality | |
| Nationality | Japanese |
| Major ethnic | Japanese |


In 2023, the median age of Japanese people was projected to be 49.5 years, the highest level since 1950, compared to 29.5 for India, 38.8 for the United States and 39.8 for China. Japan has the second highest median age in the world (behind only Monaco). An improved quality of life and regular health checks are just two reasons why Japan has one of the highest life expectancies in the world.
The life expectancy from birth in Japan improved significantly after World War II, rising 20 years in the decade between 1945 and 1955. As life expectancy rises further, Japan expects to experience difficulties caring for the older generations in the future. Shortages in the service sector are already a major concern, with demand for nurses and care workers increasing.
The fertility rate among Japanese women was around 1.4 children per woman from 2010 to 2018. From then until 2022, the fertility rate further declined to 1.2. Apart from a small baby boom in the early 1970s, the crude birth rate in Japan has been declining since 1950; it reached its currently lowest point of 6.6 births per thousand people in 2023. With a falling birth rate and a large share of its inhabitants reaching old age, Japan's total population is expected to continue declining, a trend that has been seen since 2010.
Japanese is a major language of the Japonic language family spoken by Japanese people, which is separated into several dialects with the Tokyo dialect considered Standard Japanese. It has around 128 million speakers in total, primarily in Japan, the only country where it is the national language, and within the Japanese diaspora across the globe.
The sex ratio in Japan in 2021 was 95.38 males per 100 females. There are 61.53 million males and 64.52 million females in Japan. The percentage of female population is 51.18%, compared to 48.82% male population. Japan has 2.98 million more females than males.
| Year | Pop. | ±% |
|---|---|---|
| 1920 | 55,963,053 | — |
| 1925 | 59,736,822 | +6.7% |
| 1930 | 64,450,005 | +7.9% |
| 1935 | 69,254,148 | +7.5% |
| 1940 | 73,114,308 | +5.6% |
| 1945 | 71,998,104 | −1.5% |
| 1950 | 83,199,637 | +15.6% |
| 1955 | 89,275,529 | +7.3% |
| 1960 | 93,418,501 | +4.6% |
| 1965 | 98,274,961 | +5.2% |
| 1970 | 103,720,060 | +5.5% |
| 1975 | 111,939,643 | +7.9% |
| 1980 | 117,060,396 | +4.6% |
| 1985 | 121,048,923 | +3.4% |
| 1990 | 123,611,167 | +2.1% |
| 1995 | 125,570,246 | +1.6% |
| 2000 | 126,925,843 | +1.1% |
| 2005 | 127,767,994 | +0.7% |
| 2010 | 128,057,352 | +0.2% |
| 2015 | 127,094,745 | −0.8% |
| 2020 | 126,226,568 | −0.7% |
Historical overview
As of 2017, Japan was the world's eleventh-most populous country. The total population had declined by 0.8 percent from the time of the census five years previously, the first time it had declined since the 1945 census.[5]
Since 2010, Japan has experienced net population loss due to falling birth rates and minimal immigration, despite having one of the highest life expectancies in the world, at 85.00 years as of 2016[update] (it stood at 81.25 as of 2006).[6] Using the annual estimate for October of each year, the population peaked in 2008 at 128,083,960 and had fallen by 2,983,352 by October 2021.[7]
Based on 2012 data from the National Institute of Population and Social Security Research, Japan's population will keep declining by about one million people every year in the coming decades, which would leave it with a population of around 70 million by 2060 and 42 million by early 22nd century if the current projections do not change.[8] More than 40% of the population is expected to be over the age of 65 in 2060.[9] In 2021 the population had for fifteen consecutive years declined by 644,000 on this year, the largest drop on record since 1945 and also reflecting a record low of 831,000 births. As of 2013[update] more than 20 percent of the population of Japan were aged 65 and over.[10]
The population consisted of 47,062,743 households, with 78.7% in urban areas (July 2000). High population density; 329.5 people per square kilometer for total area; 1,523 persons per square kilometer for habitable land. More than 50% of the population lives on 2% of the land. (July 1993).[11] According to research in 2009, the population to land density ratio has gradually increased, now at 127 million per 337 km2. Compared to the findings of July 1993 as well as in July 2000, the population density has greatly increased, from 50% of the population living on 2% of the land to 77%. However, as the years have progressed since the last recordings of the population, Japan's population has decreased, raising concern about the future of Japan. There are many causes, such as the declining birthrates, as well as the ratio of men to women since the last measurements from the years of 2006 and 2010. According to the Japanese Health Ministry, the population is estimated to drop from its current state of 125.58 million to 86.74 million by the year 2060.[12]
Japan dropped from the 7th most populous country in the world to 8th in 1990, to 9th in 1998, to 10th in the early 21st century, and to 11th in 2020.[13][14] Over the period of 2010 to 2015, the population shrank by almost a million,[15] and Japan lost a half-million in 2022 alone.[16] The number of Japanese citizens decreased by 801,000 to 122,423,038 in 2022 from a year earlier, which was the most severe decrease and the first time all 47 prefectures have suffered a decline since the launch of the poll in 1968. The nation's population reached 128,057,352 Japanese people by early 2010. However, the long-lasting effects of Japanese economic crisis during the Great Recession strongly slowed down immigration rates in Japan in 2010s.
In March 2011, Japan suffered from a massive earthquake and tsunami and the subsequent Fukushima nuclear disaster, resulting 16,146 deaths, a reduction of about 1.39 years in the average life expectancy, an ultimate decrease in birth rates, and a marked decrease in immigration rates following the natural disasters, worst since the end of World War II.
According to studies from the Institute for Health Metrics and Evaluation, from January 2020 to the end of September 2021 as a direct effect of COVID-19 pandemic, Japan has registered 112,000 excess deaths, a loss of about 2.6 years in the average life expectancy, a noticeable decrease in birth rates and a marked decrease in immigration rates, the overall effect being a record natural population decline of 798,214 units[clarification needed] in that year, although excess mortality rates for all causes has been estimated at between 100,000 and 130,000 deaths. It is the largest ever recorded since 1914 (at the time of World War I, Spanish flu pandemic, and the Great Kanto earthquake).[citation needed]
According to a demographic study conducted by the Ministry of Internal Affairs and Communications, the Japanese population (including foreign residents) has declined from 128 million people in 2010 to 124.3 million people in 2023, with a decrease of almost 511,000 people in one year.[17][18]

Population
Population Projection

 Population pyramids of Japan 2065 (middle-birth, middle-death scenario case)[19]
 Japan demographic transition 1888–2019
.svg)

Census
Japan collects census information every five years, with censuses conducted by the Statistics Bureau of the Ministry of Internal Affairs.[20][21] The latest population census reflects the situation as of 2020.[21]
Population density
Japan's population density was 336 people per square kilometer as of 2014 (874 people per square mile) according to World Development Indicators. It ranks 35th in a list of countries by population density. Between 1955 and 1989, land prices in the six largest cities increased by 15,000% (+12% per year compound). Urban land prices generally increased 40% from 1980 to 1987; in the six largest cities, the price of land doubled over that period. For many families, this trend put housing in central cities out of reach.[11]
The result was lengthy commutes for many workers in the big cities, especially in the Tokyo area where daily commutes of two hours each way are common.[11] In 1991, as the bubble economy started to collapse, land prices began a steep decline, and within a few years fell 60% below their peak.[22] After a decade of declining land prices, residents began moving back into central city areas (especially Tokyo's 23 wards), as evidenced by 2005 census figures. Despite nearly 70% of Japan being covered by forests,[23] parks in many major cities—especially Tokyo and Osaka—are smaller and scarcer than in major West European or North American cities. As of 2014, parkland per inhabitant in Tokyo is 5.78 square meters,[24] which is roughly half of the 11.5 square meters of Madrid.[25]
National and regional governments devote resources to making regional cities and rural areas more attractive by developing transportation networks, social services, industry, and educational institutions to try to decentralize settlement and improve the quality of life. Nevertheless, major cities, especially Tokyo, Yokohama and Fukuoka, and to a lesser extent Kyoto, Osaka and Nagoya, remain attractive to young people seeking education and jobs.[11]
Urban distribution

KANTO, KEIHANSHIN and TOKAI are three largest metropolitan areas which have about 2/3 of total population of Japan. Out of 47 prefectures, 13 are red and 34 are green.
The population of Japan has been decreasing since 2011. Only 8 prefectures had increased its population compared to 2010, due to internal migration to large cities.
| External images | |
|---|---|
| Views of the World | |
 Japan Gridded Population Cartogram Japan Gridded Population Cartogram | |
| Japan Gridded Population |
Japan has a high population concentration in urban areas on the plains since 75% of Japan's land area is made up of mountains,[27] and also Japan has a forest cover rate of 68.5% (the only other developed countries with such a high forest cover percentage are Finland and Sweden).[23]The 2010 census shows 90.7% of the total Japanese population live in cities.[28]
Japan is an urban society with about only 5% of the labor force working in agriculture. Many farmers supplement their income with part-time jobs in nearby towns and cities. About 80 million of the urban population is heavily concentrated on the Pacific shore of Honshu.[29]
Metropolitan Tokyo-Yokohama, with its population of 35 million residents, is the world's most populous city. Japan faces the same problems that confront urban industrialized societies throughout the world: overcrowded cities and congested highways.
Age structure
Japan's population is aging faster than that of any other nation.[30] The population of those 65 years or older roughly doubled in 24 years, from 7.1% of the population in 1970 to 14.1% in 1994. The same increase took 61 years in Italy, 85 years in Sweden, and 115 years in France.[31] In 2014, 26% of Japan's population was estimated to be 65 years or older,[32] and the Health and Welfare Ministry has estimated that over-65s will account for 40% of the population by 2060.[33] The demographic shift in Japan's age profile has triggered concerns about the nation's economic future and the viability of its welfare state.[34]
 1888
1888 1920 (1st national census of population)
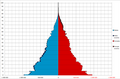 1925 (2nd national census of population)
 1930 (3rd national census of population)
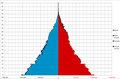 1935 (4th national census of population)
 1940 (5th national census of population)
 1947 (6th national census of population)
 1950 (7th national census of population)
 1955 (8th national census of population)
 1960 (9th national census of population)
 1965 (10th national census of population)
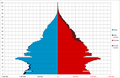 1970 (11th national census of population)
 1975 (12th national census of population)
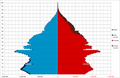 1980 (13th national census of population)
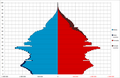 1985 (14th national census of population)
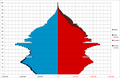 1990 (15th national census of population)
 1995 (16th national census of population)
 2000 (17th national census of population)
 2005 (18th national census of population)
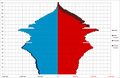 2010 (19th national census of population)
 2015 (20th national census of population)
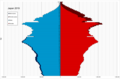 2019 estimate
 Live births and deaths of Japan (1946–2019)


.png)
- Population pyramids of Japans prefectures in 2020
 Tokyo
Tokyo Nagasaki
 Hiroshima
 Hokkaido
 Kyoto
Kyoto Aichi
Aichi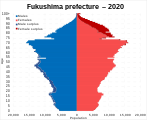 Fukushima
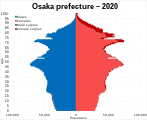 Osaka
Osaka Okinawa
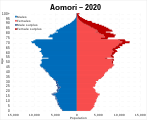 Aomori
 Akita
Akita Chiba
Chiba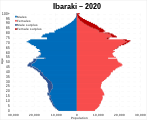 Ibaraki
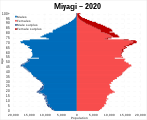 Miyagi
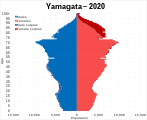 Yamagata
 Iwate
Iwate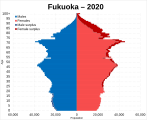 Fukuoka
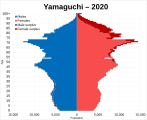 Yamaguchi
 Saga
Saga Okayama
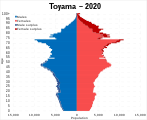 Toyama
 Hyogo
Hyogo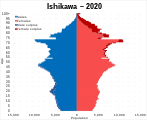 Ishikawa
 Niigata
 Fukui
Fukui Ehime
Ehime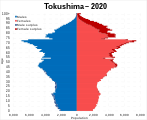 Tokushima
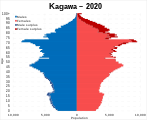 Kagawa
 Miyazaki
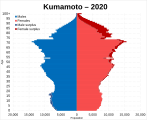 Kumamoto
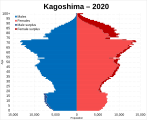 Kagoshima
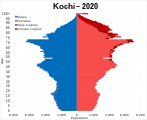 Kochi
Kochi Yamanashi
 Oita
Oita Kanagawa
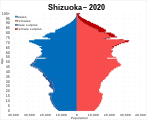 Shizuoka
 Mie
Mie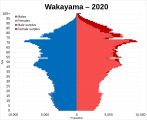 Wakayama
 Saitama
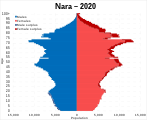 Nara
Nara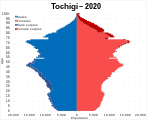 Tochigi
 Nagano
 Gunma
Gunma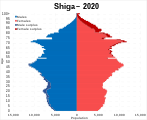 Shiga
Shiga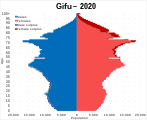 Gifu
Gifu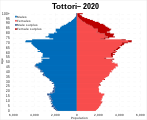 Tottori
 Shimane


| Year | Total population (census; in thousands) | Population by age (%) | ||
|---|---|---|---|---|
| 0–14 | 15–64 | 65+ | ||
| 1935 | 69,254 | 36.9 | 58.5 | 4.7 |
| 1940 | 73,114 | 36.1 | 59.2 | 5.7 |
| 1945 | 71,998 | 36.8 | 58.1 | 5.1 |
| 1950 | 83,199 | 35.4 | 59.6 | 4.9 |
| 1955 | 89,275 | 33.4 | 61.2 | 5.3 |
| 1960 | 93,418 | 30.2 | 64.1 | 5.7 |
| 1965 | 98,274 | 25.7 | 68.0 | 6.3 |
| 1970 | 103,720 | 24.0 | 68.9 | 7.1 |
| 1975 | 111,939 | 24.3 | 67.7 | 7.9 |
| 1980 | 117,060 | 23.5 | 67.3 | 9.1 |
| 1985 | 121,048 | 21.5 | 68.2 | 10.3 |
| 1990 | 123,611 | 18.2 | 69.5 | 12.0 |
| 1995 | 125,570 | 15.9 | 69.4 | 14.5 |
| 2000 | 126,925 | 14.6 | 67.9 | 17.3 |
| 2005 | 127,767 | 13.7 | 65.8 | 20.1 |
| 2010 | 128,057 | 13.2 | 63.7 | 23.1 |
| 2015 | 127,094 | 12.6 | 60.7 | 26.6 |
| 2020 | 126,226 | 12.0 | 59.3 | 28.8 |
| Age group | Male | Female | Total | % |
|---|---|---|---|---|
| Total | 61 226 000 | 64 610 000 | 125 836 000 | 100 |
| 0–4 | 2 406 000 | 2 288 000 | 4 694 000 | 3.73 |
| 5–9 | 2 580 000 | 2 462 000 | 5 042 000 | 4.01 |
| 10–14 | 2 736 000 | 2 605 000 | 5 341 000 | 4.24 |
| 15–19 | 2 932 000 | 2 792 000 | 5 724 000 | 4.55 |
| 20–24 | 3 298 000 | 3 089 000 | 6 386 000 | 5.07 |
| 25–29 | 3 240 000 | 3 036 000 | 6 275 000 | 4.99 |
| 30–34 | 3 391 000 | 3 244 000 | 6 635 000 | 5.27 |
| 35–39 | 3 767 000 | 3 665 000 | 7 432 000 | 5.91 |
| 40–44 | 4 289 000 | 4 183 000 | 8 472 000 | 6.73 |
| 45–49 | 4 954 000 | 4 847 000 | 9 801 000 | 7.79 |
| 50–54 | 4 353 000 | 4 305 000 | 8 658 000 | 6.88 |
| 55–59 | 3 905 000 | 3 913 000 | 7 818 000 | 6.21 |
| 60–64 | 3 674 000 | 3 770 000 | 7 443 000 | 5.91 |
| 65–69 | 4 047 000 | 4 305 000 | 8 351 000 | 6.64 |
| 70–74 | 4 288 000 | 4 798 000 | 9 086 000 | 7.22 |
| 75–79 | 3 193 000 | 3 953 000 | 7 145 000 | 5.68 |
| 80–84 | 2 239 000 | 3 159 000 | 5 398 000 | 4.29 |
| 85–89 | 1 323 000 | 2 394 000 | 3 717 000 | 2.95 |
| 90–94 | 506 000 | 1 316 000 | 1 822 000 | 1.45 |
| 95–99 | 97 000 | 421 000 | 519 000 | 0.41 |
| 100+ | 10 000 | 66 000 | 76 000 | 0.06 |
| Age group | Male | Female | Total | Percent |
| 0–14 | 7 722 000 | 7 355 000 | 15 077 000 | 11.98 |
| 15–64 | 37 801 000 | 36 843 000 | 74 644 000 | 59.32 |
| 65+ | 15 703 000 | 20 412 000 | 36 115 000 | 28.70 |
Life expectancy
Sources: Our World In Data and the United Nations.
1865–1949
| Years | 1865 | 1870 | 1875 | 1880 | 1885 | 1890 | 1895 | 1900 | 1905 | 1910 | 1915 | 1920 | 1922 | 1927 | 1935 | 1945 | 1947 | 1948 | 1949 | 1950[36] |
|---|---|---|---|---|---|---|---|---|---|---|---|---|---|---|---|---|---|---|---|---|
| Life expectancy in Japan | 36.4 | 36.6 | 36.8 | 37.0 | 37.3 | 37.7 | 38.1 | 38.6 | 39.2 | 40.0 | 40.9 | 42.0 | 42.6 | 45.7 | 48.2 | 30.5 | 51.7 | 56.8 | 57.7 | 59.2 |
1950–2015


| Period | Life expectancy in years | Period | Life expectancy in years |
|---|---|---|---|
| 1950–1955 | 62.8 | 1985–1990 | 78.5 |
| 1955–1960 | 66.4 | 1990–1995 | 79.4 |
| 1960–1965 | 69.2 | 1995–2000 | 80.5 |
| 1965–1970 | 71.4 | 2000–2005 | 81.8 |
| 1970–1975 | 73.3 | 2005–2010 | 82.7 |
| 1975–1980 | 75.4 | 2010–2015 | 83.3 |
| 1980–1985 | 77.0 | 2015–2020 | 84.4 |
Source: UN World Population Prospects
Fertility
As of 2022, Japan's total fertility rate was 1.26, among the lowest in the world and far below the replacement rate of 2.1. Japanese Prime Minister Fumio Kishida has pledged to take urgent steps to tackle the country's declining birth rate, calling it "now or never" for Japan's aging society, and plans to double the budget for child-related policies by June and set up a new government agency in April.[citation needed]

 Number of births by age groups in Japan
![Map of East Asia by total fertility rate (TFR) in 2021. Japan's TFR in 2012 was estimated at 1.41 children per woman, increasing slightly from 1.32 in the 2001–05 period. In 2012, the highest TFR was 1.90, in Okinawa, and the lowest was 1.09, in Tokyo. TFR by prefecture for 2000–05, as well as future estimates, have been released.[37]](//upload.wikimedia.org/wikipedia/commons/thumb/5/55/Map_of_East_Asia_by_TFR_in_2021.png/300px-Map_of_East_Asia_by_TFR_in_2021.png) Map of East Asia by total fertility rate (TFR) in 2021. Japan's TFR in 2012 was estimated at 1.41 children per woman, increasing slightly from 1.32 in the 2001–05 period. In 2012, the highest TFR was 1.90, in Okinawa, and the lowest was 1.09, in Tokyo. TFR by prefecture for 2000–05, as well as future estimates, have been released.[37]
Map of East Asia by total fertility rate (TFR) in 2021. Japan's TFR in 2012 was estimated at 1.41 children per woman, increasing slightly from 1.32 in the 2001–05 period. In 2012, the highest TFR was 1.90, in Okinawa, and the lowest was 1.09, in Tokyo. TFR by prefecture for 2000–05, as well as future estimates, have been released.[37] TFR of Japan over time to 2016
![The percentage of births to unmarried women in selected countries, 1980 and 2007.[38] As can be seen in the figure, Japan has not followed the trend of other industrialized countries of children born outside of marriage to the same degree.](//upload.wikimedia.org/wikipedia/commons/thumb/8/87/Percentage_of_birth_to_unmarried_women%2C_selected_countries%2C_1980_and_2007.png/300px-Percentage_of_birth_to_unmarried_women%2C_selected_countries%2C_1980_and_2007.png) The percentage of births to unmarried women in selected countries, 1980 and 2007.[38] As can be seen in the figure, Japan has not followed the trend of other industrialized countries of children born outside of marriage to the same degree.
The percentage of births to unmarried women in selected countries, 1980 and 2007.[38] As can be seen in the figure, Japan has not followed the trend of other industrialized countries of children born outside of marriage to the same degree.

![Map of East Asia by total fertility rate (TFR) in 2021. Japan's TFR in 2012 was estimated at 1.41 children per woman, increasing slightly from 1.32 in the 2001–05 period. In 2012, the highest TFR was 1.90, in Okinawa, and the lowest was 1.09, in Tokyo. TFR by prefecture for 2000–05, as well as future estimates, have been released.[37]](https://www.search.com.vn/wiki/en/File:Map_of_East_Asia_by_TFR_in_2021.png)

![The percentage of births to unmarried women in selected countries, 1980 and 2007.[38] As can be seen in the figure, Japan has not followed the trend of other industrialized countries of children born outside of marriage to the same degree.](https://www.search.com.vn/wiki/en/File:Percentage_of_birth_to_unmarried_women,_selected_countries,_1980_and_2007.png)
Sex ratio
| Age group | 2006 | 2020 |
|---|---|---|
| At birth | 1.05 | 1.06 |
| 0–15 | 1.05 | 1.06 |
| 15–64 | 1.01 | 1.01 |
| 65+ | 0.73 | 0.78 |
| Total | 0.95 | 0.94 |
Vital statistics
Live births, birth and death rates, overall fertility rate, and net change in Japan from 1899 to present. The statistics below do not include foreign nationalities.[39][40][41]
| Year | Average population (October 1) | Live births | Deaths | Natural change | Crude rates (per 100002) | Total fertility rate[32][42] | Net change | Infant mortality rate (per 1000 births) | Life expectancy[32] | ||||
|---|---|---|---|---|---|---|---|---|---|---|---|---|---|
| Births | Deaths | Natural change | Migration | Males | Females | ||||||||
| 1899 | 43,400,000 | 1,386,981 | 932,087 | 454,894 | 32.0 | 21.5 | 10.5 | 4.73 | 153.8 | ||||
| 1900 | 43,847,000 | 1,420,534 | 910,744 | 509,790 | 32.4 | 20.8 | 11.6 | -1.3 | 4.69 | 447,000 | 155.0 | ||
| 1901 | 44,359,000 | 1,501,591 | 925,810 | 575,781 | 33.9 | 20.9 | 13.0 | -1.3 | 5.01 | 512,1000 | 149.9 | ||
| 1902 | 44,964,000 | 1,510,853 | 959,126 | 551,709 | 33.6 | 21.3 | 12.3 | 1.3 | 4.97 | 605,000 | 154.0 | ||
| 1903 | 45,546,000 | 1,489,816 | 931,008 | 558,808 | 32.0 | 20.0 | 13.5 | -0.6 | 4.83 | 582,000 | 152.4 | ||
| 1904 | 46,135,000 | 1,440,371 | 955,400 | 484,971 | 30.6 | 21.2 | 10.7 | 2.2 | 4.61 | 589,000 | 151.9 | ||
| 1905 | 46,620,000 | 1,452,770 | 1,004,661 | 448,109 | 30.6 | 21.9 | 10.1 | 0.4 | 4.52 | 485,000 | 151.7 | ||
| 1906 | 47,038,000 | 1,394,295 | 955,256 | 439,039 | 29.0 | 20.0 | 10.6 | -1.6 | 4.38 | 418,000 | 153.6 | ||
| 1907 | 47,416,000 | 1,614,472 | 1,016,798 | 597,674 | 33.2 | 21.0 | 13.9 | -5.9 | 5.03 | 378,000 | 151.3 | ||
| 1908 | 47,965,000 | 1,662,815 | 1,029,447 | 633,368 | 33.7 | 20.9 | 14.5 | -2.9 | 5.13 | 549,000 | 158.0 | ||
| 1909 | 48,554,000 | 1,693,850 | 1,091,264 | 602,586 | 33.9 | 21.9 | 13.8 | -1.5 | 5.16 | 589,000 | 167.3 | ||
| 1910 | 49,184,000 | 1,712,857 | 1,064,234 | 648,623 | 33.9 | 21.1 | 14.5 | -1.5 | 5.01 | 630,000 | 161.2 | ||
| 1911 | 49,852,000 | 1,747,803 | 1,043,906 | 703,897 | 34.1 | 20.4 | 15.5 | -1.9 | 5.19 | 668,000 | 158.4 | ||
| 1912 | 50,577,000 | 1,737,674 | 1,037,016 | 700,658 | 33.4 | 20.0 | 15.3 | -0.8 | 5.08 | 725,000 | 154.2 | ||
| 1913 | 51,305,000 | 1,757,441 | 1,027,257 | 730,184 | 33.3 | 19.5 | 15.6 | -1.2 | 5.07 | 728,000 | 152.1 | ||
| 1914 | 52,039,000 | 1,808,402 | 1,101,815 | 706,587 | 33.8 | 20.6 | 14.9 | -0.6 | 5.14 | 734,000 | 158.5 | ||
| 1915 | 52,752,000 | 1,799,326 | 1,093,793 | 705,533 | 33.2 | 20.2 | 14.4 | -0.7 | 4.91 | 713,000 | 160.4 | ||
| 1916 | 53,496,000 | 1,804,822 | 1,187,832 | 616,990 | 32.9 | 21.6 | 12.7 | 1.4 | 4.98 | 744,000 | 170.3 | ||
| 1917 | 54,134,000 | 1,812,413 | 1,199,669 | 612,744 | 32.7 | 21.6 | 12.5 | -0.6 | 4.95 | 738,000 | 173.2 | ||
| 1918 | 54,739,000 | 1,791,992 | 1,493,162 | 298,830 | 32.2 | 26.7 | 6.4 | 4.8 | 4.83 | 605,000 | 188.6 | ||
| 1919 | 55,033,000 | 1,778,685 | 1,281,965 | 496,720 | 31.6 | 22.8 | 10.2 | -4.8 | 4.77 | 294,000 | 170.5 | ||
| 1920 | 55,963,053 | 2,025,564 | 1,422,096 | 603,468 | 36.2 | 25.4 | 12.0 | 4.9 | 5.35 | 930,053 | 165.7 | ||
| 1921 | 56,666,000 | 1,990,876 | 1,288,570 | 702,306 | 35.1 | 22.7 | 12.4 | 0.2 | 5.22 | 702,947 | 168.3 | ||
| 1922 | 57,390,000 | 1,969,314 | 1,286,941 | 682,373 | 34.3 | 22.4 | 11.9 | 0.9 | 5.12 | 724,000 | 166.4 | ||
| 1923 | 58,119,000 | 2,043,297 | 1,332,485 | 710,812 | 35.2 | 22.9 | 12.2 | 0.5 | 5.26 | 729,000 | 163.4 | ||
| 1924 | 58,876,000 | 1,998,520 | 1,254,946 | 743,574 | 33.9 | 21.3 | 12.6 | 0.4 | 5.07 | 757,000 | 156.2 | ||
| 1925 | 59,736,822 | 2,086,091 | 1,210,706 | 875,395 | 34.9 | 20.3 | 14.5 | 0.1 | 5.10 | 860,822 | 142.4 | ||
| 1926 | 60,741,000 | 2,104,405 | 1,160,734 | 943,671 | 34.6 | 19.1 | 15.5 | 1.3 | 5.19 | 1,004,178 | 137.5 | ||
| 1927 | 61,659,300 | 2,060,737 | 1,214,323 | 846,414 | 33.4 | 19.7 | 13.7 | 1.4 | 5.00 | 918,000 | 141.6 | ||
| 1928 | 62,595,300 | 2,135,852 | 1,236,711 | 899,141 | 34.1 | 19.8 | 14.4 | 0.8 | 5.09 | 936,000 | 136.7 | ||
| 1929 | 63,461,000 | 2,077,026 | 1,261,228 | 815,798 | 32.7 | 19.9 | 12.9 | 0.9 | 4.87 | 866,000 | 142.1 | ||
| 1930 | 64,450,005 | 2,085,101 | 1,170,867 | 914,234 | 32.4 | 18.2 | 14.2 | 1.4 | 4.70 | 989,005 | 124.1 | ||
| 1931 | 65,457,500 | 2,102,784 | 1,240,891 | 861,893 | 32.1 | 19.0 | 13.2 | 2.4 | 4.76 | 1,006,995 | 131.5 | ||
| 1932 | 66,433,800 | 2,182,742 | 1,175,344 | 1,007,398 | 32.9 | 17.7 | 15.2 | -0.3 | 4.86 | 343,000 | 117.5 | ||
| 1933 | 67,431,600 | 2,121,253 | 1,193,987 | 927,266 | 31.5 | 17.7 | 13.8 | 1.2 | 4.63 | 990,000 | 121.3 | ||
| 1934 | 68,308,900 | 2,043,783 | 1,234,684 | 809,099 | 29.9 | 18.1 | 11.9 | 1.1 | 4.39 | 890,000 | 124.8 | ||
| 1935 | 69,254,148 | 2,190,704 | 1,161,936 | 1,028,768 | 31.6 | 16.8 | 14.9 | -1.1 | 4.59 | 574,148 | 106.7 | ||
| 1936 | 70,113,600 | 2,101,969 | 1,230,278 | 871,691 | 30.0 | 17.5 | 12.4 | 0 | 4.34 | 345,852 | 116.7 | 46.92 | 49.63 |
| 1937 | 70,630,400 | 2,180,734 | 1,207,899 | 972,835 | 30.9 | 17.1 | 13.7 | -6.3 | 4.45 | 770,000 | 105.8 | ||
| 1938 | 71,012,600 | 1,928,321 | 1,259,805 | 668,516 | 27.2 | 17.7 | 9.4 | -4.0 | 3.88 | 230,000 | 114.4 | ||
| 1939 | 71,379,700 | 1,901,573 | 1,268,760 | 632,813 | 26.6 | 17.8 | 8.8 | -3.6 | 3.80 | 340,000 | 106.2 | ||
| 1940 | 71,993,000 | 2,115,867 | 1,186,595 | 929,272 | 29.4 | 16.4 | 12.9 | -4.3 | 4.11 | 2,184,308 | 90.0 | ||
| 1941 | 71,678,000 | 2,277,283 | 1,149,559 | 1,127,724 | 31.1 | 15.7 | 15.4 | -19.8 | 4.36 | -364,308 | 84.1 | ||
| 1942 | 72,386,000 | 2,233,660 | 1,166,630 | 1,067,030 | 30.3 | 15.8 | 14.4 | -4.5 | 4.18 | 700,000 | 85.5 | ||
| 1943 | 72,887,700 | 2,253,535 | 1,213,811 | 1,039,724 | 30.3 | 16.3 | 13.9 | -7.0 | 4.11 | 530,000 | 86.6 | ||
| 1944 | 73,064,000 | 2,149,843 | 1,279,639 | 870,204 | 29.2 | 17.4 | 11.8 | -9.4 | 3.95 | -115,000 | |||
| 1945 | 71,998,104 | 1,685,583 | 2,113,798 | -428,215 | 23.2 | 29.2 | -5.9 | -8.7 | 3.11 | -1,866,896 | |||
| 1946 | 73,114,000 | 1,905,809 | 1,326,592 | 579,217 | 25.3 | 17.6 | 7.7 | 7.8 | 3.37 | 3,301,896 | |||
| 1947 | 78,101,000 | 2,678,792 | 1,138,238 | 1,540,554 | 34.3 | 14.6 | 19.7 | 48.5 | 4.541 | 2,725,000 | 76.7 | 50.06 | 53.96 |
| 1948 | 80,002,500 | 2,681,624 | 950,610 | 1,731,014 | 33.7 | 12.0 | 21.8 | 2.5 | 4.400 | 1,475,000 | 61.7 | 55.6 | 59.4 |
| 1949 | 81,772,600 | 2,696,638 | 945,444 | 1,751,194 | 33.2 | 11.6 | 21.5 | 0.6 | 4.316 | 1,800,000 | 62.5 | 56.2 | 59.8 |
| 1950 | 83,199,637 | 2,337,507 | 904,876 | 1,432,631 | 28.2 | 10.9 | 17.3 | 0.2 | 3.650 | 1,899,637 | 60.1 | 58.0 | 61.5 |
| 1951 | 84,541,000 | 2,137,689 | 838,998 | 1,298,691 | 25.4 | 10.0 | 15.4 | 0.7 | 3.262 | 1,035,363 | 57.5 | 59.57 | 62.97 |
| 1952 | 85,808,000 | 2,005,162 | 765,068 | 1,240,094 | 23.5 | 8.9 | 14.5 | 0.5 | 2.976 | 1,268,000 | 49.4 | 61.9 | 65.5 |
| 1953 | 86,981,000 | 1,868,040 | 772,547 | 1,095,493 | 21.5 | 8.9 | 12.6 | 1.1 | 2.695 | 1,192,000 | 48.9 | 61.9 | 65.7 |
| 1954 | 88,239,000 | 1,769,580 | 721,491 | 1,048,089 | 20.1 | 8.2 | 11.9 | 2.6 | 2.481 | 1,281,000 | 44.6 | 63.41 | 67.69 |
| 1955 | 89,275,529 | 1,730,692 | 693,523 | 1,037,169 | 19.4 | 7.8 | 11.7 | 0 | 2.370 | 1,299,529 | 39.8 | 63.60 | 67.75 |
| 1956 | 90,172,000 | 1,665,278 | 724,460 | 940,818 | 18.5 | 8.1 | 10.5 | -0.5 | 2.223 | 677,471 | 40.6 | 63.59 | 67.54 |
| 1957 | 90,928,000 | 1,566,713 | 752,445 | 814,268 | 17.3 | 8.3 | 9.0 | -0.6 | 2.043 | 781,000 | 40.0 | 63.24 | 67.60 |
| 1958 | 91,767,000 | 1,653,469 | 684,189 | 969,280 | 18.1 | 7.5 | 10.6 | -1.4 | 2.110 | 812,000 | 34.5 | 64.98 | 69.61 |
| 1959 | 92,641,000 | 1,626,088 | 689,959 | 936,129 | 17.6 | 7.5 | 10.1 | -0.6 | 2.039 | 888,000 | 33.7 | 65.21 | 69.88 |
| 1960 | 93,418,501 | 1,606,041 | 706,599 | 899,442 | 17.3 | 7.6 | 9.7 | -1.3 | 2.004 | 984,501 | 30.7 | 65.32 | 70.19 |
| 1961 | 94,287,000 | 1,589,372 | 695,644 | 893,728 | 17.0 | 7.4 | 9.6 | -0.3 | 1.961 | 1,524,499 | 28.6 | 66.03 | 70.79 |
| 1962 | 95,181,000 | 1,618,616 | 710,265 | 908,351 | 17.1 | 7.5 | 9.6 | -0.1 | 1.976 | 889,000 | 26.4 | 66.23 | 71.16 |
| 1963 | 96,156,000 | 1,659,521 | 670,770 | 988,751 | 17.4 | 7.0 | 10.4 | -0.2 | 2.005 | 980,000 | 23.2 | 67.21 | 72.34 |
| 1964 | 97,182,000 | 1,716,761 | 673,067 | 1,043,694 | 17.8 | 6.9 | 10.8 | -0.1 | 2.049 | 1,014,000 | 20.4 | 67.67 | 72.87 |
| 1965 | 98,274,961 | 1,823,697 | 700,438 | 1,123,259 | 18.7 | 7.1 | 11.5 | -0.3 | 2.139 | 448,961 | 18.5 | 67.74 | 72.92 |
| 1966 | 99,036,000 | 1,360,974 | 670,342 | 690,632 | 13.8 | 6.8 | 7.1 | 0.6 | 1.578 | 1,515,039 | 19.3 | 68.35 | 73.61 |
| 1967 | 100,196,000 | 1,935,647 | 675,006 | 1,260,641 | 19.4 | 6.7 | 12.7 | -1.0 | 2.226 | 935,000 | 14.9 | 68.91 | 74.15 |
| 1968 | 101,331,000 | 1,871,839 | 686,555 | 1,185,284 | 18.5 | 6.8 | 11.8 | -0.5 | 2.134 | 1,336,000 | 15.3 | 69.05 | 74.30 |
| 1969 | 102,536,000 | 1,889,815 | 693,787 | 1,196,028 | 18.5 | 6.8 | 11.7 | 0.2 | 2.131 | 1,111,000 | 14.2 | 69.18 | 74.67 |
| 1970 | 103,720,060 | 1,934,239 | 712,962 | 1,221,277 | 18.7 | 6.9 | 11.9 | -0.4 | 2.135 | 548,060 | 13.1 | 69.31 | 74.66 |
| 1971 | 105,145,000 | 2,000,973 | 684,521 | 1,316,452 | 19.1 | 6.5 | 12.6 | 1.1 | 2.157 | 1,976,940 | 12.4 | 70.17 | 75.58 |
| 1972 | 107,595,000 | 2,038,682 | 683,751 | 1,354,931 | 19.2 | 6.4 | 12.8 | 10.5 | 2.142 | 1,491,000 | 11.7 | 70.50 | 75.94 |
| 1973 | 109,104,000 | 2,091,983 | 709,416 | 1,382,567 | 19.2 | 6.5 | 12.7 | 1.3 | 2.140 | 1,521,000 | 11.3 | 70.70 | 76.02 |
| 1974 | 110,573,000 | 2,029,989 | 710,510 | 1,319,479 | 18.4 | 6.4 | 12.0 | 1.5 | 2.049 | 1,453,000 | 10.8 | 71.16 | 76.31 |
| 1975 | 111,939,643 | 1,901,440 | 702,275 | 1,199,165 | 17.0 | 6.3 | 10.7 | 1.7 | 1.909 | 1,777,643 | 10.0 | 71.73 | 76.89 |
| 1976 | 113,094,000 | 1,832,617 | 703,270 | 1,129,347 | 16.3 | 6.2 | 10.0 | 0.3 | 1.852 | 835,357 | 9.3 | 72.15 | 77.35 |
| 1977 | 114,165,000 | 1,755,100 | 690,074 | 1,065,026 | 15.4 | 6.1 | 9.4 | 0.1 | 1.800 | 1,097,000 | 8.9 | 72.69 | 77.95 |
| 1978 | 115,190,000 | 1,708,643 | 695,821 | 1,012,822 | 14.9 | 6.1 | 8.8 | 0.2 | 1.792 | 662,000 | 8.4 | 72.97 | 78.33 |
| 1979 | 116,155,000 | 1,642,580 | 689,664 | 952,916 | 14.2 | 6.0 | 8.2 | 0.2 | 1.769 | 962,000 | 7.9 | 73.46 | 78.89 |
| 1980 | 117,060,396 | 1,576,889 | 722,801 | 854,088 | 13.6 | 6.2 | 7.3 | 0.5 | 1.747 | 1,104,396 | 7.5 | 73.35 | 78.76 |
| 1981 | 117,902,000 | 1,529,455 | 720,262 | 809,193 | 13.0 | 6.1 | 6.9 | 0.3 | 1.741 | 621,604 | 7.1 | 73.79 | 79.13 |
| 1982 | 118,728,000 | 1,515,392 | 711,883 | 803,509 | 12.8 | 6.0 | 6.8 | 0.2 | 1.770 | 821,000 | 6.6 | 74.22 | 79.66 |
| 1983 | 119,536,000 | 1,508,687 | 740,038 | 768,649 | 12.7 | 6.2 | 6.5 | 0.3 | 1.800 | 796,000 | 6.2 | 74.20 | 79.78 |
| 1984 | 120,305,000 | 1,489,780 | 740,247 | 749,533 | 12.5 | 6.2 | 6.3 | 0.1 | 1.811 | 654,000 | 6.0 | 74.54 | 80.18 |
| 1985 | 121,049,000 | 1,431,577 | 752,283 | 679,294 | 11.9 | 6.3 | 5.6 | 0.6 | 1.764 | 755,923 | 5.5 | 74.78 | 80.48 |
| 1986 | 121,660,000 | 1,382,946 | 750,620 | 632,326 | 11.4 | 6.2 | 5.2 | -0.2 | 1.723 | 670,077 | 5.2 | 75.23 | 80.93 |
| 1987 | 122,239,000 | 1,346,658 | 751,172 | 595,486 | 11.1 | 6.2 | 4.9 | -0.1 | 1.690 | 863,000 | 5.0 | 75.61 | 81.39 |
| 1988 | 122,745,000 | 1,314,006 | 793,014 | 520,992 | 10.8 | 6.5 | 4.3 | -0.2 | 1.656 | 565,000 | 4.8 | 75.54 | 81.30 |
| 1989 | 123,205,000 | 1,246,802 | 788,594 | 458,208 | 10.2 | 6.4 | 3.7 | 0 | 1.572 | 609,000 | 4.6 | 75.91 | 81.77 |
| 1990 | 123,611,000 | 1,221,585 | 820,305 | 401,280 | 10.0 | 6.7 | 3.3 | 0 | 1.543 | 455,167 | 4.6 | 75.92 | 81.90 |
| 1991 | 124,101,000 | 1,223,245 | 829,797 | 393,448 | 9.9 | 6.7 | 3.2 | 0.8 | 1.533 | 511,833 | 4.4 | 76.11 | 82.11 |
| 1992 | 124,567,000 | 1,208,989 | 856,643 | 352,346 | 9.8 | 6.9 | 2.9 | 0.9 | 1.502 | 453,000 | 4.5 | 76.09 | 82.22 |
| 1993 | 124,928,000 | 1,188,282 | 878,532 | 309,750 | 9.6 | 7.1 | 2.5 | 0.4 | 1.458 | 431,000 | 4.3 | 76.25 | 82.51 |
| 1994 | 125,265,000 | 1,238,328 | 875,933 | 362,395 | 10.0 | 7.1 | 2.9 | -0.2 | 1.500 | 452,000 | 4.2 | 76.57 | 82.98 |
| 1995 | 125,570,000 | 1,187,064 | 922,139 | 264,925 | 9.6 | 7.4 | 2.2 | 0.2 | 1.423 | 213,000 | 4.3 | 76.38 | 82.85 |
| 1996 | 125,859,000 | 1,206,555 | 896,211 | 310,344 | 9.7 | 7.2 | 2.5 | -0.2 | 1.425 | 285,000 | 3.8 | 77.01 | 83.59 |
| 1997 | 126,157,000 | 1,191,665 | 913,402 | 278,263 | 9.5 | 7.3 | 2.2 | 0.2 | 1.388 | 300,000 | 3.7 | 77.19 | 83.82 |
| 1998 | 126,472,000 | 1,203,147 | 936,484 | 266,663 | 9.6 | 7.5 | 2.1 | 0.4 | 1.384 | 343,000 | 3.6 | 77.16 | 84.01 |
| 1999 | 126,767,000 | 1,177,669 | 982,031 | 195,638 | 9.4 | 7.8 | 1.6 | -0.1 | 1.342 | 231,000 | 3.4 | 77.10 | 83.99 |
| 2000 | 127,076,000 | 1,190,547 | 961,653 | 228,894 | 9.5 | 7.7 | 1.8 | 0.2 | 1.359 | 212,000 | 3.2 | 77.72 | 84.60 |
| 2001 | 127,291,000 | 1,170,662 | 970,331 | 200,331 | 9.3 | 7.7 | 1.6 | 1.3 | 1.334 | 306,000 | 3.1 | 78.07 | 84.93 |
| 2002 | 127,435,000 | 1,153,855 | 982,379 | 171,476 | 9.2 | 7.8 | 1.4 | -0.3 | 1.319 | 296,000 | 3.0 | 78.32 | 85.23 |
| 2003 | 127,619,000 | 1,123,610 | 1,014,951 | 108,659 | 8.9 | 8.0 | 0.9 | 0.5 | 1.291 | 273,000 | 3.0 | 78.36 | 85.33 |
| 2004 | 127,687,000 | 1,110,721 | 1,028,602 | 82,119 | 8.8 | 8.2 | 0.6 | -0.1 | 1.289 | 43,000 | 2.8 | 78.64 | 85.59 |
| 2005 | 127,768,000 | 1,062,530 | 1,083,796 | -21,266 | 8.4 | 8.6 | -0.2 | 0.8 | 1.260 | 12,000 | 2.8 | 78.56 | 85.52 |
| 2006 | 127,770,000 | 1,092,674 | 1,084,451 | 8,223 | 8.7 | 8.6 | 0.1 | -0.1 | 1.317 | 81,000 | 2.6 | 79.00 | 85.81 |
| 2007 | 127,771,000 | 1,089,818 | 1,108,334 | -18,516 | 8.6 | 8.8 | -0.2 | 0.2 | 1.337 | 147,000 | 2.6 | 79.19 | 85.99 |
| 2008 | 127,692,000 | 1,091,156 | 1,142,407 | -51,251 | 8.7 | 9.1 | -0.4 | -0.2 | 1.367 | 62,000 | 2.6 | 79.29 | 86.05 |
| 2009 | 127,510,000 | 1,070,036 | 1,141,865 | -71,829 | 8.5 | 9.1 | -0.6 | -0.8 | 1.368 | 2.4 | 79.59 | 86.44 | |
| 2010 | 127,557,000 | 1,071,305 | 1,197,014 | -125,709 | 8.5 | 9.5 | -1.0 | 5.3 | 1.387 | 2.3 | 79.64 | 86.39 | |
| 2011 | 127,299,000 | 1,050,807 | 1,253,068 | -202,261 | 8.3 | 9.9 | -1.6 | -0.4 | 1.393 | 2.3 | 79.44 | 85.90 | |
| 2012 | 127,115,000 | 1,037,232 | 1,256,359 | -219,127 | 8.2 | 10.0 | -1.8 | -0.4 | 1.405 | 2.2 | 79.93 | 86.37 | |
| 2013 | 127,098,000 | 1,029,817 | 1,268,438 | -238,621 | 8.2 | 10.1 | -1.9 | 0.2 | 1.427 | 2.1 | 80.19 | 86.56 | |
| 2014 | 127,083,000 | 1,003,609 | 1,273,025 | -269,416 | 8.0 | 10.1 | -2.1 | 0.4 | 1.423 | 80.48 | 86.77 | ||
| 2015 | 126,925,000 | 1,005,721 | 1,290,510 | -284,789 | 8.0 | 10.3 | -2.3 | 2.4 | 1.451 | 1.9 | 80.75 | 86.98 | |
| 2016 | 126,742,000 | 977,242 | 1,308,158 | -330,916 | 7.8 | 10.5 | -2.7 | 2.3 | 1.442 | 80.98 | 87.14 | ||
| 2017 | 126,619,000 | 946,146 | 1,340,567 | -394,421 | 7.6 | 10.8 | -3.2 | 2.2 | 1.428 | 1.9 | 81.09 | 87.26 | |
| 2018 | 126,549,000 | 918,397 | 1,362,482 | -444,085 | 7.4 | 11.0 | -3.6 | 2.3 | 1.416 | 81.25 | 87.32 | ||
| 2019 | 126,255,000 | 865,239 | 1,381,093 | -515,854 | 7.0 | 11.2 | -4.2 | 2.7 | 1.361 | 81.41 | 87.45 | ||
| 2020 | 125,846,000 | 840,832 | 1,372,648 | -531,816 | 6.8 | 11.1 | -4.3 | 1.1 | 1.330 | 81.64 | 87.74 | ||
| 2021 | 125,502,000 | 811,604 | 1,439,809 | -628,205 | 6.6 | 11.7 | -5.1 | 0 | 1.303 | 1.6 | 81.47 | 87.57 | |
| 2022 | 124,947,000 | 770,759 | 1,569,050 | -798,291 | 6.1 | 12.5 | -6.4 | 2.2 | 1.257 | 80.74 | 86.88 | ||
| 2023 | 124,190,213 | 727,000(e) | 1,590,503 | -863,503 | 1.20(e) | ||||||||
Current vital statistics
| Period | Live births | Deaths | Natural increase |
|---|---|---|---|
| January—February 2023 | 120,982 | 304,827 | -183,845 |
| January—February 2024 | 115,606 | 296,919 | -181,313 |
| Difference |
Migration
Internal migration
Between 6 million and 7 million people moved their residences each year during the 1980s. About 50% of these moves were within the same prefecture; the others were relocations from one prefecture to another. During Japan's economic development in the twentieth century, and especially during the 1950s and 1960s, migration was characterized by urbanization as people from rural areas in increasing numbers moved to the larger metropolitan areas in search of better jobs and education. Out-migration from rural prefectures continued in the late 1980s, but more slowly than in previous decades.[11]
In the 1980s, government policy provided support for new urban development away from the large cities, particularly Tokyo, and assisted regional cities to attract young people to live and work there. Regional cities offered familiarity to those from nearby areas, lower costs of living, shorter commutes, and, in general, a more relaxed lifestyle than could be had in larger cities. Young people continued to move to large cities, however, to attend universities and find work, but some returned to regional cities (a pattern known as U-turn) or to their prefecture of origin (referred to as "J-turn"), or even moved to a rural area for the first time ("I-turn").[11][45]
Government statistics show that in the 1980s significant numbers of people left the largest central cities (Tokyo and Osaka) to move to suburbs within their metropolitan areas. In 1988, more than 500,000 people left Tokyo, which experienced a net loss through migration of nearly 73,000 for the year. Osaka had a net loss of nearly 36,000 in the same year.[11]
With a decreasing total population, internal migration results in only eight prefectures showing an increase in population. These are Okinawa (2.9%), Tokyo (2.7%), Aichi (1.0%), Saitama (1.0%), Kanagawa (0.9%), Fukuoka (0.6%), Shiga (0.2%), and Chiba (0.1%).[46]
Emigration
About 663,300 Japanese were living abroad, approximately 75,000 of whom had permanent foreign residency, more than six times the number who had that status in 1975. More than 200,000 Japanese went abroad in 1990 for extended periods of study, research, or business assignments. As the government and private corporations have stressed internationalization, greater numbers of individuals have been directly affected, decreasing Japan's historical insularity. By the late 1980s, these problems, particularly the bullying of returnee children in schools, had become a major public issue both in Japan and in Japanese communities abroad.[11]
Cities with significant populations of Japanese nationals in 2015 included:
- Los Angeles, United States: 68,689
- Bangkok, Thailand: 48,700
- Shanghai, China: 46,115
- New York, United States: 44,636
- Singapore: 36,963
- London, United Kingdom: 36,721
- Sydney, Australia: 30,448
- Vancouver, Canada: 26,999
- Hong Kong: 26,869
- San Francisco, United States: 18,777
- Toronto, Canada: 13,410
Note: The above data shows the number of Japanese nationals living overseas. It was published by the Ministry of Foreign Affairs of Japan and relates to 2015.[47]
Immigration
According to the Japanese immigration centre, the number of foreign residents in Japan has steadily increased, and the number of foreign residents exceeded 2.8 million people in 2020.[48]
In 2020, the number of foreigners in Japan was 2,887,116. This includes 325,000 Filipinos, many of whom are married to Japanese nationals and possessing some degree of Japanese ancestry,[49][50] 208,538 Brazilians, the majority possessing some degree of Japanese ancestry,[50] 778,112 Chinese, 448,053 Vietnamese and 426,908 South Koreans. Chinese, Vietnamese, Koreans, Filipinos and Brazilians account for about 77% of foreign residents in Japan.
The current issue of the shrinking workforce in Japan alongside its aging population has resulted in a recent need to attract foreign labour to the country. Reforms which took effect in 2015 relax visa requirements for "Highly Skilled Foreign Professionals" and create a new type of residence status with an unlimited period of stay.
The number of naturalizations peaked in 2008 at 16,000, declining to over 9,000 in the most recent year for which data are available.[51] Most of the decline is accounted for by a steep reduction in the number of Japan-born Koreans taking Japanese citizenship. Historically the bulk of those taking Japanese citizenship have not been foreign-born immigrants but rather Japanese-born descendants of Koreans and Taiwanese who lost their citizenship in the Japanese Empire in 1947 as part of the American Occupation policy for Japan.
Japanese statistical authorities do not collect information on ethnicity, only nationality.[52] As a result, both native and naturalized Japanese citizens are counted in a single group.[53] Although official statistics therefore show homogeneity, other analyses describe the population as “multi-ethnic”.[54][55][56]
Languages
| Languages of Japan | |
|---|---|
| Official | None[57] |
| National | Standard Japanese |
| Main | Standard Japanese |
| Indigenous | Ainu |
| Regional | Japanese dialects, Amami-Ōshima, Kunigami, Miyako, Okinawan, Yaeyama, Yonaguni |
| Minority | Bonin English, Matagi, Nivkh, Orok, Sanka, Zainichi Korean |
| Immigrant | Chinese, Korean, Mongolian, Portuguese, Spanish |
| Foreign | Arabic, Bengali, Burmese, Chinese, Dutch, English, Filipino, French, German, Hindi, Indonesian, Italian, Khmer, Korean, Kurdish, Lao, Malay, Nepali, Persian, Portuguese, Russian, Spanish, Tamil, Thai, Turkish, Vietnamese |
| Signed | Japanese Sign Language Amami Oshima Sign Language Miyakubo Sign Language |
| Keyboard layout | |
In addition to the Japanese language, Ryūkyūan languages are spoken in Okinawa and parts of Kagoshima in the Ryūkyū Islands. Along with Japanese, these languages are part of the Japonic language family, but they are separate languages,[citation needed] and are not mutually intelligible with Japanese, or with each other. All of the spoken Ryukyuan languages are classified by UNESCO as endangered.
In Hokkaidō, there is the Ainu language, which is spoken by the Ainu people, who are the indigenous people of the island. The Ainu languages, of which Hokkaidō Ainu is the only extant variety, are isolated and do not fall under any language family. Ever since the Meiji period, Japanese has become widely used among the Ainu people and consequently Ainu languages have been classified critically endangered by UNESCO.[58]
In addition, languages such as Orok, Evenki and Nivkh spoken in formerly Japanese controlled southern Sakhalin are becoming more and more endangered. After the Soviet Union took control of the region, speakers of these languages and their descendants migrated to mainland Japan and still exist in small numbers.The Japanese society of Yamato people is linguistically homogeneous with small populations of Koreans (0.9 million), Chinese/Taiwanese (0.65 million), Filipino (306,000 some being Japanese Filipino; children of Japanese and Filipino parentage).[59] This can be also said for Brazilians (300,000, many of whom are ethnically Japanese) as well as Peruvians and Argentineans of both Latin American and Japanese descent.[citation needed] Japan has indigenous minority groups such as the Ainu and Ryukyuans, who generally speak Japanese.
Citizenship
Japanese citizenship is conferred jure sanguinis, and monolingual Japanese-speaking minorities often reside in Japan for generations under permanent residency status without acquiring citizenship in their country of birth, although legally they are allowed to do so. This is because Japanese law does not recognize dual citizenship after the age of adulthood, and so people becoming naturalized Japanese citizens must relinquish their previous citizenship upon reaching the age of 22 years [60][61]
In addition, people taking Japanese citizenship must take a name using one or more of the Japanese character sets (hiragana, katakana, kanji). Names written in the Western alphabet, Korean alphabet, Arabic characters, etc., are not acceptable as legal names. Chinese characters are usually legally acceptable as nearly all Chinese characters are recognized as valid by the Japanese government. Transliterations of non-Japanese names using katakana (e.g. スミス "Sumisu" for "Smith") are also legally acceptable.[citation needed]
However, some naturalizing foreigners feel that becoming a Japanese citizen should mean that they have a Japanese name and that they should abandon their foreign name, and some foreign residents do not wish to do this—although most Special Permanent Resident Koreans and Chinese already use Japanese names. Nonetheless, some 10,000 Zainichi Koreans naturalize every year. Approximately 98.6% of the population are Japanese citizens, and 99% of the population speak Japanese as their first language. Non-ethnic Japanese in the past, and to an extent in the present, also live in small numbers in the Japanese archipelago.[54]
Society
Lifestyle
Japanese people enjoy a high standard of living, and nearly 90% of the population consider themselves part of the middle class.[11] However, many studies on happiness and satisfaction with life tend to find that Japanese people average relatively low levels of life satisfaction and happiness when compared with most of the highly developed world; the levels have remained consistent if not declining slightly over the last half century.[62][63][64][65] Japanese have been surveyed to be relatively lacking in financial satisfaction.[66] The societal view generally disapproves of out-of-wedlock births and premarital pregnancies.[67]
Social isolation is a problem for a segment of Japanese society, with almost 500,000 young people belonging to this group, they are also known as hikikomori.[68]
The Japanese management working culture in Japan has led some to work-related deaths due to heart attack or stroke, this has led to the term karoshi (lit. "overwork death"). The government has received 200 claims of karoshi related work injuries each year, with some leading to suicide.[69]
Many Japanese lead a sexless marriage. Japan has the lowest level of couples having sex at 45 times per year, well below the global average of 103 times. With reasons of "tired" and "bored with intercourse" usually given as an answer.[70] Despite this, Japan ranks as number two globally on the amount spent on pornography, after South Korea.[71][72]
Marriages and divorce
- Marriage and divorce statistics
 Marriages in Japan over time
 Marriage rate per 1000 people in Japan
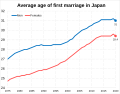 Average age of first marriage in Japan
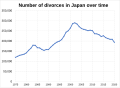 Number of divorces in Japan over time
 Divorce rates per 1000 of total population


Ethnic groups
Naturalized Japanese citizens and native-born Japanese nationals with a multi-ethnic background are all considered to be Japanese in the population census of Japan.[53]
Discrimination against ethnic minorities
Three native Japanese minority groups can be identified. The largest are the hisabetsu buraku or "discriminated communities", also known as the burakumin. These descendants of premodern outcast hereditary occupational groups, such as butchers, leatherworkers, funeral directors, and certain entertainers, may be considered a Japanese analog of India's Dalits. Historically, discrimination against these occupational groups was based on Buddhist prohibitions on killing and Shinto notions of pollution, and it was also a feature of governmental attempts to maintain social control.[11]
During the Edo period, such people were required to live in special buraku and, like the rest of the population, they were bound by sumptuary laws which were based on the inheritance of social class. The Meiji government abolished most of the derogatory names which were applied to these discriminated communities in 1871, but the new laws had little effect on the social discrimination which was faced by the former outcasts and their descendants. However, the laws eliminated the economic monopoly which they had on certain occupations.[11] The buraku continued to be treated as social outcasts and some casual interactions with the majority caste were perceived taboo until the era after World War II.
Estimates of their number range from 2 to 4 million (about 4% of the national population in 2022). Although the members of these marginalized communities are physically indistinguishable from other Japanese, most of them live in urban ghettoes or they live in the traditional special hamlets which are located in rural areas, and as a result, membership in a marginalized group can be surmised from the location of a family's home, a family's occupation, the dialect which a family speaks, or the mannerisms which a family uses when it communicates with people. Checks on the backgrounds of families which were designed to ferret out buraku were commonly performed as a condition of marriage arrangements and employment applications,[11] but in Osaka, they have been illegal since 1985.
Among the hisabetsu buraku, past and current discrimination against them has resulted in lower educational attainments and it has also resulted in a lower socioeconomic status, by contrast, the majority of Japanese have higher educational attainments and they also have a higher economic status. Movements with objectives which range from "liberation" to the encouragement of integration have attempted to change this situation,[11] with some success. Nadamoto Masahisa of the Buraku History Institute estimates that as of 1998, between 60 and 80% of burakumin marry a non-burakumin.[73]
Ryukyuans
One of the largest minority groups among Japanese citizens is the Ryukyuan people.[74] They are primarily distinguished by their use of several distinct Ryukyuan languages, though use of Ryukyuan is dying out.[75] The Ryukyuan people and language originated in the Ryukyu Islands, which are in Okinawa prefecture and Kagoshima Prefecture.
Ainu

The third largest minority group among Japanese citizens is the Ainu, whose language is an isolate. Historically, the Ainu were an indigenous hunting and gathering population who occupied most of northern Honshū as late as the Nara period (A.D. 710–94). As Japanese settlement expanded, the Ainu were pushed northward,[11] by the Tokugawa shogunate, the Ainu were pushed into the island of Hokkaido.[76]
Characterized as remnants of a primitive circumpolar culture, the fewer than 20,000 Ainu in 1990 were considered racially distinct and thus not fully Japanese. Disease and a low birth rate had severely diminished their numbers over the past two centuries, and intermarriage had brought about an almost completely mixed population.[11]
Although no longer in daily use, the Ainu language is preserved in epics, songs, and stories transmitted orally over succeeding generations. Distinctive rhythmic music and dances and some Ainu festivals and crafts are preserved, but mainly in order to take advantage of tourism.[11]
Hāfu
Hāfu (a kana rendition of "half") is a term used for people who are biracial and ethnically half Japanese. Of the one million children born in Japan in 2013, 2.2% had one or two non-Japanese parents.[70] According to the Japanese Ministry of Health, Labor and Welfare, one in forty-nine babies born in Japan today are born into families with one non-Japanese parent.[77] Most intermarriages in Japan are between Japanese men and women from other Asian countries, including China, the Philippines and South Korea.[78] Southeast Asia too, also has significant populations of people with half-Japanese ancestry, particularly in the Philippines, Indonesia, Malaysia, Singapore and Thailand.
In the 1940s, biracial Japanese children (Ainoko), specifically Amerasian children, encountered social problems such as poverty, perception of impurity and discrimination due to negative treatment in Japan.[79] In the 21st century, discrimination against hāfu occurs based on how different their identity, behavior and appearance is from a typical Japanese person.[80]
Foreign residents


In 2021, there were 2,887,116 foreign residents in Japan, representing 2.3% of the Japanese population.[81] Foreign Army personnel, of which there were up to 430,000 from the SCAP (post-occupation, United States Forces Japan) and 40,000 BCOF in the immediate post-war years, have not been at any time included in Japanese foreign resident statistics.[82] Most foreign residents in Japan come from Brazil or from other Asian countries, particularly from China, Vietnam, South Korea, the Philippines, and Nepal.[83][84]
A number of long-term resident Koreans in Japan today retain familial links with the descendants of Koreans,[85] that either immigrated voluntarily or were forcibly relocated during the Japanese Occupation of the Korea. Within this group, a number hold Special Permanent Resident status, granted under the terms of the Normalisation Treaty (22. June 1965) between South Korea and Japan.[86] In many cases special residents, despite being born in Japan and speaking Japanese, have chosen not to take advantage of the mostly automatic granting of citizenship to special resident applicants.[87]
Beginning in 1947 the Japanese government started to repatriate Korean nationals, who had nominally been granted Japanese citizenship during the years of military occupation. When the Treaty of San Francisco came into force many ethnic Koreans lost their Japanese citizenship from April 28, 1952, and with it the right to welfare grants, to hold a government job of any kind or to attend Japanese schools.[82] In the following year the government contrived, with the help of the Red Cross, a scheme to "repatriate" Korean residents, who mainly were from the Southern Provinces, to their "home" of North Korea.[88] Between 1959 and 1984 93,430 people used this route, of whom 6,737 were Japanese or Chinese dependents. Most of these departures – 78,276 – occurred before 1962.[89]

All non-Japanese without special residential status (people whose residential roots go back to before WWII) are required by law to register with the government and carry alien registration cards. From the early 1980s, a civil disobedience movement encouraged refusal of the fingerprinting that accompanied registration every five years.[11]
Opponents of fingerprinting argued that it was discriminatory because the only Japanese who were fingerprinted were criminals. The courts upheld fingerprinting, but the law was changed so that fingerprinting was done once rather than with each renewal of the registration,[11] which until a law reform in 1989 was usually required every six months for anybody from the age of 16. Those refusing fingerprinting were denied re-entry permits, thus depriving them of freedom of movement.
Of these foreign residents below, the new wave started in 2014 comes to Japan as students or trainees. These foreigners are registered under student visa or trainee visa, which gives them the student residency status. Most of these new foreigners are under this visa. Almost all of these foreign students and trainees will return to their home country after three to four years (one valid period); few students extend their visa. Vietnamese makes the largest increase, however Burmese, Cambodians, Filipinos and Chinese are also increasing.
Asian migrant wives of Japanese men have also contributed to the foreign-born population in the country. Many young single Japanese male farmers choose foreign wives, mainly from the Philippines, Thailand, China and South Korea, due to a lack of interest from Japanese women living a farming life.[91] Migrant wives often travel as mail-order brides as a result of arranged marriages with Japanese men.[92] Additionally, Japanese men in urban parts of the country have also begun marrying foreign Asian women.
| Country region groups | Number | Percentage of | |
|---|---|---|---|
| Foreign citizens | Total population | ||
| South Asians | 255,168 | 8.8% | 0.20% |
| Southeast Asians | 1,304,765 | 45.2% | 1.0% |
| Other East Asians | 1,301,610 | 45.1% | 1.0% |
| Europeans/North Americans | 84,916 | 2.9% | 0.05% |
| South Americans | 256,794 | 8.8% | 0.20% |
| Others (African, West Asian, etc.) | 635,787 | 23.6% | 0.50% |
| Total (as of 2022) | 2,887,116 | 100% | 2.3% |
| Country | 1990 | 2000[93] | 2005 | 2010 | 2011 | 2012[94] | 2014[95] | 2015[96] | 2017[97] | 2019[98] | 2020[48] | 2023[99] | Main article |
|---|---|---|---|---|---|---|---|---|---|---|---|---|---|
 China China | 137,499 | 335,575 | 519,561 | 687,156 | 674,879 | 652,555[100] | 654,777[100] | 665,847[100] | 711,486 | 813,675 | 778,112 | 821,838 | Chinese people in Japan |
 Vietnam Vietnam | 6,316 | 16,908 | 28,932 | 41,781 | 44,690 | 52,364 | 99,865 | 146,956 | 232,562 | 411,968 | 448,053 | 565,026 | Vietnamese people in Japan |
 South Korea South Korea | 681,838 | 635,269 | 598,687 | 565,989 | 545,401 | 530,046 | 501,230 | 457,772 | 452,953 | 446,364 | 426,908 | 410,156 | Koreans in Japan |
 Philippines Philippines | 38,925 | 144,871 | 187,261 | 210,181 | 209,376 | 209,974 | 217,585 | 229,595 | 251,934 | 282,798 | 279,660 | 322,046 | Filipinos in Japan |
 Brazil Brazil | 14,258 | 254,394 | 302,080 | 230,552 | 210,032 | 190,581 | 175,410 | 173,437 | 185,967 | 211,677 | 208,538 | 211,840 | Brazilians in Japan |
 Nepal Nepal | 399 | 3,649 | 6,953 | 17,525 | 20,383 | 24,069 | 42,346 | 54,775 | 74,300 | 96,824 | 95,982 | 176,336 | Nepalis in Japan |
 Indonesia Indonesia | 2,781 | 19,346 | 25,097 | 24,895 | 24,660 | 25,530 | 30,210 | 35,910 | 46,350 | 66,860 | 66,832 | 149,101 | Indonesians in Japan |
 Myanmar Myanmar | 894 | 4,851 | 5,342 | 8,577 | 8,692 | 8,045 | 10,252 | 13,737 | 20,346 | 32,049 | 35,049 | 86,546 | Burmese people in Japan |
 Taiwan Taiwan | 22,773 | 40,197 | 48,723 | 54,358 | 64,773 | 55,872 | 64,663 | Taiwanese people in Japan | |||||
 United States United States | 34,900 | 44,856 | 49,390 | 50,667 | 49,815 | 48,357 | 51,256 | 52,271 | 54,918 | 59,172 | 55,761 | 63,408 | Americans in Japan |
 Thailand Thailand | 5,542 | 29,289 | 37,703 | 41,279 | 42,750 | 40,130 | 43,081 | 45,379 | 48,952 | 54,809 | 53,379 | 61,771 | Thai people in Japan |
 Peru Peru | 4,121 | 46,171 | 57,728 | 54,636 | 52,842 | 49,248 | 47,978 | 47,721 | 47,861 | 48,669 | 48,256 | 52,564 | Peruvian migration to Japan |
 India India | 2,926 | 10,064 | 16,988 | 22,497 | 21,501 | 21,653 | 24,524 | 26,244 | 30,048 | 40,202 | 38,558 | 48,352 | Indians in Japan |
 Sri Lanka Sri Lanka | 1,064 | 5,655 | 9,013 | 9,097 | 9,303 | 8,427 | 10,741 | 13,152 | 20,716 | 27,367 | 29,290 | 46,949 | Sri Lankans in Japan |
 Bangladesh Bangladesh | 2,205 | 7,176 | 11,015 | 10,175 | 9,413 | 8,622 | 9,641 | 10,835 | 13,033 | 16,632 | 17,463 | 27,962 | Bangladeshis in Japan |
 Pakistan Pakistan | 1,875 | 7,498 | 8,789 | 10,299 | 10,849 | 10,597 | 11,802 | 12,708 | 14,312 | 17,766 | 19,103 | 25,334 | Pakistanis in Japan |
 Cambodia Cambodia | 1,148 | 1,761 | 2,263 | 2,683 | 2,770 | 2,862 | 4,090 | 6,111 | 9,598 | 15,020 | 16,659 | 23,750 | Cambodians in Japan |
 United Kingdom United Kingdom | 9,272 | 16,525 | 17,494 | 16,044 | 15,496 | 14,652 | 15,262 | 15,826 | 16,498 | 18,631 | 16,891 | 19,909 | Britons in Japan |
 Mongolia Mongolia | 23 | 1,209 | 3,762 | 4,949 | 4,774 | 4,837 | 5,796 | 6,590 | 8,364 | 12,797 | 13,504 | 19,490 | Mongolians in Japan |
 North Korea North Korea | 33,939 | 31,674 | 28,096 | 27,214 | 18,671 | Koreans in Japan | |||||||
 France France | 2,881 | 5,371 | 7,337 | 9,060 | 8,423 | 8,455 | 9,641 | 10,672 | 12,273 | 14,106 | 12,264 | 15,054 | French people in Japan |
 Malaysia Malaysia | 4,309 | 8,386 | 7,910 | 8,364 | 8,136 | 7,848 | 8,288 | 8,738 | 9,394 | 10,862 | 10,318 | 11,256 | |
 Canada Canada | 4,172 | 10,088 | 12,022 | 9,995 | 9,484 | 9,006 | 9,286 | 9,538 | 10,085 | 11,118 | 10,103 | 11,242 | |
 Russia Russia | 340[101] | 4,893 | 7,110 | 7,814 | 7,566 | 7,295 | 7,859 | 8,092 | 8,500 | 9,378 | 9,249 | 10,878 | Russians in Japan |
 Australia Australia | 3,073 | 9,188 | 11,277 | 9,756 | 9,166 | 8,888 | 9,350 | 9,843 | 9,981 | 12,024 | 9,758 | 10,649 | Australians in Japan |
 Germany Germany | 3,410 | 4,295 | 5,356 | 5,971 | 5,303 | 5,223 | 5,864 | 6,336 | 6,755 | 7,782 | 6,114 | 8,066 | Germans in Japan |
 Bolivia Bolivia | 238 | 3,915 | 6,139 | 5,720 | 5,567 | 5,283 | 5,333 | 5,412 | 5,657 | 6,096 | 6,119 | 6,505 | |
 Turkey Turkey | 190 | 1,424 | 2,275 | 2,547 | 2,613 | 2,528 | 3,654 | 4,157 | 5,167 | 5,419 | 6,212 | 6,070 | Turks in Japan |
 Uzbekistan Uzbekistan | 113 | 184 | 495 | 832 | 840 | 938 | 1,329 | 1,503 | 2,269 | 3,627 | 3,632 | 5,984 | Uzbeks in Japan |
 Italy Italy | 890 | 1,579 | 2,083 | 2,731 | 2,642 | 2,629 | 3,267 | 3,536 | 4,019 | 4,702 | 4,263 | 5,391 | Italians in Japan |
 Egypt Egypt | 703 | 776 | 823 | 945 | 1,013 | 1,362 | 1,794 | 2,334 | 2,750 | 3,247 | 3,816 | 4,783 | Egyptians in Japan |
 Iran Iran | 988 | 6,167 | 5,227 | 4,841 | 4,725 | 3,996 | 3,976 | 3,996 | 3,988 | 4,170 | 4,121 | 4,368 | Iranians in Japan |
 Ukraine Ukraine | 892 | 1,004 | 1,784 | 1,507 | 1,479 | 1,452 | 1,601 | 1,699 | 1,831 | 1,940 | 1,865 | 4,212 | |
 Spain Spain | 827 | 1,338 | 1,585 | 1,907 | 1,883 | 1,822 | 2,309 | 2,495 | 2,852 | 3,620 | 3,240 | 3,890 | |
 Laos Laos | 864 | 1,677 | 2,393 | 2,639 | 2,584 | 2,521 | 2,556 | 2,592 | 2,730 | 2,965 | 2,903 | 3,602 | |
 Hungary Hungary | 343 | 562 | 742 | 913 | 1,083 | 1,367 | 1,674 | 1,892 | 2,046 | 2,657 | 2,432 | 3,529 | |
 Mexico Mexico | 691 | 1,740 | 1,825 | 1,956 | 1,909 | 1,935 | 2,033 | 2,141 | 2,393 | 2,889 | 2,714 | 3,463 | |
 New Zealand New Zealand | 967 | 3,264 | 3,824 | 3,250 | 3,146 | 3,109 | 3,119 | 3,152 | 3,217 | 3,672 | 3,280 | 3,441 | |
 Argentina Argentina | 1,704 | 3,072 | 3,834 | 3,181 | 2,970 | 2,722 | 2,651 | 2,630 | 2,710 | 3,077 | 2,966 | 3,209 | |
 Singapore Singapore | 1,042 | 1,940 | 2,283 | 2,512 | 2,440 | 2,135 | 2,366 | 2,501 | 2,763 | 3,164 | 2,958 | 3,164 | |
 Afghanistan Afghanistan | 128 | 430 | 593 | 1,148 | 1,355 | 1,609 | 2,154 | 2,639 | 2,873 | 3,350 | 3,509 | 3,084 | |
 Nigeria Nigeria | 140 | 1,741 | 2,389 | 2,729 | 2,730 | 2,377 | 2,518 | 2,638 | 2,845 | 3,201 | 3,315 | 3,017 | Nigerians in Japan |
 Colombia Colombia | 373 | 2,496 | 2,902 | 2,606 | 2,505 | 2,253 | 2,244 | 2,268 | 2,366 | 2,509 | 2,482 | 2,723 | |
 Ghana Ghana | 518 | 1,657 | 1,824 | 1,883 | 1,729 | 1,915 | 2,005 | 2,235 | 2,404 | 2,506 | 2,005 | 2,534 | Ghanaians in Japan |
 Romania Romania | 42 | 2,449 | 3,574 | 2,409 | 2,281 | 2,185 | 2,245 | 2,408 | 2,367 | 2,332 | 2,250 | 2,284 | Romanians in Japan |
 Paraguay Paraguay | 672 | 1,678 | 2,287 | 2,098 | 1,984 | 1,878 | 1,841 | 1,880 | 2,040 | 2,188 | 2,131 | 2,215 | |
 Sweden Sweden | 586 | 1,158 | 1,136 | 1,553 | 1,579 | 1,677 | 1,874 | 1,805 | 1,736 | 1,754 | 1,514 | 1,775 | |
 Poland Poland | 359 | 742 | 870 | 978 | 951 | 1,007 | 1,110 | 1,653 | 1,434 | 1,605 | 1,408 | 1,762 | |
 Netherlands Netherlands | 749 | 904 | 1,079 | 1,099 | 1,097 | 917 | 1,044 | 1,129 | 1,351 | 1,595 | 1,294 | 1,705 | |
 South Africa South Africa | 108 | 353 | 564 | 570 | 553 | 542 | 613 | 691 | 873 | 1,035 | 1,020 | 1,345 | |
 Switzerland Switzerland | 980 | 907 | 971 | 1,089 | 1,011 | 937 | 986 | 1,023 | 1,139 | 1,189 | 1,076 | 1,306 | |
 Ireland Ireland | 671 | 974 | 1,094 | 1,061 | 1,065 | 1,072 | 998 | 1,026 | 1,142 | 1,290 | 1,128 | 1,268 | |
 Cameroon Cameroon | 6 | 100 | 214 | 343 | 365 | 328 | 454 | 473 | 627 | 857 | 1,059 | 1,173 | |
 Chile Chile | 263 | 652 | 712 | 680 | 657 | 607 | 625 | 639 | 691 | 940 | 886 | 1,128 | |
 Kenya Kenya | 118 | 328 | 467 | 546 | 542 | 503 | 609 | 695 | 778 | 789 | 803 | 1,022 | |
| Total foreign residents | 984,455 | 1,686,444 | 2,011,555 | 2,134,151 | 2,078,508 | 2,033,656 | 2,121,831 | 2,232,189 | 2,471,458 | 2,933,137 | 2,887,116 | 3,410,992 |
Foreign residents as of 2015
There was an increase of 110,358 foreign residents from 2014 to 2015. Vietnamese made the largest proportion of these new foreign residents, whilst Nepalese, Filipino, Chinese and Taiwanese are also significant in numbers. Together these countries makes up 91,126 or 82.6% of all new residents from 2014 to 2015. However, the majority of these immigrants will only remain in Japan for a maximum of five years, as many of them have entered the country in order to complete trainee programmes. Once they complete their programmes, they will be required to return to their home countries.[102]
As of December 2014 there were 2,121,831 foreigners residing in Japan, 677,019 of whom were long-term residents in Japan, according to national demographics figures. The majority of long-term residents were from Asia, totalling 478,953. Chinese made up the largest portion of them with 215,155, followed by Filipinos with 115,857, and Koreans with 65,711. Thai, Vietnamese, and Taiwanese long-term residents totaled 47,956, and those from other Asian countries totaled 34,274. The Korean figures do not include zainichi Koreans with tokubetsu eijusha ("special permanent resident") visas, of whom there were 354,503 (of a total of 358,409 of all nationalities with such visas). The total number of permanent residents had declined over the previous five years due to high cost of living.[95]
Foreign residents as of 2021
The number of foreign residents of Japan reached a high of 2.93 million in 2019 before falling to 2.76 million at the end of 2021.[103] The number of foreign workers was 1.46 million in 2018, 29.7% are in the manufacturing sector; 389,000 are from Vietnam and 316,000 are from China.[104]
On April 1, 2019, Japan's revised immigration law was enacted. The revision clarifies and better protects the rights of foreign workers. Japan formally accepts foreign blue-collar workers. This helps reduce labour shortage in certain sectors of the economy. The reform changes the status of foreign workers to regular employees and they can obtain permanent residence status. The reform includes a new visa status called tokutei gino (特定技能, "designated skills"). In order to qualify, applicants must pass a language and skills test (level N4 or higher of the Japanese-Language Proficiency Test). In the old "Technical Trainee programme" a foreign employee was tied to their employer. This caused numerous cases of exploitation. The revision gives foreign workers more freedom to leave and change their employer.[105]
- Japanese nationality data mapped in prefectures in 2020
 Japanese nationality (96.3% total)
![Foreign nationality (1.9% total)[t 1]](//upload.wikimedia.org/wikipedia/commons/thumb/4/45/Percentage_of_Japan_who_is_of_Foreign_nationality_in_2020.svg/162px-Percentage_of_Japan_who_is_of_Foreign_nationality_in_2020.svg.png) Foreign nationality (1.9% total)[t 1]
Foreign nationality (1.9% total)[t 1]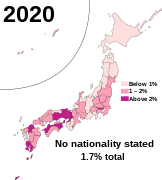 No nationality stated (1.7% total)

![Foreign nationality (1.9% total)[t 1]](https://www.search.com.vn/wiki/en/File:Percentage_of_Japan_who_is_of_Foreign_nationality_in_2020.svg)

Religion

Shinto and Buddhism are Japan's two major religions. They have co-existed for more than a thousand years. However, most Japanese people generally do not exclusively identify themselves as adherents of one religion, but rather incorporate various elements in a syncretic fashion.[106] There are small Christian and other minorities as well, with the Christian population dating to as early as the 1500s, as a result of European missionary work before sakoku was implemented from 1635 to 1853.
See also
References
- Details for Japan birth life information. Data is for 2023.
External links
 Media related to Demographics of Japan at Wikimedia Commons
- Japan Population Census 2010
- Expatriates in Japan Archived 2017-06-08 at the Wayback Machine
- "The Dilemma Posed by Japan's Population Decline"—Discussion paper by Julian Chapple in the electronic journal of contemporary japanese studies, 18 October 2004.
- The Exodus to North Korea Museum—Commemorates the story of the 93,340 people who migrated from Japan to North Korea in the period 1959–1984
- Another Tsunami Warning: Caring for Japan's Elderly—Brief on what the future of Japan looks like for an increasingly aging population, and if this demographic transition is limited to Japan alone
- Morita, Kiriro and Saskia Sassen. "The New Illegal Immigration in Japan, 1980–1992". International Migration Review. Vol. 28, No. 1 (Spring 1994), pp. 153–163. JSTOR 2547030.