This page contains four lists of third-party and independent performances in United States presidential elections:
- National results for third-party or independent presidential candidates that won above 5% of the popular vote (1788–present)
- National results for third-party or independent presidential candidates that won between 1% and 5% of the popular vote (1788–present)
- State results where a third-party or independent presidential candidate won above 5% of the popular vote (1832–present)
- State results where a major-party candidate received above 1% of the state popular vote from a third party cross-endorsement (1896–present)
It is rare for candidates, other than those of the six parties which have succeeded as major parties (Federalist Party, Democratic-Republican Party, National Republican Party, Democratic Party, Whig Party, Republican Party), to take large shares of the vote in elections.
As of 2023[update], the last third party presidential candidate to win an electoral vote was George Wallace of the American Independent Party, who won five states in 1968.[1]
National results
Above 5% (1788–present)
This list includes the third-party candidates that captured at least one state and/or more than 5% of the popular vote.
| Year | Party | Nominee | Running-Mate | # Votes | % Votes | % Votes On Ballot | Electoral Votes | Place | Notes |
|---|---|---|---|---|---|---|---|---|---|
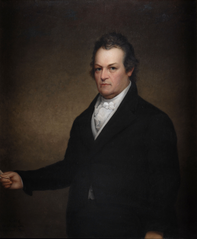
| 1832 | Nullifier | John Floyd | Henry Lee | 0[2] | 0 / 100 | N/A[2] | 11 / 286 | 3rd | |
| Anti-Masonic | William Wirt | Amos Ellmaker | 99,817 | 7.78 / 100 | 15.93 / 100 | 7 / 286 | 4th | ||
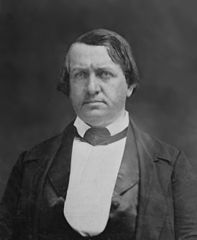
| 1848 | Free Soil | Martin Van Buren | Charles F. Adams | 291,475 | 10.13 / 100 | 13.79 / 100 | 0 / 290 | 3rd | |
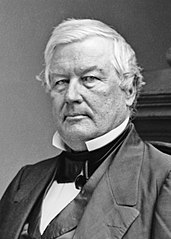
| 1856 | American | Millard Fillmore | Andrew J. Donelson | 872,703 | 21.54 / 100 | 21.54 / 100 | 8 / 296 | ||
| 1860 | Lecompton Democratic | John C. Breckinridge | Joseph Lane | 851,844 | 18.20 / 100 | 22.04 / 100 | 72 / 303 | 2nd | |
| Constitutional Union | John Bell | Edward Everett | 590,946 | 12.62 / 100 | 15.43 / 100 | 39 / 303 | 3rd | ||
| 1872 | Liberal Republican[3] | Horace Greeley | Benjamin Gratz Brown | 2,834,761 | 43.78 / 100 | 43.78 / 100 | 0 / 352 [4] | 2nd | |
| 1892 | Populist | James B. Weaver | James G. Field | 1,026,595 | 8.51 / 100 | 8.62 / 100 | 22 / 444 | 3rd | |
| 1912 | Progressive | Theodore Roosevelt | Hiram Johnson | 4,120,609 | 27.39 / 100 | 27.86 / 100 | 88 / 531 | 2nd | |
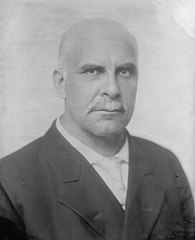
| Socialist | Eugene V. Debs | Emil Seidel | 900,742 | 5.99 / 100 | 5.99 / 100 | 0 / 531 | 4th | ||
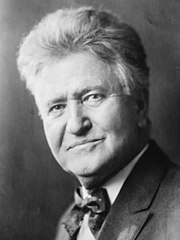
| 1924 | Progressive | Robert M. La Follette | Burton K. Wheeler | 4,833,821 | 16.62 / 100 | 16.69 / 100 | 13 / 531 | 3rd | |
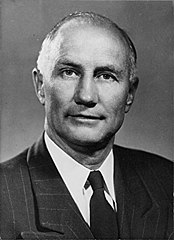
| 1948 | States' Rights Democratic (Dixiecrat) | Strom Thurmond | Fielding L. Wright | 1,175,946 | 2.41 / 100 | 17.70 / 100 | 39 / 531 | ||
| 1968 | American Independent | George Wallace | Curtis LeMay | 9,901,118 | 13.53 / 100 | 13.56 / 100 | 46 / 538 | ||
| 1980 | Independent | John B. Anderson | Patrick Lucey | 5,719,850 | 6.61 / 100 | 6.61 / 100 | 0 / 538 | ||
| 1992 | Ross Perot | James Stockdale | 19,743,821 | 18.91 / 100 | 18.91 / 100 | 0 / 538 | |||
| 1996 | Reform | Pat Choate | 8,085,402 | 8.40 / 100 | 8.40 / 100 | 0 / 538 |
Gallery
Above 1% (1788–present)
This list includes the third-party candidates that captured less than 5% but more than 1% of the popular vote and no electoral votes.
Gallery
By state
Third-party and independent candidates (1832–present)
This list includes the statewide performance of third-party candidates not included in the lists above who accrued 5% or more of a state's popular vote.
Many third-party candidates have run under different affiliations in different states. They do this for many reasons, including laws restricting ballot access, cross-endorsements by other established parties, etc.[citation needed] In the list below, the party column shows which of a given candidate's affiliation(s) appeared on the ballot in which corresponding state(s).
1832–1860
| (1832–1860) | ||||||||
|---|---|---|---|---|---|---|---|---|
| Year | State | Party | Nominee | Running mate | # Votes | % Votes | Place | Notes |
| 1832 | Connecticut | Anti-Masonic | William Wirt | Amos Ellmaker | 3,409 | 10.38 / 100 | 3rd | |
| Massachusetts | 14,692 | 21.73 / 100 | 2nd | |||||
| Pennsylvania | 66,689 | 42.04 / 100 | ||||||
| Vermont | 13,106 | 40.79 / 100 | 1st | |||||
| 1844 | Maine | Liberty | James G. Birney | Thomas Morris | 4,836 | 5.69 / 100 | 3rd | |
| Massachusetts | 10,830 | 8.20 / 100 | ||||||
| Michigan | 3,639 | 6.53 / 100 | ||||||
| New Hampshire | 4,161 | 8.46 / 100 | ||||||
| Vermont | 3,970 | 8.13 / 100 | ||||||
| 1848 | Connecticut | Free Soil | Martin Van Buren | Charles Francis Adams Sr. | 5,005 | 8.02 / 100 | ||
| Illinois | 15,702 | 12.60 / 100 | ||||||
| Indiana | 8,100 | 5.30 / 100 | ||||||
| Maine | 12,157 | 13.87 / 100 | ||||||
| Massachusetts | 38,333 | 28.45 / 100 | 2nd | |||||
| Michigan | 10,393 | 15.97 / 100 | 3rd | |||||
| New Hampshire | 7,560 | 15.09 / 100 | ||||||
| New York | 120,497 | 26.43 / 100 | 2nd | |||||
| Ohio | 35,347 | 10.76 / 100 | 3rd | |||||
| Rhode Island | 730 | 6.54 / 100 | ||||||
| Vermont | 13,837 | 28.87 / 100 | 2nd | |||||
| Wisconsin | 10,418 | 26.60 / 100 | 3rd | |||||
| 1852 | Illinois | John P. Hale | George Washington Julian | 9,863 | 6.36 / 100 | 3rd | ||
| Maine | 8,030 | 9.77 / 100 | ||||||
| Massachusetts | 28,023 | 22.05 / 100 | ||||||
| Michigan | 7,237 | 8.73 / 100 | ||||||
| New Hampshire | 6,546 | 12.95 / 100 | ||||||
| Ohio | 31,732 | 8.98 / 100 | ||||||
| Vermont | 8,621 | 19.64 / 100 | ||||||
| Wisconsin | 8,814 | 13.63 / 100 | ||||||
| Georgia | Union | Daniel Webster | Charles J. Jenkins | 5,324 | 8.50 / 100 | |||
| 1856 | Alabama | American | Millard Fillmore | Andrew Jackson Donelson | 28,552 | 37.92 / 100 | 2nd | |
| Arkansas | 10,732 | 32.88 / 100 | ||||||
| California | 36,195 | 32.83 / 100 | ||||||
| Delaware | 6,275 | 42.99 / 100 | ||||||
| Florida | 4,833 | 43.19 / 100 | ||||||
| Georgia | 42,439 | 42.86 / 100 | ||||||
| Illinois | 37,531 | 15.68 / 100 | 3rd | |||||
| Indiana | 22,386 | 9.51 / 100 | ||||||
| Iowa | 9,669 | 10.47 / 100 | ||||||
| Kentucky | 67,416 | 47.46 / 100 | 2nd | |||||
| Louisiana | 20,709 | 48.30 / 100 | ||||||
| Maryland | 47,452 | 54.63 / 100 | 1st | |||||
| Massachusetts | 19,626 | 11.54 / 100 | 3rd | |||||
| Mississippi | Whig | 24,191 | 40.56 / 100 | 2nd | ||||
| Missouri | American | 48,522 | 45.57 / 100 | |||||
| New Jersey | 24,115 | 24.26 / 100 | 3rd | |||||
| New York | 124,206 | 20.89 / 100 | ||||||
| North Carolina | Whig | 36,720 | 43.22 / 100 | 2nd | ||||
| Ohio | American | 28,126 | 7.28 / 100 | 3rd | ||||
| Pennsylvania | 82,189 | 17.86 / 100 | ||||||
| Rhode Island | 1,675 | 8.45 / 100 | ||||||
| Tennessee | 63,878 | 47.82 / 100 | 2nd | |||||
| Texas | 15,639 | 33.41 / 100 | ||||||
| Virginia | 60,150 | 40.04 / 100 | ||||||
| 1860 | Alabama | Constitutional Democratic | John C. Breckinridge | Joseph Lane | 48,669 | 54.00 / 100 | 1st | |
| Arkansas | 28,732 | 53.06 / 100 | ||||||
| California | 33,969 | 28.35 / 100 | 3rd | |||||
| Connecticut | 16,558 | 20.51 / 100 | ||||||
| Delaware | 7,339 | 45.54 / 100 | 1st | |||||
| Florida | 8,277 | 62.23 / 100 | ||||||
| Georgia | 52,176 | 48.89 / 100 | ||||||
| Kentucky | 53,143 | 36.35 / 100 | 2nd | |||||
| Louisiana | 22,681 | 44.90 / 100 | 1st | |||||
| Maine | 6,368 | 6.31 / 100 | 3rd | |||||
| Maryland | 42,482 | 45.93 / 100 | 1st | |||||
| Mississippi | 40,768 | 59.00 / 100 | ||||||
| Missouri | 31,362 | 18.94 / 100 | 3rd | |||||
| North Carolina | 48,486 | 50.51 / 100 | 1st | |||||
| Oregon | 5,074 | 34.37 / 100 | 2nd | |||||
| Pennsylvania | 178,871 | 37.54 / 100 | ||||||
| Tennessee | 65,097 | 44.55 / 100 | ||||||
| Texas | 47,548 | 75.49 / 100 | 1st | |||||
| Virginia | 74,325 | 44.54 / 100 | 2nd | |||||
| Alabama | Constitutional Union | John Bell | Edward Everett | 27,835 | 30.89 / 100 | 2nd | ||
| Arkansas | 20,063 | 37.05 / 100 | ||||||
| California | 9,111 | 7.60 / 100 | 4th | |||||
| Delaware | 3,888 | 24.13 / 100 | 2nd | |||||
| Florida | 4,801 | 36.10 / 100 | ||||||
| Georgia | 42,960 | 40.26 / 100 | ||||||
| Kentucky | 66,058 | 45.18 / 100 | 1st | |||||
| Louisiana | 20,204 | 40.00 / 100 | 2nd | |||||
| Maryland | 41,760 | 45.14 / 100 | ||||||
| Massachusetts | 22,331 | 13.15 / 100 | 3rd | |||||
| Mississippi | 25,045 | 36.25 / 100 | 2nd | |||||
| Missouri | 58,372 | 35.26 / 100 | ||||||
| North Carolina | 45,129 | 46.66 / 100 | ||||||
| Tennessee | 69,728 | 47.72 / 100 | 1st | |||||
| Texas | 15,438 | 24.51 / 100 | 2nd | |||||
| Virginia | 74,481 | 44.63 / 100 | 1st | |||||
1864–1900
| (1864–1900) | ||||||||
|---|---|---|---|---|---|---|---|---|
| Year | State | Party | Nominee | Running mate | # Votes | % Votes | Place | Notes |
| 1876 | Kansas | Greenback | Peter Cooper | Samuel Fenton Cary | 7,770 | 6.26 / 100 | 3rd | |
| 1880 | Iowa | James B. Weaver | Barzillai J. Chambers | 32,327 | 10.02 / 100 | |||
| Kansas | 19,851 | 9.86 / 100 | ||||||
| Michigan | 34,895 | 9.88 / 100 | ||||||
| Missouri | 35,042 | 8.82 / 100 | ||||||
| Texas | 27,405 | 11.34 / 100 | ||||||
| West Virginia | 9,008 | 8.00 / 100 | ||||||
| 1884 | Kansas | Benjamin Butler | Absolom M. West | 16,364 | 6.15 / 100 | |||
| Massachusetts | 24,382 | 8.04 / 100 | ||||||
| 1888 | Minnesota | Prohibition | Clinton B. Fisk | John A. Brooks | 15,311 | 5.82 / 100 | ||
| Arkansas | Union Labor | Alson Streeter | Charles E. Cunningham | 10,630 | 6.77 / 100 | |||
| Kansas | 37,788 | 11.41 / 100 | ||||||
| Texas | 29,459 | 8.24 / 100 | ||||||
| 1892 | Alabama | People's | James B. Weaver | James G. Field | 84,984 | 36.55 / 100 | 2nd | |
| Arkansas | 11,831 | 7.99 / 100 | 3rd | |||||
| California | 25,311 | 9.39 / 100 | ||||||
| Colorado | 53,584 | 57.07 / 100 | 1st | |||||
| Florida | 4,843 | 13.65 / 100 | 2nd | |||||
| Georgia | 41,939 | 18.80 / 100 | 3rd | |||||
| Idaho | 10,520 | 54.21 / 100 | 1st | |||||
| Kansas | 163,111 | 50.20 / 100 | ||||||
| Kentucky | 23,500 | 6.89 / 100 | 3rd | |||||
| Minnesota | Fusion | 29,313 | 10.97 / 100 | |||||
| Mississippi | People's | 10,118 | 19.27 / 100 | 2nd | ||||
| Missouri | 41,204 | 7.61 / 100 | 3rd | |||||
| Montana | 7,338 | 16.50 / 100 | ||||||
| Nebraska | 83,134 | 41.53 / 100 | 2nd | |||||
| Nevada | 7,264 | 66.78 / 100 | 1st | |||||
| North Carolina | 44,336 | 15.82 / 100 | 3rd | |||||
| North Dakota | 17,700 | 49.01 / 100 | 1st | |||||
| Oregon | 26,965 | 34.35 / 100 | 2nd | |||||
| South Dakota | Independent | 26,544 | 37.64 / 100 | |||||
| Tennessee | People's | 23,918 | 9.00 / 100 | 3rd | ||||
| Texas | 99,688 | 23.61 / 100 | 2nd | |||||
| Washington | 19,165 | 21.79 / 100 | 3rd | |||||
| Wyoming | Democratic | 7,722 | 46.14 / 100 | 2nd | ||||
| Minnesota | Prohibition | John Bidwell | James B. Cranfill | 14,182 | 5.31 / 100 | 4th | ||
| 1900 | Florida | John G. Woolley | Henry B. Metcalf | 2,244 | 5.66 / 100 | 3rd | ||
1904–1940
| (1904–1940) | ||||||||
|---|---|---|---|---|---|---|---|---|
| Year | State | Party | Nominee | Running mate | # Votes | % Votes | Place | Notes |
| 1904 | California | Socialist | Eugene V. Debs | Ben Hanford | 29,535 | 8.90 / 100 | 3rd | |
| Florida | 2,337 | 5.95 / 100 | ||||||
| Idaho | 4,949 | 6.82 / 100 | ||||||
| Illinois | 69,225 | 6.43 / 100 | ||||||
| Montana | 5,676 | 8.81 / 100 | ||||||
| Nevada | 925 | 7.64 / 100 | ||||||
| Oregon | 7,619 | 8.45 / 100 | ||||||
| Utah | 5,767 | 5.67 / 100 | ||||||
| Washington | 10,023 | 6.91 / 100 | ||||||
| Wisconsin | Social Democratic | 28,240 | 6.37 / 100 | |||||
| Georgia | People's | Thomas E. Watson | Thomas Tibbles | 22,635 | 17.28 / 100 | |||
| Nebraska | 20,518 | 9.09 / 100 | ||||||
| 1908 | California | Socialist | Eugene V. Debs | Ben Hanford | 28,659 | 7.41 / 100 | ||
| Florida | 3,747 | 7.59 / 100 | ||||||
| Idaho | 6,400 | 6.58 / 100 | ||||||
| Montana | 5,855 | 8.51 / 100 | ||||||
| Nevada | 2,103 | 8.57 / 100 | ||||||
| Oklahoma | 21,734 | 8.52 / 100 | ||||||
| Oregon | 7,339 | 6.62 / 100 | ||||||
| Washington | 14,177 | 7.71 / 100 | ||||||
| Wisconsin | Social Democratic | 28,147 | 6.19 / 100 | |||||
| Georgia | People's | Thomas E. Watson | Samuel Williams | 16,687 | 12.59 / 100 | |||
| 1912 | Alabama | Progressive | Theodore Roosevelt | Hiram Johnson | 22,680 | 19.24 / 100 | 2nd | |
| Arizona | 6,949 | 29.29 / 100 | ||||||
| Arkansas | 21,644 | 17.30 / 100 | 3rd | |||||
| California | Republican | 283,610 | 41.83 / 100 | 1st | ||||
| Colorado | Progressive | 72,306 | 27.09 / 100 | 2nd | ||||
| Connecticut | 34,129 | 17.92 / 100 | 3rd | |||||
| Delaware | 8,886 | 18.25 / 100 | ||||||
| Florida | 4,555 | 8.96 / 100 | ||||||
| Georgia | 21,985 | 18.10 / 100 | 2nd | |||||
| Idaho | 25,527 | 24.14 / 100 | 3rd | |||||
| Illinois | 386,478 | 33.72 / 100 | 2nd | |||||
| Indiana | 162,007 | 24.75 / 100 | ||||||
| Iowa | 161,819 | 32.87 / 100 | ||||||
| Kentucky | 101,766 | 22.48 / 100 | 3rd | |||||
| Kansas | Independent | 120,210 | 32.88 / 100 | 2nd | ||||
| Louisiana | Progressive | 9,283 | 11.71 / 100 | |||||
| Maine | 48,495 | 37.41 / 100 | ||||||
| Maryland | 57,789 | 24.91 / 100 | ||||||
| Massachusetts | 142,228 | 29.14 / 100 | 3rd | |||||
| Michigan | 214,584 | 38.95 / 100 | 1st | |||||
| Minnesota | 125,856 | 37.66 / 100 | ||||||
| Mississippi | 3,459 | 5.50 / 100 | 2nd | |||||
| Missouri | 124,375 | 17.80 / 100 | 3rd | |||||
| Montana | 22,456 | 28.13 / 100 | 2nd | |||||
| Nebraska | 72,681 | 29.13 / 100 | ||||||
| Nevada | 5,620 | 27.94 / 100 | ||||||
| New Hampshire | 17,794 | 20.23 / 100 | 3rd | |||||
| New Jersey | 145,410 | 33.60 / 100 | 2nd | |||||
| New Mexico | 8,347 | 16.90 / 100 | 3rd | |||||
| New York | 390,093 | 24.56 / 100 | ||||||
| North Carolina | 69,130 | 28.34 / 100 | 2nd | |||||
| North Dakota | 25,726 | 29.71 / 100 | ||||||
| Ohio | 229,807 | 22.16 / 100 | 3rd | |||||
| Oregon | 37,600 | 27.44 / 100 | 2nd | |||||
| Pennsylvania | 444,894 | 36.53 / 100 | 1st | |||||
| Rhode Island | 16,878 | 21.67 / 100 | 3rd | |||||
| South Dakota | Republican | 58,811 | 50.56 / 100 | 1st | ||||
| Tennessee | Progressive | 54,041 | 21.45 / 100 | 3rd | ||||
| Texas | 26,745 | 8.86 / 100 | ||||||
| Utah | 24,174 | 21.51 / 100 | ||||||
| Vermont | 22,132 | 35.22 / 100 | 2nd | |||||
| Virginia | 21,777 | 15.90 / 100 | 3rd | |||||
| Washington | 113,698 | 35.22 / 100 | 1st | |||||
| West Virginia | 79,112 | 29.43 / 100 | 2nd | |||||
| Wisconsin | 62,448 | 15.61 / 100 | 3rd | |||||
| Wyoming | 9,232 | 21.83 / 100 | ||||||
| Arizona | Socialist | Eugene V. Debs | Emil Seidel | 3,163 | 13.33 / 100 | |||
| Arkansas | 8,153 | 6.52 / 100 | 4th | |||||
| California | 79,201 | 11.68 / 100 | 3rd | |||||
| Colorado | 16,418 | 6.15 / 100 | 4th | |||||
| Connecticut | 10,056 | 5.28 / 100 | ||||||
| Florida | 4,806 | 9.45 / 100 | 2nd | |||||
| Idaho | 11,960 | 11.31 / 100 | 4th | |||||
| Illinois | 81,278 | 7.09 / 100 | ||||||
| Indiana | 36,931 | 5.64 / 100 | ||||||
| Kansas | 26,779 | 7.33 / 100 | ||||||
| Louisiana | 5,261 | 6.64 / 100 | 3rd | |||||
| Minnesota | Public Ownership | 27,505 | 8.23 / 100 | 4th | ||||
| Montana | Socialist | 10,885 | 13.64 / 100 | |||||
| Nevada | 3,313 | 16.47 / 100 | 3rd | |||||
| New Mexico | 2,859 | 5.79 / 100 | 4th | |||||
| North Dakota | 6,966 | 8.05 / 100 | ||||||
| Ohio | 90,144 | 8.69 / 100 | ||||||
| Oklahoma | 41,674 | 16.42 / 100 | 3rd | |||||
| Oregon | 13,343 | 9.74 / 100 | 4th | |||||
| Pennsylvania | 83,614 | 6.87 / 100 | ||||||
| Texas | 24,896 | 8.25 / 100 | ||||||
| Utah | 9,023 | 8.03 / 100 | ||||||
| Washington | 40,134 | 12.43 / 100 | ||||||
| West Virginia | 15,248 | 5.67 / 100 | ||||||
| Wisconsin | Social Democratic | 33,476 | 8.37 / 100 | |||||
| Wyoming | Socialist | 2,760 | 6.53 / 100 | |||||
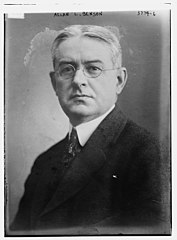
| 1916 | Arizona | Socialist | Allan L. Benson | George Ross Kirkpatrick | 3,174 | 5.47 / 100 | 3rd | |
| Florida | 5,353 | 6.63 / 100 | ||||||
| Idaho | 8,066 | 5.99 / 100 | ||||||
| Minnesota | 20,117 | 5.19 / 100 | ||||||
| Montana | 9,564 | 5.38 / 100 | ||||||
| Nevada | 3,065 | 9.20 / 100 | ||||||
| North Dakota | 5,716 | 4.95 / 100 | ||||||
| Oklahoma | 45,190 | 15.45 / 100 | ||||||
| Texas | 18,963 | 5.09 / 100 | ||||||
| Washington | 22,800 | 5.98 / 100 | ||||||
| Wisconsin | 27,631 | 6.18 / 100 | ||||||
| Florida | Prohibition | Frank Hanly | Ira Landrith | 4,786 | 5.93 / 100 | 4th | ||
| Georgia | Progressive | Unpledged | John M. Parker | 20,692 | 12.88 / 100 | 2nd | ||
| Louisiana | 6,349 | 6.83 / 100 | 3rd | |||||
| 1920 | California | Socialist | Eugene V. Debs | Seymour Stedman | 64,076 | 6.79 / 100 | ||
| Minnesota | 56,106 | 7.62 / 100 | ||||||
| Nevada | 1,864 | 6.85 / 100 | ||||||
| New York | 203,201 | 7.01 / 100 | ||||||
| Oklahoma | 25,726 | 5.09 / 100 | ||||||
| Wisconsin | 80,635 | 11.50 / 100 | ||||||
| Montana | Farmer–Labor | Parley P. Christensen | Max S. Hayes | 12,204 | 6.82 / 100 | |||
| South Dakota | Nonpartisan League | 34,707 | 19.04 / 100 | |||||
| Washington | Farmer–Labor | 77,246 | 19.37 / 100 | |||||
| Texas | American | James E. Ferguson | William Hough | 47,968 | 9.86 / 100 | 3rd | ||
| Black & Tan Republican | Unpledged electors | 27,247 | 5.60 / 100 | 4th | ||||
| 1924 | Arizona | Progressive | Robert M. La Follette | Burton K. Wheeler | 17,210 | 23.27 / 100 | 3rd | |
| Arkansas | 13,173 | 9.51 / 100 | ||||||
| California | Socialist | 424,649 | 33.13 / 100 | 2nd | ||||
| Colorado | La Follette-Wheeler Independent | 57,368 | 16.76 / 100 | 3rd | ||||
| Farmer–Labor | 12,577 | 3.67 / 100 | ||||||
| Total | 69,945 | 20.44 / 100 | ||||||
| Connecticut | Progressive | 42,416 | 10.60 / 100 | |||||
| Delaware | 4,979 | 5.48 / 100 | ||||||
| Florida | 8,625 | 7.90 / 100 | ||||||
| Georgia | 12,691 | 7.62 / 100 | ||||||
| Idaho | 54,160 | 36.52 / 100 | 2nd | |||||
| Illinois | 432,027 | 17.49 / 100 | 3rd | |||||
| Indiana | 71,700 | 5.64 / 100 | ||||||
| Iowa | 274,448 | 28.10 / 100 | 2nd | |||||
| Kansas | Independent | 98,461 | 14.86 / 100 | 3rd | ||||
| Maine | Progressive | 11,382 | 5.92 / 100 | |||||
| Maryland | 47,157 | 13.15 / 100 | ||||||
| Massachusetts | 141,225 | 12.50 / 100 | ||||||
| Michigan | 122,014 | 10.51 / 100 | ||||||
| Minnesota | Independent | 339,192 | 41.26 / 100 | 2nd | ||||
| Missouri | Socialist | 84,160 | 6.43 / 100 | 3rd | ||||
| Montana | Progressive | 66,123 | 37.91 / 100 | 2nd | ||||
| Nebraska | 106,701 | 22.99 / 100 | 3rd | |||||
| Nevada | Independent | 9,769 | 36.29 / 100 | 2nd | ||||
| New Hampshire | Progressive | 8,993 | 5.46 / 100 | 3rd | ||||
| New Jersey | 108,901 | 10.03 / 100 | ||||||
| New Mexico | 9,543 | 8.46 / 100 | ||||||
| New York | Socialist | 268,510 | 8.23 / 100 | |||||
| Progressive | 206,395 | 6.32 / 100 | ||||||
| Total | 474,905 | 14.55 / 100 | ||||||
| North Dakota | Nonpartisan League | 89,922 | 45.17 / 100 | 2nd | ||||
| Ohio | Progressive | 357,948 | 17.75 / 100 | 3rd | ||||
| Oklahoma | Farmer–Labor | 46,375 | 8.78 / 100 | |||||
| Oregon | Independent | 68,403 | 24.47 / 100 | 2nd | ||||
| Pennsylvania | Farmer–Labor | 214,126 | 9.98 / 100 | 3rd | ||||
| Socialist | 93,441 | 4.36 / 100 | ||||||
| Total | 307,567 | 14.34 / 100 | ||||||
| South Dakota | Independent | 75,355 | 36.96 / 100 | 2nd | ||||
| Texas | Progressive | 42,881 | 6.52 / 100 | 3rd | ||||
| Utah | 32,662 | 20.81 / 100 | ||||||
| Vermont | 5,964 | 5.79 / 100 | ||||||
| Washington | 150,727 | 35.76 / 100 | 2nd | |||||
| West Virginia | Farmer–Labor | 36,723 | 6.29 / 100 | 3rd | ||||
| Wisconsin | Independent | 453,678 | 53.96 / 100 | 1st | [9] | |||
| Wyoming | Progressive | 25,174 | 31.51 / 100 | 2nd | ||||
| Florida | Prohibition | Herman P. Faris | Marie C. Brehm | 5,498 | 5.04 / 100 | 4th | ||
| 1936 | Massachusetts | Union | William Lemke | Thomas C. O'Brien | 118,639 | 6.45 / 100 | 3rd | |
| Minnesota | 74,296 | 6.58 / 100 | ||||||
| North Dakota | 36,708 | 13.41 / 100 | ||||||
| Oregon | Independent | 21,831 | 5.27 / 100 | |||||
| Rhode Island | Union | 19,569 | 6.29 / 100 | |||||
1944–1980
| (1944–1980) | ||||||||
|---|---|---|---|---|---|---|---|---|
| Year | State | Party | Nominee | Running mate | # Votes | % Votes | Place | Notes |
| 1944 | South Carolina | Southern Democratic | Unpledged electors | 7,799 | 7.54 / 100 | 2nd | ||
| Texas | Texas Regulars | 135,439 | 11.77 / 100 | 3rd | ||||
| 1948 | Alabama | Democratic | Strom Thurmond | Fielding L. Wright | 171,443 | 79.75 / 100 | 1st | [10] |
| Arkansas | States' Rights Democratic | 40,068 | 16.52 / 100 | 3rd | ||||
| Florida | 89,755 | 15.54 / 100 | ||||||
| Georgia | 85,055 | 20.31 / 100 | 2nd | |||||
| Louisiana | 204,290 | 49.07 / 100 | 1st | [10] | ||||
| Mississippi | Democratic | 167,538 | 87.17 / 100 | [10] | ||||
| North Carolina | States' Rights Democratic | 69,652 | 8.80 / 100 | 3rd | ||||
| South Carolina | 102,607 | 71.97 / 100 | 1st | [10] | ||||
| Tennessee | 73,815 | 13.41 / 100 | 3rd | |||||
| Texas | 113,776 | 9.11 / 100 | ||||||
| Virginia | 43,393 | 10.35 / 100 | ||||||
| New York | American Labor | Henry A. Wallace | Glen H. Taylor | 509,559 | 8.25 / 100 | |||
| 1956 | Louisiana | States' Rights Democratic | Unpledged electors | 44,520 | 7.21 / 100 | [11] | ||
| Mississippi | 42,966 | 17.31 / 100 | ||||||
| South Carolina | 88,511 | 29.45 / 100 | 2nd | |||||
| Virginia | T. Coleman Andrews | Thomas H. Werdel | 42,964 | 6.16 / 100 | 3rd | |||
| 1960 | Alabama | Unpledged electors[12] | 324,050 | 36.47 / 100 | 1st | [11][13] | ||
| Louisiana | Independent | 169,572 | 20.99 / 100 | 3rd | ||||
| Mississippi | 116,248 | 38.99 / 100 | 1st | [13] | ||||
| Arkansas | National States' Rights | Orval Faubus | John G. Crommelin | 28,952 | 6.76 / 100 | 3rd | ||
| 1964 | Alabama | Democratic | Unpledged electors | 210,732 | 30.55 / 100 | 2nd | [11] | |
| 1968 | Alabama | George Wallace | Curtis LeMay (Official VP Nominee) | 691,425 | 65.86 / 100 | 1st | [14] | |
| Alaska | Independent | 10,024 | 12.07 / 100 | 3rd | ||||
| Arizona | American Independent | 46,573 | 9.56 / 100 | |||||
| Arkansas | 235,627 | 38.65 / 100 | 1st | [14] | ||||
| California | 487,270 | 6.72 / 100 | 3rd | |||||
| Colorado | Marvin Griffin (Provisional VP Nominee) | 60,813 | 7.50 / 100 | |||||
| Connecticut | Curtis LeMay (Official VP Nominee) | 76,650 | 6.10 / 100 | |||||
| Delaware | 28,459 | 13.28 / 100 | ||||||
| Florida | 676,794 | 28.53 / 100 | ||||||
| Georgia | Marvin Griffin (Provisional VP Nominee) | 535,550 | 42.83 / 100 | 1st | [14] | |||
| Idaho | Curtis LeMay (Official VP Nominee) | 36,541 | 12.55 / 100 | 3rd | ||||
| Illinois | Independent | 390,958 | 8.46 / 100 | |||||
| Indiana | American Independent | Marvin Griffin (Provisional VP Nominee) | 243,108 | 11.45 / 100 | ||||
| Iowa | 66,422 | 5.69 / 100 | ||||||
| Kansas | Conservative | 88,291 | 10.19 / 100 | |||||
| Kentucky | American Independent | 193,098 | 18.29 / 100 | |||||
| Louisiana | Curtis LeMay (Official VP Nominee) | 530,300 | 48.32 / 100 | 1st | [14] | |||
| Maryland | Marvin Griffin (Provisional VP Nominee) | 178,734 | 14.47 / 100 | 3rd | ||||
| Michigan | 331,968 | 10.04 / 100 | ||||||
| Mississippi | Independent | Curtis LeMay (Official VP Nominee) | 415,349 | 63.46 / 100 | 1st | [14] | ||
| Missouri | American Independent | Marvin Griffin (Provisional VP Nominee) | 206,126 | 11.39 / 100 | 3rd | |||
| Montana | 20,015 | 7.29 / 100 | ||||||
| Nebraska | 44,094 | 8.36 / 100 | ||||||
| Nevada | 20,432 | 13.25 / 100 | ||||||
| New Jersey | 262,187 | 9.12 / 100 | ||||||
| New Mexico | 25,737 | 7.86 / 100 | ||||||
| New York | Courage | 358,864 | 5.29 / 100 | |||||
| North Carolina | American Independent | Curtis LeMay (Official VP Nominee) | 496,188 | 31.26 / 100 | 2nd | |||
| North Dakota | Independent | 14,244 | 5.75 / 100 | 3rd | ||||
| Ohio | American Independent | Marvin Griffin (Provisional VP Nominee) | 467,495 | 11.81 / 100 | ||||
| Oklahoma | Curtis LeMay (Official VP Nominee) | 191,731 | 20.33 / 100 | |||||
| Oregon | Independent | 49,683 | 6.06 / 100 | |||||
| Pennsylvania | American Independent | Marvin Griffin (Provisional VP Nominee) | 378,582 | 7.97 / 100 | ||||
| South Carolina | Independent | Curtis LeMay (Official VP Nominee) | 215,430 | 32.30 / 100 | 2nd | |||
| Tennessee | American Independent | 424,792 | 34.02 / 100 | |||||
| Texas | 584,269 | 18.97 / 100 | 3rd | |||||
| Utah | 26,906 | 6.37 / 100 | ||||||
| Virginia | 321,833 | 23.64 / 100 | ||||||
| Washington | Marvin Griffin (Provisional VP Nominee) | 96,990 | 7.74 / 100 | |||||
| West Virginia | 72,560 | 9.62 / 100 | ||||||
| Wisconsin | Independent | 127,835 | 7.56 / 100 | |||||
| Wyoming | 11,105 | 8.73 / 100 | ||||||
| 1972 | Alaska | American Independent | John G. Schmitz | Thomas J. Anderson | 6,903 | 7.25 / 100 | ||
| Idaho | 28,869 | 9.30 / 100 | ||||||
| Utah | 28,549 | 5.97 / 100 | ||||||
| 1976 | Alaska | Libertarian | Roger MacBride | David Bergland | 6,785 | 5.50 / 100 | ||
| 1980 | Alaska | Ed Clark | David Koch | 18,479 | 11.87 / 100 | [15] | ||
| Independent | John B. Anderson | Patrick Lucey (Official VP Nominee) | 11,155 | 7.04 / 100 | 4th | [16] | ||
| Arizona | 76,952 | 8.81 / 100 | 3rd | |||||
| California | 739,833 | 8.62 / 100 | ||||||
| Colorado | Anderson Coalition (Later National Unity) | 130,633 | 11.03 / 100 | |||||
| Connecticut | 171,807 | 12.22 / 100 | ||||||
| Delaware | 171,807 | 6.91 / 100 | ||||||
| District of Columbia | Independent | 16,131 | 9.28 / 100 | |||||
| Florida | 189,692 | 5.14 / 100 | ||||||
| Hawaii | 32,021 | 10.56 / 100 | ||||||
| Idaho | 27,058 | 6.19 / 100 | ||||||
| Illinois | 346,754 | 7.30 / 100 | ||||||
| Iowa | 115,633 | 8.78 / 100 | ||||||
| Kansas | 68,231 | 6.96 / 100 | ||||||
| Maine | 53,327 | 10.20 / 100 | ||||||
| Maryland | 119,537 | 7.76 / 100 | ||||||
| Massachusetts | Anderson Coalition (Later National Unity) | 382,539 | 15.15 / 100 | |||||
| Michigan | 275,223 | 7.04 / 100 | ||||||
| Minnesota | 174,990 | 8.53 / 100 | ||||||
| Montana | Independent | 29,281 | 8.05 / 100 | |||||
| Nebraska | 44,993 | 7.02 / 100 | ||||||
| Nevada | 17,651 | 7.12 / 100 | ||||||
| New Hampshire | 49,693 | 12.94 / 100 | ||||||
| New Jersey | Anderson Coalition (Later National Unity) | 234,632 | 7.88 / 100 | |||||
| New Mexico | Independent | 29,459 | 6.46 / 100 | |||||
| New York | Liberal | 467,801 | 7.54 / 100 | |||||
| North Dakota | Independent | 23,640 | 7.84 / 100 | |||||
| Ohio | 254,472 | 5.94 / 100 | ||||||
| Oregon | 112,389 | 9.51 / 100 | ||||||
| Pennsylvania | Anderson Coalition (Later National Unity) | 292,921 | 6.42 / 100 | |||||
| Rhode Island | 59,819 | 14.38 / 100 | ||||||
| South Dakota | Independent | Flint (Provisional VP Nominee) | 21,431 | 6.54 / 100 | ||||
| Utah | Patrick Lucey (Official VP Nominee) | 30,284 | 5.01 / 100 | |||||
| Vermont | 31,760 | 14.90 / 100 | ||||||
| Virginia | 95,418 | 5.11 / 100 | ||||||
| Washington | 185,073 | 10.62 / 100 | ||||||
| Wisconsin | 160,657 | 7.07 / 100 | ||||||
| Wyoming | 12,072 | 6.83 / 100 | ||||||
1984–present
| (1984–Present) | ||||||||
|---|---|---|---|---|---|---|---|---|
| Year | State | Party | Nominee | Running mate | # Votes | % Votes | Place | Notes |
| 1992 | Alabama | Independent | Ross Perot | James Stockdale | 183,109 | 10.85 / 100 | 3rd | [17] |
| Alaska | 73,481 | 28.43 / 100 | ||||||
| Arizona | 353,741 | 23.79 / 100 | ||||||
| Arkansas | 99,132 | 10.43 / 100 | ||||||
| California | 2,296,006 | 20.63 / 100 | ||||||
| Colorado | 366,010 | 23.32 / 100 | ||||||
| Connecticut | Americans for Perot (Later Reform Party) | 348,771 | 21.58 / 100 | |||||
| Delaware | Independent | 59,213 | 20.45 / 100 | |||||
| Florida | 1,053,067 | 19.82 / 100 | ||||||
| Georgia | 353,741 | 23.79 / 100 | ||||||
| Hawaii | 53,003 | 14.22 / 100 | ||||||
| Idaho | 130,395 | 27.05 / 100 | ||||||
| Illinois | 840,515 | 16.64 / 100 | ||||||
| Indiana | 455,934 | 19.77 / 100 | ||||||
| Iowa | 253,468 | 18.71 / 100 | ||||||
| Kansas | 312,358 | 26.99 / 100 | ||||||
| Kentucky | 203,944 | 13.66 / 100 | ||||||
| Louisiana | Prudence, Action, Results (Later Reform Party) | 211,478 | 11.81 / 100 | |||||
| Maine | Independent | 206,820 | 30.44 / 100 | 2nd | [18] | |||
| Maryland | 281,414 | 14.18 / 100 | 3rd | |||||
| Massachusetts | 632,312 | 22.80 / 100 | ||||||
| Michigan | 824,813 | 19.30 / 100 | ||||||
| Minnesota | 562,506 | 23.96 / 100 | ||||||
| Mississippi | 85,626 | 8.72 / 100 | [19] | |||||
| Missouri | 518,741 | 21.69 / 100 | ||||||
| Montana | 107,225 | 26.12 / 100 | ||||||
| Nebraska | 174,687 | 23.63 / 100 | ||||||
| Nevada | 132,580 | 26.19 / 100 | ||||||
| New Hampshire | 121,337 | 22.59 / 100 | ||||||
| New Jersey | 521,829 | 15.61 / 100 | ||||||
| New Mexico | 91,895 | 16.12 / 100 | ||||||
| New York | 1,090,721 | 15.75 / 100 | ||||||
| North Carolina | 357,864 | 13.70 / 100 | ||||||
| North Dakota | 71,084 | 23.07 / 100 | ||||||
| Ohio | 1,036,426 | 20.98 / 100 | ||||||
| Oklahoma | 319,878 | 23.01 / 100 | ||||||
| Oregon | 354,091 | 24.21 / 100 | ||||||
| Pennsylvania | Pennsylvanians (Later Reform Party) | 902,667 | 18.20 / 100 | |||||
| Rhode Island | Perot for President (Later Reform Party) | 105,045 | 23.16 / 100 | |||||
| South Carolina | Independent | 138,872 | 11.55 / 100 | |||||
| South Dakota | 73,295 | 21.80 / 100 | ||||||
| Tennessee | 199,968 | 10.09 / 100 | ||||||
| Texas | 1,354,781 | 22.01 / 100 | ||||||
| Utah | 203,400 | 27.34 / 100 | 2nd | [20] | ||||
| Vermont | 65,991 | 22.78 / 100 | 3rd | |||||
| Virginia | 348,639 | 13.63 / 100 | ||||||
| Washington | 541,780 | 23.68 / 100 | ||||||
| West Virginia | 108,829 | 15.91 / 100 | ||||||
| Wisconsin | 544,479 | 21.51 / 100 | ||||||
| Wyoming | 51,263 | 25.65 / 100 | ||||||
| 1996 | Alabama | Independent | Ross Perot | Pat Choate (Official VP Nominee) | 92,149 | 6.01 / 100 | [17] | |
| Alaska | Reform | 26,333 | 10.90 / 100 | |||||
| Arizona | 112,072 | 7.98 / 100 | ||||||
| Arkansas | 69,884 | 7.90 / 100 | ||||||
| California | James Campbell (Provisional VP Nominee) | 697,849 | 6.96 / 100 | |||||
| Colorado | Pat Choate (Official VP Nominee) | 99,629 | 6.59 / 100 | |||||
| Connecticut | 139,523 | 10.02 / 100 | ||||||
| Delaware | Independent | 28,719 | 10.60 / 100 | |||||
| Florida | Reform | 483,870 | 9.12 / 100 | |||||
| Georgia | 146,337 | 6.37 / 100 | ||||||
| Hawaii | 27,358 | 7.60 / 100 | ||||||
| Idaho | 62,518 | 12.71 / 100 | ||||||
| Illinois | 346,408 | 8.03 / 100 | ||||||
| Indiana | James Campbell (Provisional VP Nominee) | 224,299 | 10.50 / 100 | |||||
| Iowa | 105,159 | 8.52 / 100 | ||||||
| Kansas | 92,639 | 8.62 / 100 | ||||||
| Kentucky | Pat Choate (Official VP Nominee) | 120,396 | 8.67 / 100 | |||||
| Louisiana | James Campbell (Provisional VP Nominee) | 123,293 | 6.91 / 100 | |||||
| Maine | 85,970 | 14.19 / 100 | [21] | |||||
| Maryland | 115,812 | 6.50 / 100 | ||||||
| Massachusetts | Pat Choate (Official VP Nominee) | 227,217 | 8.89 / 100 | |||||
| Michigan | 336,870 | 8.75 / 100 | ||||||
| Minnesota | 257,704 | 11.75 / 100 | ||||||
| Mississippi | Independent | 52,222 | 5.84 / 100 | |||||
| Missouri | Reform | James Campbell (Provisional VP Nominee) | 217,188 | 10.06 / 100 | ||||
| Montana | 55,229 | 13.56 / 100 | ||||||
| Nebraska | Pat Choate (Official VP Nominee) | 71,278 | 10.52 / 100 | |||||
| Nevada | 43,986 | 9.47 / 100 | ||||||
| New Hampshire | 48,390 | 9.69 / 100 | ||||||
| New Jersey | Independent | 262,134 | 8.52 / 100 | |||||
| New Mexico | Reform | 32,257 | 5.80 / 100 | |||||
| New York | Independence | 503,458 | 7.97 / 100 | |||||
| North Carolina | Reform | 168,059 | 6.68 / 100 | |||||
| North Dakota | Hanson (Provisional VP Nominee) | 32,515 | 12.20 / 100 | |||||
| Ohio | James Campbell (Provisional VP Nominee) | 483,207 | 10.66 / 100 | |||||
| Oklahoma | Pat Choate (Official VP Nominee) | 130,788 | 10.84 / 100 | |||||
| Oregon | James Campbell (Provisional VP Nominee) | 121,221 | 8.80 / 100 | |||||
| Pennsylvania | Pat Choate (Official VP Nominee) | 430,984 | 9.56 / 100 | |||||
| Rhode Island | 43,723 | 11.20 / 100 | ||||||
| South Carolina | 64,386 | 5.60 / 100 | ||||||
| South Dakota | Independent | James Campbell (Provisional VP Nominee) | 31,250 | 9.65 / 100 | ||||
| Tennessee | 105,918 | 5.59 / 100 | [22] | |||||
| Texas | 378,537 | 6.75 / 100 | ||||||
| Utah | Reform | Pat Choate (Official VP Nominee) | 66,461 | 9.98 / 100 | ||||
| Vermont | 31,024 | 12.00 / 100 | ||||||
| Virginia | 159,861 | 6.62 / 100 | ||||||
| Washington | 201,003 | 8.92 / 100 | ||||||
| West Virginia | 71,639 | 11.26 / 100 | ||||||
| Wisconsin | 227,339 | 10.35 / 100 | ||||||
| Wyoming | Independent | 25,928 | 12.25 / 100 | |||||
| 2000 | Alaska | Green | Ralph Nader | Winona LaDuke | 28,747 | 10.07 / 100 | [23] | |
| Colorado | 91,434 | 5.25 / 100 | ||||||
| Washington, D.C. | 10,576 | 5.24 / 100 | ||||||
| Hawaii | 21,623 | 5.88 / 100 | ||||||
| Maine | 37,127 | 5.70 / 100 | ||||||
| Massachusetts | 173,564 | 6.42 / 100 | ||||||
| Minnesota | 126,696 | 5.20 / 100 | ||||||
| Montana | 24,437 | 5.95 / 100 | ||||||
| Oregon | 77,357 | 5.04 / 100 | ||||||
| Rhode Island | 25,052 | 6.12 / 100 | ||||||
| Vermont | 20,374 | 6.92 / 100 | ||||||
| 2016 | Alaska | Libertarian | Gary Johnson | William Weld | 18,782 | 5.90 / 100 | 3rd | |
| Colorado | 144,121 | 5.18 / 100 | ||||||
| Maine | 37,578 | 5.10 / 100 | ||||||
| Montana | 28,036 | 5.67 / 100 | ||||||
| New Mexico | 74,541 | 9.34 / 100 | ||||||
| North Dakota | 21,434 | 6.22 / 100 | ||||||
| Oklahoma | 83,481 | 5.75 / 100 | ||||||
| South Dakota | 20,845 | 5.63 / 100 | ||||||
| Washington | 160,879 | 5.01 / 100 | ||||||
| Wyoming | 13,287 | 5.19 / 100 | ||||||
| Idaho | Independent | Evan McMullin | Nathan Johnson (Provisional VP Nominee) | 46,476 | 6.73 / 100 | |||
| Utah | 243,685 | 21.54 / 100 | ||||||
| Vermont | Write-in | Bernie Sanders | None | 18,183 | 5.67 / 100 | [24] | ||
Cross-endorsement major candidates (1896–present)
This list includes the statewide performance of each major party candidate who ran on the ballot line of a political party other than their own, either through electoral fusion or for other reasons. This list does not include cases where a third party shares the same ballot line as a major party. The vote totals and percentages listed are those each candidate received under a particular third-party label.
Electoral fusion was once widespread in the United States.[25] As of 2022, electoral fusion as conventionally understood by historians and political scientists is fully legal in only two states: Connecticut and New York. It is partially legal in three others; Pennsylvania and Maryland permit fusion in certain elections (including judicial elections), and California allows fusion in presidential elections only.[26][page needed]


