In world demographics, the world population is the total number of humans currently living. It was estimated by the United Nations to have exceeded eight billion in mid-November 2022. It took around 300,000 years of human prehistory and history for the human population to reach a billion and only 222 years more to reach 8 billion.[2]

The human population has experienced continuous growth following the Great Famine of 1315–1317 and the end of the Black Death in 1350, when it was nearly 370,000,000.[3] The highest global population growth rates, with increases of over 1.8% per year, occurred between 1955 and 1975, peaking at 2.1% between 1965 and 1970.[4] The growth rate declined to 1.1% between 2015 and 2020 and is projected to decline further in the 21st century.[5] The global population is still increasing, but there is significant uncertainty about its long-term trajectory due to changing fertility and mortality rates.[6] The UN Department of Economics and Social Affairs projects between 9 and 10 billion people by 2050 and gives an 80% confidence interval of 10–12 billion by the end of the 21st century,[1] with a growth rate by then of zero. Other demographers predict that the human population will begin to decline in the second half of the 21st century.[7]
The total number of births globally is currently (2015–2020) 140 million/year, which is projected to peak during the period 2040–2045 at 141 million/year and then decline slowly to 126 million/year by 2100.[8] The total number of deaths is currently 57 million/year and is projected to grow steadily to 121 million/year by 2100.[9]
The median age of human beings as of 2020[update] is 31 years.[10]
History

Estimates of world population by their nature are an aspect of modernity, possible only since the Age of Discovery. Early estimates for the population of the world[11] date to the 17th century: William Petty, in 1682, estimated the world population at 320 million (current estimates ranging close to twice this number); by the late 18th century, estimates ranged close to one billion (consistent with current estimates).[12] More refined estimates, broken down by continents, were published in the first half of the 19th century, at 600 million to 1 billion in the early 1800s and 800 million to 1 billion in the 1840s.[13]
It is difficult for estimates to be better than rough approximations, as even current population estimates are fraught with uncertainties from 3% to 5%.[14]
Ancient and post-classical history
Estimates of the population of the world at the time agriculture emerged in around 10,000 BC have ranged between 1 million and 15 million.[15][16] Even earlier, genetic evidence suggests humans may have gone through a population bottleneck of between 1,000 and 10,000 people about 70,000 BC, according to the now largely discredited Toba catastrophe theory. By contrast, it is estimated that around 50–60 million people lived in the combined eastern and western Roman Empire in the 4th century AD.[17]
The Plague of Justinian caused Europe's population to drop by around 50% between the 6th and 8th centuries AD.[18] The population of Europe was more than 70 million in 1340.[19] From 1340 to 1400, the world's population fell from an estimated 443 million to 350–375 million,[20] with the Indian subcontinent suffering the most tremendous loss and Europe suffering the Black Death pandemic;[21] it took 200 years for European population figures to recover.[22] The population of China decreased from 123 million in 1200 to 65 million in 1393,[23] presumably from a combination of Mongol invasions, famine, and plague.[24]
Starting in AD 2, the Han dynasty of ancient China kept consistent family registers to properly assess the poll taxes and labor service duties of each household.[25] In that year, the population of Western Han was recorded as 57,671,400 individuals in 12,366,470 households, decreasing to 47,566,772 individuals in 9,348,227 households by AD 146, towards the end of the Han dynasty.[25] From 200 to 400, the world population fell from an estimated 257 million to 206 million, with China suffering the greatest loss.[21] At the founding of the Ming dynasty in 1368, China's population was reported to be close to 60 million; toward the end of the dynasty in 1644, it may have approached 150 million.[26] England's population reached an estimated 5.6 million in 1650, up from an estimated 2.6 million in 1500.[27] New crops that were brought to Asia and Europe from the Americas by Portuguese and Spanish colonists in the 16th century are believed to have contributed to population growth.[28][29][30] Since their introduction to Africa by Portuguese traders in the 16th century,[31] maize and cassava have similarly replaced traditional African crops as the most important staple food crops grown on the continent.[32]
The pre-Columbian population of the Americas is uncertain; historian David Henige called it "the most unanswerable question in the world."[33] By the end of the 20th century, scholarly consensus favored an estimate of roughly 55 million people, but numbers from various sources have ranged from 10 million to 100 million.[34] Encounters between European explorers and populations in the rest of the world often introduced local epidemics of extraordinary virulence.[35] According to the most extreme scholarly claims, as many as 90% of the Native American population of the New World died of Old World diseases such as smallpox, measles, and influenza.[36] Over the centuries, the Europeans had developed high degrees of immunity to these diseases, while the indigenous peoples had no such immunity.[37]
Modern history

During the European Agricultural and Industrial Revolutions, the life expectancy of children increased dramatically.[40] The percentage of the children born in London who died before the age of five decreased from 74.5% in 1730–1749 to 31.8% in 1810–1829.[41][42] Between 1700 and 1900, Europe's population increased from about 100 million to over 400 million.[43] Altogether, the areas populated by people of European descent comprised 36% of the world's population in 1900.[44]
Population growth in the Western world became more rapid after the introduction of vaccination and other improvements in medicine and sanitation.[45] Improved material conditions led to the population of Britain increasing from 10 million to 40 million in the 19th century.[46] The population of the United Kingdom reached 60 million in 2006.[47] The United States saw its population grow from around 5.3 million in 1800 to 106 million in 1920, exceeding 307 million in 2010.[48]
The first half of the 20th century in Imperial Russia and the Soviet Union was marked by a succession of major wars, famines and other disasters which caused large-scale population losses (approximately 60 million excess deaths).[49][50] After the collapse of the Soviet Union, Russia's population declined significantly – from 150 million in 1991 to 143 million in 2012[51] – but by 2013 this decline appeared to have halted.[52]
Many countries in the developing world have experienced extremely rapid population growth since the early 20th century, due to economic development and improvements in public health. China's population rose from approximately 430 million in 1850 to 580 million in 1953,[53] and now stands at over 1.3 billion. The population of the Indian subcontinent, which was about 125 million in 1750, increased to 389 million in 1941;[54] today, India, Pakistan and Bangladesh are collectively home to about 1.63 billion people.[55] Java, an island in Indonesia, had about 5 million inhabitants in 1815; it had a population of over 139 million in 2020.[56] In just one hundred years, the population of Brazil decupled (x10), from about 17 million in 1900, or about 1% of the world population in that year, to about 176 million in 2000, or almost 3% of the global population in the very early 21st century. Mexico's population grew from 13.6 million in 1900 to about 112 million in 2010.[57][58] Between the 1920s and 2000s, Kenya's population grew from 2.9 million to 37 million.[59]
Milestones by the billions
| Population | 1 | 2 | 3 | 4 | 5 | 6 | 7 | 8 | 9 | 10 |
|---|---|---|---|---|---|---|---|---|---|---|
| Year | 1804 | 1927 | 1960 | 1974 | 1987 | 1999 | 2011 | 2022 | 2037 | 2057 |
| Years elapsed | 200,000+ | 123 | 33 | 14 | 13 | 12 | 12 | 11 | 15 | 20 |
The UN estimated that the world population reached one billion for the first time in 1804. It was another 123 years before it reached two billion in 1927, but it took only 33 years to reach three billion in 1960.[61] Thereafter, it took 14 years for the global population to reach four billion in 1974, 13 years to reach five billion in 1987, 12 years to reach six billion in 1999 and, according to the United States Census Bureau, 13 years to reach seven billion in March 2012.[62] The United Nations, however, estimated that the world population reached seven billion in October 2011.[63][64][65]
According to the UN, the global population reached eight billion in November 2022,[66] but because the growth rate is slowing, it will take another 15 years to reach around 9 billion by 2037 and 20 years to reach 10 billion by 2057.[67] Alternative scenarios for 2050 range from a low of 7.4 billion to a high of more than 10.6 billion.[68] Projected figures vary depending on underlying statistical assumptions and the variables used in projection calculations, especially the fertility and mortality variables. Long-range predictions to 2150 range from a population decline to 3.2 billion in the "low scenario", to "high scenarios" of 24.8 billion.[68] One extreme scenario predicted a massive increase to 256 billion by 2150, assuming the global fertility rate remained at its 1995 level of 3.04 children per woman; however, by 2010 the global fertility rate had declined to 2.52.[69][70]
There is no estimation for the exact day or month the world's population surpassed one or two billion. The points at which it reached three and four billion were not officially noted, but the International Database of the United States Census Bureau placed them in July 1959 and April 1974 respectively. The United Nations did determine, and commemorate, the "Day of 5 Billion" on 11 July 1987, and the "Day of 6 Billion" on 12 October 1999. The Population Division of the United Nations declared the "Day of Seven Billion" to be 31 October 2011.[71] The United Nations marked the birth of the eight billionth person on 15 November 2022.[72][66]
Global demographics

- >80
- 77.5–80
- 75–77.5
- 72.5–75
- 70–72.5
- 67.5–70
- 65–67.5
- 60–65
- 55–60
- 50–55
As of 2020, the global sex ratio is approximately 1.01 males to 1 female.[74] Approximately 24.7% of the global population is aged under 15, while 65.2% is aged 15–64 and 10.1% is aged 65 or over.[74] The median age of the world's population is estimated to be 31 years in 2020,[10] and is expected to rise to 37.9 years by 2050.[75]
According to the World Health Organization, the global average life expectancy is 73.3 years as of 2020, with women living an average of 75.9 years and men approximately 70.8 years.[76] In 2010, the global fertility rate was estimated at 2.44 children per woman.[77] In June 2012, British researchers calculated the total weight of Earth's human population as approximately 287 million tonnes (630 billion pounds), with the average person weighing around 62 kilograms (137 lb).[78]
The IMF estimated nominal 2021 gross world product at US$94.94 trillion, giving an annual global per capita figure of around US$12,290.[79] Around 9.3% of the world population live in extreme poverty, subsisting on less than US$1.9 per day;[80] around 8.9% are malnourished.[81] 87% of the world's over-15s are considered literate.[82] As of January 2024, there were about 5 billion global Internet users, constituting 66% of the world population.[83]
The Han Chinese are the world's largest single ethnic group, constituting over 19% of the global population in 2011.[84] The world's most-spoken languages[a] are English (1.132B), Mandarin Chinese (1.117B), Hindi (615M), Spanish (534M) and French (280M). More than three billion people speak an Indo-European language, which is the largest language family by number of speakers. Standard Arabic is a language with no native speakers, but the total number of speakers is estimated at 274 million people.[85]
The largest religious categories in the world as of 2020 are estimated as follows: Christianity (31%), Islam (25%), Unaffiliated (16%) and Hinduism (15%).[86]
Population by region
Six of the Earth's seven continents are permanently inhabited on a large scale. Asia is the most populous continent, with its 4.64 billion inhabitants accounting for 60% of the world population. The world's two most populated countries, India and China, together constitute about 36% of the world's population.Africa is the second most populated continent, with around 1.34 billion people, or 17% of the world's population.Europe's 747 million people make up 10% of the world's population as of 2020,while the Latin American and Caribbean regions are home to around 653 million (8%). Northern America, primarily consisting of the United States and Canada, has a population of around 368 million (5%),and Oceania, the least populated region, has about 42 million inhabitants (0.5%).[87] Antarctica only has a very small, fluctuating population of about 1200 people based mainly in polar science stations.[88]

| Region | 2022 (percent) | 2030 (percent) | 2050 (percent) |
|---|---|---|---|
| Sub-Saharan Africa | 1,152 (14.51%) | 1,401 (16.46%) | 2,094 (21.62%) |
| Northern Africa and Western Asia | 549 (6.91%) | 617 (7.25%) | 771 (7.96%) |
| Central Asia and Southern Asia | 2,075 (26.13%) | 2,248 (26.41%) | 2,575 (26.58%) |
| Eastern Asia and Southeastern Asia | 2,342 (29.49%) | 2,372 (27.87%) | 2,317 (23.92%) |
| Europe and Northern America | 1,120 (14.10%) | 1,129 (13.26%) | 1,125 (11.61%) |
| Latin America and the Caribbean | 658 (8.29%) | 695 (8.17%) | 749 (7.73%) |
| Australia and New Zealand | 31 (0.39%) | 34 (0.40%) | 38 (0.39%) |
| Oceania | 14 (0.18%) | 15 (0.18%) | 20 (0.21%) |
| World | 7,942 | 8,512 | 9,687 |
| Region | Density (inhabitants/km2) | Population (millions) | Most populous country | Most populous city (metropolitan area) |
|---|---|---|---|---|
| Asia | 104.1 | 4,641 | 1,439,090,595 –  India India | 13,515,000 –  Tokyo Metropolis Tokyo Metropolis(37,400,000 – Greater Tokyo Area) |
| Africa | 44.4 | 1,340 | 211,401,000 –  Nigeria Nigeria | 9,500,000 –  Cairo Cairo(20,076,000 – Greater Cairo) |
| Europe | 73.4 | 747 | 146,171,000 –  Russia, approx. 110 million in Europe Russia, approx. 110 million in Europe | 13,200,000 – Moscow (20,004,000 – Moscow metropolitan area) |
| Latin America | 24.1 | 653 | 214,103,000 –  Brazil Brazil | 12,252,000 – São Paulo City (21,650,000 – São Paulo Metro Area) |
| Northern America[note 1] | 14.9 | 368 | 332,909,000 –  United States United States | 8,804,000 – New York City (23,582,649 – New York metropolitan area[90]) |
| Oceania | 5 | 42 | 25,917,000 –  Australia Australia | 5,367,000 – Sydney |
| Antarctica | ~0 | 0.004[88] | N/A[note 2] | 1,258 –  McMurdo Station McMurdo Station |
Largest populations by country

.png)

Ten most populous countries
| Country / Dependency | Population | % of world | Date | Source (official or from the United Nations) |
|---|---|---|---|---|
| India | 1,425,775,850 | 17.6% | 14 Apr 2023 | UN projection[91] |
 China China | 1,412,600,000 | 17.4% | 31 Dec 2021 | National annual estimate[92] |
| United States | 336,373,018 | 4.15% | 28 Apr 2024 | National population clock[93] |
 Indonesia Indonesia | 278,696,200 | 3.44% | 1 Jul 2023 | National annual estimate[94] |
 Pakistan Pakistan | 229,488,994 | 2.83% | 1 Jul 2022 | UN projection[95] |
| Nigeria | 216,746,934 | 2.67% | 1 Jul 2022 | UN projection[95] |
| Brazil | 217,589,087 | 2.69% | 28 Apr 2024 | National population clock[96] |
 Bangladesh Bangladesh | 168,220,000 | 2.08% | 1 Jul 2020 | Annual Population Estimate[97] |
| Russia | 147,190,000 | 1.82% | 1 Oct 2021 | 2021 preliminary census results[98] |
 Mexico Mexico | 128,271,248 | 1.58% | 31 Mar 2022 |
Approximately 4.6 billion people live in these ten countries, representing around 57% of the world's population as of July 2023.
The UN estimates that by 2023 India will have overtaken China in having the largest population.[99][91]
| # | Most populous countries | 2000 | 2015 | 2030[A] | |
|---|---|---|---|---|---|
| 1 | China[B] | 1,270 | 1,376 | 1,416 | |
| 2 | India | 1,053 | 1,311 | 1,528 | |
| 3 | United States | 283 | 322 | 356 | |
| 4 | Indonesia | 212 | 258 | 295 | |
| 5 | Pakistan | 136 | 208 | 245 | |
| 6 | Brazil | 176 | 206 | 228 | |
| 7 | Nigeria | 123 | 182 | 263 | |
| 8 | Bangladesh | 131 | 161 | 186 | |
| 9 | Russia | 146 | 146 | 149 | |
| 10 | Mexico | 103 | 127 | 148 | |
| World total | 6,127 | 7,349 | 8,501 | ||
| Notes: | |||||
Most densely populated countries
The tables below list the world's most densely populated countries, both in absolute terms and in comparison to their total populations, as of November 2022. All areas and populations are from The World Factbook, unless otherwise noted.
.jpg)
| Rank | Country | Population | Area (km2) | Density (pop/km2) |
|---|---|---|---|---|
| 1 |  Singapore Singapore | 5,921,231 | 719 | 8,235 |
| 2 | Bangladesh | 165,650,475 | 148,460 | 1,116 |
| 3 | 5,223,000 | 6,025 | 867 | |
| 4 |  Taiwan[note 4] Taiwan[note 4] | 23,580,712 | 35,980 | 655 |
| 5 |  South Korea South Korea | 51,844,834 | 99,720 | 520 |
| 6 |  Lebanon Lebanon | 5,296,814 | 10,400 | 509 |
| 7 |  Rwanda Rwanda | 13,173,730 | 26,338 | 500 |
| 8 |  Burundi Burundi | 12,696,478 | 27,830 | 456 |
| 9 | India | 1,389,637,446 | 3,287,263 | 423 |
| 10 |  Netherlands Netherlands | 17,400,824 | 41,543 | 419 |

| Rank | Country | Population | Area (km2) | Density (pop/km2) | Population trend[citation needed] |
|---|---|---|---|---|---|
| 1 | India | 1,389,637,446 | 3,287,263 | 423 | Growing |
| 2 | Pakistan | 242,923,845 | 796,095 | 305 | Rapidly growing |
| 3 | Bangladesh | 165,650,475 | 148,460 | 1,116 | Growing |
| 4 | Japan | 124,214,766 | 377,915 | 329 | Declining[103] |
| 5 |  Philippines Philippines | 114,597,229 | 300,000 | 382 | Growing |
| 6 |  Vietnam Vietnam | 103,808,319 | 331,210 | 313 | Growing |
| 7 |  United Kingdom United Kingdom | 67,791,400 | 243,610 | 278 | Growing |
| 8 | South Korea | 51,844,834 | 99,720 | 520 | Steady |
| 9 | Taiwan | 23,580,712 | 35,980 | 655 | Steady |
| 10 |  Sri Lanka Sri Lanka | 23,187,516 | 65,610 | 353 | Growing |
Fluctuation
.svg)
Population size fluctuates at differing rates in differing regions. Nonetheless, population growth has been the long-standing trend on all inhabited continents, as well as in most individual states. During the 20th century, the global population saw its greatest increase in known history, rising from about 1.6 billion in 1900 to over 6 billion in 2000[104] as the whole world entered the early phases of what has come to be called the "demographic transition". Some of the key factors contributing to this increase included the lessening of the mortality rate in many countries by improved sanitation and medical advances, and a massive increase in agricultural productivity attributed to the Green Revolution.[105][106] By 2000, there were approximately ten times as many people on Earth as there had been in 1700.
However, this rapid growth did not last. During the period 2000–2005, the United Nations estimates that the world's population was growing at an annual rate of 1.3% (equivalent to around 80 million people), down from a peak of 2.1% during the period 1965–1970.[5] Globally, although the population growth rate has been steadily declining from its peak in 1968,[107] growth still remains high in Sub-Saharan Africa.[108]

_001.jpg)
In fact, during the 2010s, Japan and some countries in Europe began to reduce in population, due to sub-replacement fertility rates.[103]
In 2019, the United Nations reported that the rate of population growth continues to decline due to the ongoing global demographic transition. If this trend continues, the rate of growth may diminish to zero by 2100, concurrent with a world population plateau of 10.9 billion.[5][67] However, this is only one of many estimates published by the UN; in 2009, UN population projections for 2050 ranged between around 8 billion and 10.5 billion.[109] An alternative scenario is given by the statistician Jorgen Randers, who argues that traditional projections insufficiently take into account the downward impact of global urbanization on fertility. Randers' "most likely scenario" reveals a peak in the world population in the early 2040s at about 8.1 billion people, followed by decline.[110] Adrian Raftery, a University of Washington professor of statistics and of sociology, states that "there's a 70 percent probability the world population will not stabilize this century. Population, which had sort of fallen off the world's agenda, remains a very important issue."[111]
 Estimated world population figures, 10,000 BC – AD 2000
 Estimated world population figures, 10,000 BC – AD 2000 (in log y scale)
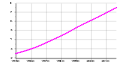 World population figures, 1950–2017

.png)

Annual population growth
| Year | Population | Yearly growth | Density (pop/km2) | |
|---|---|---|---|---|
| % | Number | |||
| 1951 | 2,543,130,380 | 1.75% | 43,808,223 | 17 |
| 1952 | 2,590,270,899 | 1.85% | 47,140,519 | 17 |
| 1953 | 2,640,278,797 | 1.93% | 50,007,898 | 18 |
| 1954 | 2,691,979,339 | 1.96% | 51,700,542 | 18 |
| 1955 | 2,746,072,141 | 2.01% | 54,092,802 | 18 |
| 1956 | 2,801,002,631 | 2.00% | 54,930,490 | 19 |
| 1957 | 2,857,866,857 | 2.03% | 56,864,226 | 19 |
| 1958 | 2,916,108,097 | 2.04% | 58,241,240 | 20 |
| 1959 | 2,970,292,188 | 1.86% | 54,184,091 | 20 |
| 1960 | 3,019,233,434 | 1.65% | 48,941,246 | 20 |
| 1961 | 3,068,370,609 | 1.63% | 49,137,175 | 21 |
| 1962 | 3,126,686,743 | 1.90% | 58,316,134 | 21 |
| 1963 | 3,195,779,247 | 2.21% | 69,092,504 | 21 |
| 1964 | 3,267,212,338 | 2.24% | 71,433,091 | 22 |
| 1965 | 3,337,111,983 | 2.14% | 69,899,645 | 22 |
| 1966 | 3,406,417,036 | 2.08% | 69,305,053 | 23 |
| 1967 | 3,475,448,166 | 2.03% | 69,031,130 | 23 |
| 1968 | 3,546,810,808 | 2.05% | 71,362,642 | 24 |
| 1969 | 3,620,655,275 | 2.08% | 73,844,467 | 24 |
| 1970 | 3,695,390,336 | 2.06% | 74,735,061 | 25 |
| 1971 | 3,770,163,092 | 2.02% | 74,772,756 | 25 |
| 1972 | 3,844,800,885 | 1.98% | 74,637,793 | 26 |
| 1973 | 3,920,251,504 | 1.96% | 75,450,619 | 26 |
| 1974 | 3,995,517,077 | 1.92% | 75,265,573 | 27 |
| 1975 | 4,069,437,231 | 1.85% | 73,920,154 | 27 |
| 1976 | 4,142,505,882 | 1.80% | 73,068,651 | 28 |
| 1977 | 4,215,772,490 | 1.77% | 73,266,608 | 28 |
| 1978 | 4,289,657,708 | 1.75% | 73,885,218 | 29 |
| 1979 | 4,365,582,871 | 1.77% | 75,925,163 | 29 |
| 1980 | 4,444,007,706 | 1.80% | 78,424,835 | 30 |
| 1981 | 4,524,627,658 | 1.81% | 80,619,952 | 30 |
| 1982 | 4,607,984,871 | 1.84% | 83,357,213 | 31 |
| 1983 | 4,691,884,238 | 1.82% | 83,899,367 | 32 |
| 1984 | 4,775,836,074 | 1.79% | 83,951,836 | 32 |
| 1985 | 4,861,730,613 | 1.80% | 85,894,539 | 33 |
| 1986 | 4,950,063,339 | 1.82% | 88,332,726 | 33 |
| 1987 | 5,040,984,495 | 1.84% | 90,921,156 | 34 |
| 1988 | 5,132,293,974 | 1.81% | 91,309,479 | 34 |
| 1989 | 5,223,704,308 | 1.78% | 91,410,334 | 35 |
| 1990 | 5,316,175,862 | 1.77% | 92,471,554 | 36 |
| 1991 | 5,406,245,867 | 1.69% | 90,070,005 | 36 |
| 1992 | 5,492,686,093 | 1.60% | 86,440,226 | 37 |
| 1993 | 5,577,433,523 | 1.54% | 84,747,430 | 37 |
| 1994 | 5,660,727,993 | 1.49% | 83,294,470 | 38 |
| 1995 | 5,743,219,454 | 1.46% | 82,491,461 | 39 |
| 1996 | 5,825,145,298 | 1.43% | 81,925,844 | 39 |
| 1997 | 5,906,481,261 | 1.40% | 81,335,963 | 40 |
| 1998 | 5,987,312,480 | 1.37% | 80,831,219 | 40 |
| 1999 | 6,067,758,458 | 1.34% | 80,445,978 | 41 |
| 2000 | 6,148,898,975 | 1.34% | 81,140,517 | 41 |
| 2001 | 6,230,746,982 | 1.33% | 81,848,007 | 42 |
| 2002 | 6,312,407,360 | 1.31% | 81,660,378 | 42 |
| 2003 | 6,393,898,365 | 1.29% | 81,491,005 | 43 |
| 2004 | 6,475,751,478 | 1.28% | 81,853,113 | 43 |
| 2005 | 6,558,176,119 | 1.27% | 82,424,641 | 44 |
| 2006 | 6,641,416,218 | 1.27% | 83,240,099 | 45 |
| 2007 | 6,725,948,544 | 1.27% | 84,532,326 | 45 |
| 2008 | 6,811,597,272 | 1.27% | 85,648,728 | 46 |
| 2009 | 6,898,305,908 | 1.27% | 86,708,636 | 46 |
| 2010 | 6,985,603,105 | 1.27% | 87,297,197 | 47 |
| 2011 | 7,073,125,425 | 1.25% | 87,522,320 | 47 |
| 2012 | 7,161,697,921 | 1.25% | 88,572,496 | 48 |
| 2013 | 7,250,593,370 | 1.24% | 88,895,449 | 49 |
| 2014 | 7,339,013,419 | 1.22% | 88,420,049 | 49 |
| 2015 | 7,426,597,537 | 1.19% | 87,584,118 | 50 |
| 2016 | 7,513,474,238 | 1.17% | 86,876,701 | 50 |
| 2017 | 7,599,822,404 | 1.15% | 86,348,166 | 51 |
| 2018 | 7,683,789,828 | 1.10% | 83,967,424 | 52 |
| 2019 | 7,764,951,032 | 1.06% | 81,161,204 | 52 |
| 2020 | 7,840,952,880 | 0.98% | 76,001,848 | 53 |
| 2021 | 7,909,295,151 | 0.87% | 68,342,271 | 53 |
| 2022 | 7,975,105,156 | 0.83% | 65,810,005 | 54 |
| 2023 | 8,045,311,447 | 0.88% | 70,206,291 | 54 |
Population growth by region
The table below shows historical and predicted regional population figures in millions.[113][114][115] The availability of historical population figures varies by region.
| Region | 1500 | 1600 | 1700 | 1750 | 1800 | 1850 | 1900 | 1950 | 1999 | 2008 | 2010 | 2012 | 2050 | 2150 |
|---|---|---|---|---|---|---|---|---|---|---|---|---|---|---|
| World | 585 | 660 | 710 | 791 | 978 | 1,262 | 1,650 | 2,521 | 6,008 | 6,707 | 6,896 | 7,052 | 9,725 | 9,746 |
| Africa | 86 | 114 | 106 | 106 | 107 | 111 | 133 | 221 | 783 | 973 | 1,022 | 1,052 | 2,478 | 2,308 |
| Asia | 282 | 350 | 411 | 502 | 635 | 809 | 947 | 1,402 | 3,700 | 4,054 | 4,164 | 4,250 | 5,267 | 5,561 |
| Europe | 168 | 170 | 178 | 190 | 203 | 276 | 408 | 547 | 675 | 732 | 738 | 740 | 734 | 517 |
| Latin America[Note 1] | 40 | 20 | 10 | 16 | 24 | 38 | 74 | 167 | 508 | 577 | 590 | 603 | 784 | 912 |
| Northern America[Note 1] | 6 | 3 | 2 | 2 | 7 | 26 | 82 | 172 | 312 | 337 | 345 | 351 | 433 | 398 |
| Oceania | 3 | 3 | 3 | 2 | 2 | 2 | 6 | 13 | 30 | 34 | 37 | 38 | 57 | 51 |
| Region | 1500 | 1600 | 1700 | 1750 | 1800 | 1850 | 1900 | 1950 | 1999 | 2008 | 2010 | 2012 | 2050 | 2150 |
|---|---|---|---|---|---|---|---|---|---|---|---|---|---|---|
| Africa | 14.7 | 17.3 | 14.9 | 13.4 | 10.9 | 8.8 | 8.1 | 8.8 | 13.0 | 14.5 | 14.8 | 15.2 | 25.5 | 23.7 |
| Asia | 48.2 | 53.0 | 57.9 | 63.5 | 64.9 | 64.1 | 57.4 | 55.6 | 61.6 | 60.4 | 60.4 | 60.3 | 54.2 | 57.1 |
| Europe | 28.7 | 25.8 | 25.1 | 20.6 | 20.8 | 21.9 | 24.7 | 21.7 | 11.2 | 10.9 | 10.7 | 10.5 | 7.6 | 5.3 |
| Latin America[Note 1] | 6.8 | 3.0 | 1.4 | 2.0 | 2.5 | 3.0 | 4.5 | 6.6 | 8.5 | 8.6 | 8.6 | 8.6 | 8.1 | 9.4 |
| Northern America[Note 1] | 1.0 | 0.5 | 0.3 | 0.3 | 0.7 | 2.1 | 5.0 | 6.8 | 5.2 | 5.0 | 5.0 | 5.0 | 4.5 | 4.1 |
| Oceania | 0.5 | 0.5 | 0.4 | 0.3 | 0.2 | 0.2 | 0.4 | 0.5 | 0.5 | 0.5 | 0.5 | 0.5 | 0.6 | 0.5 |
Past population
The following table gives estimates, in millions, of population in the past. The data for 1750 to 1900 are from the UN report "The World at Six Billion"[119] whereas the data from 1950 to 2015 are from a UN data sheet.[100]
| Year | World | Africa | Asia | Europe | Latin America & Carib.[Note 1] | North America [Note 1] | Oceania | Notes |
|---|---|---|---|---|---|---|---|---|
| 70,000 BC | < 0.015 | [120] | ||||||
| 10,000 BC | 4 | [121] | ||||||
| 8000 BC | 5 | |||||||
| 6500 BC | 5 | |||||||
| 5000 BC | 5 | |||||||
| 4000 BC | 7 | |||||||
| 3000 BC | 14 | |||||||
| 2000 BC | 27 | |||||||
| 1000 BC | 50 | 7 | 33 | 9 | [citation needed] | |||
| 500 BC | 100 | 14 | 66 | 16 | ||||
| AD 1 | 200 | 23 | 141 | 28 | ||||
| 1000 | 400 | 70 | 269 | 50 | 8 | 1 | 2 | |
| 1500 | 458 | 86 | 243 | 84 | 39 | 3 | 3 | |
| 1600 | 580 | 114 | 339 | 111 | 10 | 3 | 3 | |
| 1700 | 682 | 106 | 436 | 125 | 10 | 2 | 3 | |
| 1750 | 791 | 106 | 502 | 163 | 16 | 2 | 2 | |
| 1800 | 1,000 | 107 | 656 | 203 | 24 | 7 | 3 | |
| 1850 | 1,262 | 111 | 809 | 276 | 38 | 26 | 2 | |
| 1900 | 1,650 | 133 | 947 | 408 | 74 | 82 | 6 | |
| 1950 | 2,525 | 229 | 1,394 | 549 | 169 | 172 | 12.7 | [122] |
| 1955 | 2,758 | 254 | 1,534 | 577 | 193 | 187 | 14.2 | |
| 1960 | 3,018 | 285 | 1,687 | 606 | 221 | 204 | 15.8 | |
| 1965 | 3,322 | 322 | 1,875 | 635 | 254 | 219 | 17.5 | |
| 1970 | 3,682 | 366 | 2,120 | 657 | 288 | 231 | 19.7 | |
| 1975 | 4,061 | 416 | 2,378 | 677 | 326 | 242 | 21.5 | |
| 1980 | 4,440 | 478 | 2,626 | 694 | 365 | 254 | 23.0 | |
| 1985 | 4,853 | 550 | 2,897 | 708 | 406 | 267 | 24.9 | |
| 1990 | 5,310 | 632 | 3,202 | 721 | 447 | 281 | 27.0 | |
| 1995 | 5,735 | 720 | 3,475 | 728 | 487 | 296 | 29.1 | |
| 2000 | 6,127 | 814 | 3,714 | 726 | 527 | 314 | 31.1 | |
| 2005 | 6,520 | 920 | 3,945 | 729 | 564 | 329 | 33.4 | |
| 2010 | 6,930 | 1,044 | 4,170 | 735 | 600 | 344 | 36.4 | |
| 2015 | 7,349 | 1,186 | 4,393 | 738 | 634 | 358 | 39.3 |
Using the above figures, the change in population from 2010 to 2015 was:
- World: +420 million
- Africa: +142 million
- Asia: +223 million
- Europe: +3 million
- Latin America and Caribbean: +35 million
- Northern America: +14 million
- Oceania: +2.9 million
Projections
Long-term global population growth is difficult to predict. The United Nations and the US Census Bureau both give different estimates – according to the UN, the world population reached seven billion in late 2011,[113] while the USCB asserted that this occurred in March 2012.[123] Since 1951 the UN has issued multiple projections of future world population, based on different assumptions. From 2000 to 2005, the UN consistently revised these projections downward, until the 2006 revision, issued on 14 March 2007, revised the 2050 mid-range estimate upwards by 273 million.[citation needed]
Complicating the UN's and others' attempts to project future populations is the fact that average global birth rates, as well as mortality rates, are declining rapidly, as the nations of the world progress through the stages of the demographic transition, but both vary greatly between developed countries (where birth rates and mortality rates are often low) and developing countries (where birth and mortality rates typically remain high). Different ethnicities also display varying birth rates.[citation needed] Both of these can change rapidly due to disease epidemics, wars and other mass catastrophes, or advances in medicine and public health.
The UN's first report in 1951 showed that during the period 1950–55 the crude birth rate was 36.9/1,000 population and the crude death rate was 19.1/1,000. By the period 2015–20 both numbers had dropped significantly to 18.5/1,000 for the crude birth rate and 7.5/1,000 for the crude death rate. UN projections for 2100 show a further decline in the crude birth rate to 11.6/1,000 and an increase in the crude death rate to 11.2/1,000.[124],[125]
The total number of births globally is currently (2015–20) 140 million/year, is projected to peak during the period 2040–45 at 141 million/year and thereafter decline slowly to 126 million/year by 2100.[8] The total number of deaths is currently 57 million/year and is projected to grow steadily to 121 million/year by 2100.[9]
2012 United Nations projections show a continued increase in population in the near future with a steady decline in population growth rate; the global population is expected to reach between 8.3 and 10.9 billion by 2050.[126][127] 2003 UN Population Division population projections for the year 2150 range between 3.2 and 24.8 billion.[69] One of many independent mathematical models supports the lower estimate,[128] while a 2014 estimate forecasts between 9.3 and 12.6 billion in 2100, and continued growth thereafter.[129][130] The 2019 Revision of the UN estimates gives the "medium variant" population as; nearly 8.6 billion in 2030, about 9.7 billion in 2050 and about 10.9 billion in 2100.[131] In December 2019, the German Foundation for World Population projected that the global population will reach 8 billion by 2023 as it increases by 156 every minute.[132] In a modeled future projection by the Institute for Health Metrics and Evaluation the global population was projected to peak in 2064 at 9.73 billion people and decline to 8.79 billion in 2100.[133] Some analysts have questioned the sustainability of further world population growth, highlighting the growing pressures on the environment,[134][135] global food supplies, and energy resources.[136][137][138]
| Year | UN est. (millions) | Difference | USCB est. (millions) | Difference |
|---|---|---|---|---|
| 2005 | 6,542 | – | 6,473 | – |
| 2010 | 6,957 | 415 | 6,866 | 393 |
| 2015 | 7,380 | 423 | 7,256 | 390 |
| 2020 | 7,795 | 415 | 7,643 | 380 |
| 2025 | 8,184 | 390 | 8,007 | 363 |
| 2030 | 8,549 | 364 | 8,341 | 334 |
| 2035 | 8,888 | 339 | 8,646 | 306 |
| 2040 | 9,199 | 311 | 8,926 | 280 |
| 2045 | 9,482 | 283 | 9,180 | 254 |
| 2050 | 9,735 | 253 | 9,408 | 228 |
| Year | World | Asia | Africa | Europe | Latin America/Caribbean | Northern America | Oceania |
|---|---|---|---|---|---|---|---|
| 2000 | 6,144 | 3,741 (60.9%) | 811 (13.2%) | 726 (11.8%) | 522 (8.5%) | 312 (5.1%) | 31 (0.5%) |
| 2005 | 6,542 | 3,978 (60.8%) | 916 (14.0%) | 729 (11.2%) | 558 (8.5%) | 327 (5.0%) | 34 (0.5%) |
| 2010 | 6,957 | 4,210 (60.5%) | 1,039 (14.9%) | 736 (10.6%) | 591 (8.5%) | 343 (4.9%) | 37 (0.5%) |
| 2015 | 7,380 | 4,434 (60.1%) | 1,182 (16.0%) | 743 (10.1%) | 624 (8.5%) | 357 (4.8%) | 40 (0.5%) |
| 2020 | 7,795 | 4,641 (59.5%) | 1,341 (17.2%) | 748 (9.6%) | 654 (8.4%) | 369 (4.7%) | 43 (0.6%) |
| 2025 | 8,184 | 4,823 (58.9%) | 1,509 (18.4%) | 746 (9.1%) | 682 (8.3%) | 380 (4.6%) | 45 (0.6%) |
| 2030 | 8,549 | 4,974 (58.2%) | 1,688 (19.8%) | 741 (8.7%) | 706 (8.3%) | 391 (4.6%) | 48 (0.6%) |
| 2035 | 8,888 | 5,096 (57.3%) | 1,878 (21.1%) | 735 (8.3%) | 726 (8.2%) | 401 (4.5%) | 50 (0.6%) |
| 2040 | 9,199 | 5,189 (56.4%) | 2,077 (22.6%) | 728 (7.9%) | 742 (8.1%) | 410 (4.5%) | 53 (0.6%) |
| 2045 | 9,482 | 5,253 (55.4%) | 2,282 (24.1%) | 720 (7.6%) | 754 (8.0%) | 418 (4.4%) | 55 (0.6%) |
| 2050 | 9,735 | 5,290 (54.3%) | 2,489 (25.6%) | 711 (7.3%) | 762 (7.8%) | 425 (4.4%) | 57 (0.6%) |
| 2055 | 9,958 | 5,302 (53.2%) | 2,698 (27.1%) | 700 (7.0%) | 767 (7.7%) | 432 (4.3%) | 60 (0.6%) |
| 2060 | 10,152 | 5,289 (52.1%) | 2,905 (28.6%) | 689 (6.8%) | 768 (7.6%) | 439 (4.3%) | 62 (0.6%) |
| 2065 | 10,318 | 5,256 (51.0%) | 3,109 (30.1%) | 677 (6.6%) | 765 (7.4%) | 447 (4.3%) | 64 (0.6%) |
| 2070 | 10,459 | 5,207 (49.8%) | 3,308 (31.6%) | 667 (6.4%) | 759 (7.3%) | 454 (4.3%) | 66 (0.6%) |
| 2075 | 10,577 | 5,143 (48.6%) | 3,499 (33.1%) | 657 (6.2%) | 750 (7.1%) | 461 (4.4%) | 67 (0.6%) |
| 2080 | 10,674 | 5,068 (47.5%) | 3,681 (34.5%) | 650 (6.1%) | 739 (6.9%) | 468 (4.4%) | 69 (0.7%) |
| 2085 | 10,750 | 4,987 (46.4%) | 3,851 (35.8%) | 643 (6.0%) | 726 (6.8%) | 474 (4.4%) | 71 (0.7%) |
| 2090 | 10,810 | 4,901 (45.3%) | 4,008 (37.1%) | 638 (5.9%) | 711 (6.6%) | 479 (4.4%) | 72 (0.7%) |
| 2095 | 10,852 | 4,812 (44.3%) | 4,152 (38.3%) | 634 (5.8%) | 696 (6.4%) | 485 (4.5%) | 74 (0.7%) |
| 2100 | 10,875 | 4,719 (43.4%) | 4,280 (39.4%) | 630 (5.8%) | 680 (6.3%) | 491 (4.5%) | 75 (0.7%) |
Mathematical approximations
In 1975, Sebastian von Hoerner proposed a formula for population growth which represented hyperbolic growth with an infinite population in 2025.[141] The hyperbolic growth of the world population observed until the 1970s was later correlated to a non-linear second-order positive feedback between demographic growth and technological development. This feedback can be described as follows: technological advance → increase in the carrying capacity of land for people → demographic growth → more people → more potential inventors → acceleration of technological advance → accelerating growth of the carrying capacity → faster population growth → accelerating growth of the number of potential inventors → faster technological advance → hence, the faster growth of the Earth's carrying capacity for people, and so on.[142] The transition from hyperbolic growth to slower rates of growth is related to the demographic transition.
According to the Russian demographer Sergey Kapitsa,[143] the world population grew between 67,000 BC and 1965 according to the following formula:

where
- N is current population,
- T is the current year,
- C = (1.86 ± 0.01)·1011,
- T0 = 2007 ± 1,
= 42 ± 1.
Years for world population to double
According to linear interpolation and extrapolation of UNDESA population estimates, the world population has doubled, or will double, in the years listed in the tables below (with two different starting points). During the 2nd millennium, each doubling took roughly half as long as the previous doubling, fitting the hyperbolic growth model mentioned above. However, after 2024, it is unlikely that there will be another doubling of the global population in the 21st century.[144]

| Population (in billions) | 0.5 | 1 | 2 | 4 | 8 | 16 | ||||||
|---|---|---|---|---|---|---|---|---|---|---|---|---|
| Year | 1500 | 1804 | 1927 | 1974 | 2022 | n/a | ||||||
| Years elapsed | — | 304 | 123 | 47 | 48 | — | ||||||
| Population (in billions) | 0.375 | 0.75 | 1.5 | 3 | 6 | 12 | ||||||
|---|---|---|---|---|---|---|---|---|---|---|---|---|
| Year | 1171 | 1715 | 1881 | 1960 | 1999 | c. 2100[145] | ||||||
| Years elapsed | — | 544 | 166 | 79 | 39 | c. 100+ | ||||||
Number of humans who have ever lived
The total number of humans who have ever lived is estimated to be approximately 100 billion. Such estimates can only be rough approximations, as even modern population estimates are subject to uncertainty of around 3% to 5%.[14] Kapitsa (1996) cites estimates ranging between 80 and 150 billion.[146] The PRB puts the figure at 117 billion as of 2020, estimating that the current world population is 6.7% of all the humans who have ever lived.[147] Haub (1995) prepared another figure, updated in 2002 and 2011; the 2011 figure was approximately 107 billion.[148][149][150] Haub characterized this figure as an estimate that required "selecting population sizes for different points from antiquity to the present and applying assumed birth rates to each period".[149]
Robust population data only exist for the last two or three centuries. Until the late 18th century, few governments had ever performed an accurate census. In many early attempts, such as in Ancient Egypt and the Persian Empire, the focus was on counting merely a subset of the population for purposes of taxation or military service.[151] Thus, there is a significant margin of error when estimating ancient global populations.
Pre-modern infant mortality rates are another critical factor for such an estimate; these rates are very difficult to estimate for ancient times due to a lack of accurate records. Haub (1995) estimates that around 40% of those who have ever lived did not survive beyond their first birthday. Haub also stated that "life expectancy at birth probably averaged only about ten years for most of human history",[149] which is not to be mistaken for the life expectancy after reaching adulthood. The latter equally depended on period, location and social standing, but calculations identify averages from roughly 30 years upward.
The National Institute of Corrections estimates that that the number of people who have ever lived will rise to 121 billion by 2050, 4 billion more than their 2021 estimate.[152]
Human population as a function of food availability
Individuals from a wide range of academic fields and political backgrounds have proposed that, like all other animal populations, any human population (and, by extension, the world population) predictably grows and shrinks according to available food supply, growing during an abundance of food and shrinking in times of scarcity.[153] This idea may run counter to the popular thinking that, as population grows, food supply must also be increased to support the growing population; instead, the claim here is that growing population is the result of a growing food supply. Notable proponents of this notion include: agronomist and insect ecologist David Pimentel,[154] behavioral scientist Russell Hopfenberg (the former two publishing a study on the topic in 2001),[155] anthropologist and activist Virginia Abernethy,[156] ecologist Garrett Hardin,[157] science writer and anthropologist Peter Farb, journalist Richard Manning,[158] environmental biologist Alan D. Thornhill,[159] cultural critic and writer Daniel Quinn,[160] and anarcho-primitivist John Zerzan.[161]
Scientists generally acknowledge that at least one significant factor contributing to population growth (or overpopulation) is that as agriculture advances in creating more food, the population consequently increases—the Neolithic Revolution and Green Revolution often specifically provided as examples of such agricultural breakthroughs.[162][163][164][165][166][167] Furthermore, certain scientific studies do lend evidence to food availability in particular being the dominant factor within a more recent timeframe.[168][169][154] Other studies take it as a basic model from which to make broad population conjectures.[162] The idea became taboo following the United Nations' 1994 International Conference on Population and Development, where framing human population growth as negatively impacting the natural environment became regarded as "anti-human".[170]
Most human populations throughout history validate this theory, as does the overall current global population. Populations of hunter-gatherers fluctuate in accordance with the amount of available food. The world human population began consistently and sharply to rise, and continues to do so, after sedentary agricultural lifestyles became common due to the Neolithic Revolution and its increased food supply.[171][164][167] This was, subsequent to the Green Revolution starting in the 1940s, followed by even more severely accelerated population growth. Often, wealthier countries send their surplus food resources to the aid of starving communities; however, some proponents of this theory argue that this seemingly beneficial strategy only results in further harm to those communities in the long run. Anthropologist Peter Farb, for example, has commented on the paradox that "intensification of production to feed an increased population leads to a still greater increase in population."[172] Environmental writer Daniel Quinn has also focused on this phenomenon, which he calls the "food race", coining a term he felt was comparable, in terms of both escalation and potential catastrophe, to the nuclear arms race.
Criticism of this theory can come from multiple angles, for example by demonstrating that human population is not solely an effect of food availability, but that the situation is more complex. For instance, other relevant factors that can increase or limit human population include fresh water availability, arable land availability, energy consumed per person, heat removal, forest products, and various nonrenewable resources like fertilizers.[173] Another criticism is that, in the modern era, birth rates are lowest in the developed nations, which also have the highest access to food. In fact, some developed countries have both a diminishing population and an abundant food supply. The United Nations projects that the population of 51 countries or areas, including Germany, Italy, Japan, and most of the states of the former Soviet Union, is expected to be lower in 2050 than in 2005.[174] This shows that, limited to the scope of the population living within a single given political boundary, particular human populations do not always grow to match the available food supply. However, the global population as a whole still grows in accordance with the total food supply and many of these wealthier countries are major exporters of food to poorer populations, so that, according to Hopfenberg and Pimentel's 2001 research, "it is through exports from food-rich to food-poor areas... that the population growth in these food-poor areas is further fueled.[154] Their study thus suggests that human population growth is an exacerbating feedback loop in which food availability creates a growing population, which then causes the misimpression that food production must be consequently expanded even further.[175]
Regardless of criticisms against the theory that population is a function of food availability, the human population is, on the global scale, undeniably increasing,[176] as is the net quantity of human food produced—a pattern that has been true for roughly 10,000 years, since the human development of agriculture. The fact that some affluent countries demonstrate negative population growth fails to discredit the theory as a whole, since the world has become a globalized system with food moving across national borders from areas of abundance to areas of scarcity. Hopfenberg and Pimentel's 2001 findings support both this[154] and Daniel Quinn's direct accusation, in the early 2010s, that "First World farmers are fueling the Third World population explosion".[177]
See also

- Demographics of the world
- Anthropocene
- Birth control
- Coastal population growth
- Demographic transition
- Doomsday argument
- Family planning
- Food security
- Human overpopulation
- Megacity
- Natalism
- One-child policy
- Population decline
- Population dynamics
- Population growth
- Two-child policy
Lists:
- List of countries and dependencies by population
- List of countries by past and projected future population
- List of countries by population growth rate
- List of countries by population in 1900
- List of countries and dependencies by population density
- List of largest cities
- Lists of organisms by population – for non-human global populations
- List of population concern organizations
- List of religious populations
- List of sovereign states and dependencies by total fertility rate
Historical:
Explanatory notes
References
Citations
General and cited sources
 This article incorporates public domain material from The World Factbook. CIA.
Further reading
- Cohen, Joel E. (1995). How Many People Can the Earth Support?. New York: W. W. Norton. ISBN 978-0-393-31495-3.
- Guinnane, Timothy W. (2023). "We Do Not Know the Population of Every Country in the World for the Past Two Thousand Years". The Journal of Economic History 83(3): 912–938. ISSN 0022-0507.
- "World Population Prospects, the 2010 Revision". United Nations Population Division. Retrieved 25 June 2013.
- "World Population Prospects, the 2012 Revision". United Nations Population Division. Retrieved 19 May 2014.
- "World Population History Graph" World population graph 10,000 BC – AD 1950.
- "World". The World Factbook. US Central Intelligence Agency (CIA). Retrieved 6 November 2012.
- "The World in Balance" (transcript). Two-part PBS Nova episode on world population. 20 April 2004. Retrieved 19 July 2013.
- "Global population: Faces of the future". The Economist. 22 June 2013. Retrieved 25 June 2013.
- Hopfenberg, Russell, and David Pimentel. "Human population numbers as a function of food supply." Environment, development and sustainability 3 (2001): 1–15.
External links
| External videos | |
|---|---|
 Why Most Humans Live Inside This Small Circle -RealLifeLore Why Most Humans Live Inside This Small Circle -RealLifeLore |
Organizations
- The Day of 6 Billion and 7 Billion – Official homepages maintained by UNFPA
- Population Reference Bureau – News and issues related to population
- Berlin Institute for Population and Development
Statistics and maps
- HiveGroup.com – World population statistics presented in a treemap interface
- Win.tue.nl – World countries mapped by population size
Population clocks